
A note on lower timeframe confirming price action…
Waiting for lower timeframe confirmation is our main tool to confirm strength within higher timeframe zones, and has really been the key to our trading success. It takes a little time to understand the subtle nuances, however, as each trade is never the same, but once you master the rhythm so to speak, you will be saved from countless unnecessary losing trades. The following is a list of what we look for:
- A break/retest of supply or demand dependent on which way you’re trading.
- A trendline break/retest.
- Buying/selling tails/wicks – essentially we look for a cluster of very obvious spikes off of lower timeframe support and resistance levels within the higher timeframe zone.
- Candlestick patterns. We tend to stick with pin bars and engulfing bars as these have proven to be the most effective.
We typically search for lower-timeframe confirmation between the M15 and H1 timeframes, since most of our higher-timeframe areas begin with the H4. Stops are usually placed 3-5 pips beyond confirming structures.
EUR/USD:
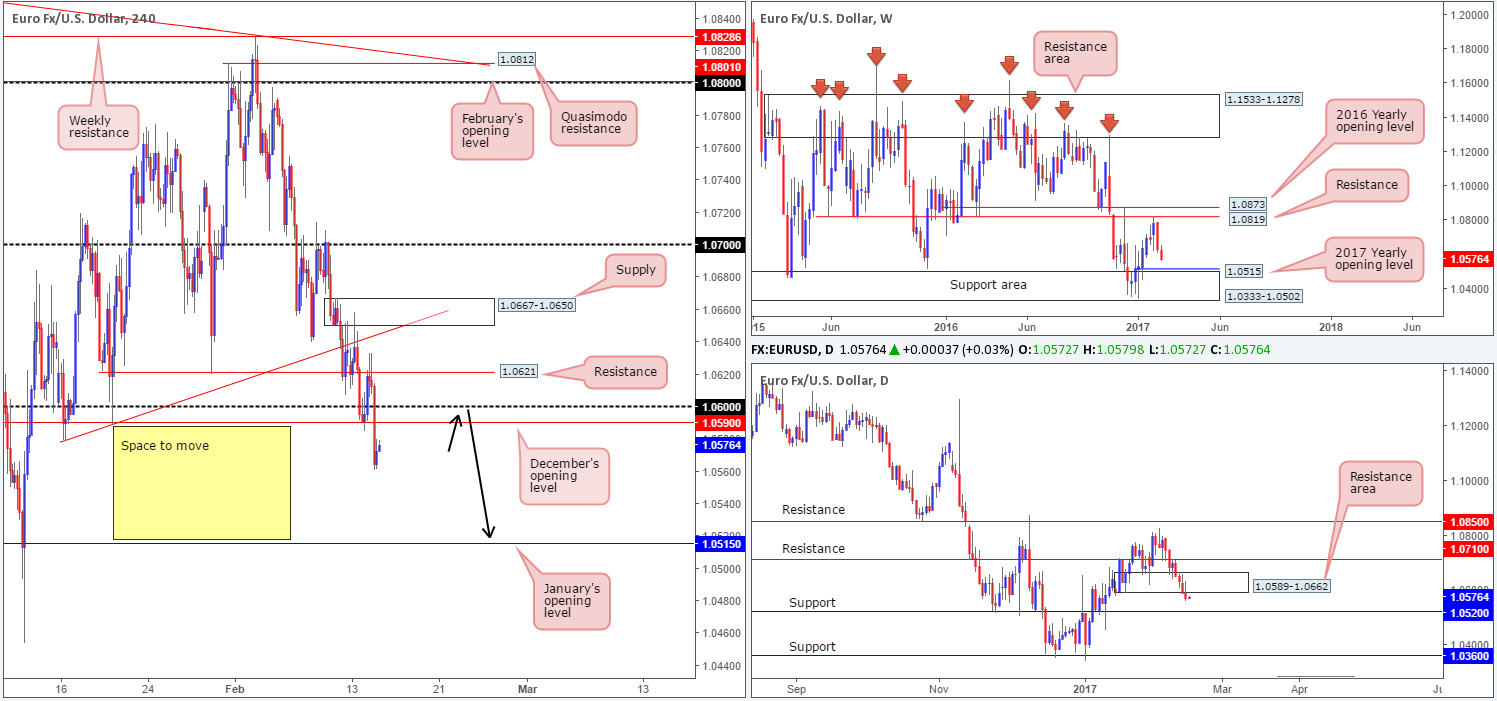
The US dollar received a boost going into the early hours of yesterday’s US segment, as Fed Chair Yellen’s testimony was upbeat on labor market conditions. This saw the EUR plummet lower, taking out both the 1.06 handle and December’s monthly opening level at 1.0590, and consequently registering its fourth consecutive daily loss. Provided that the bears remain in the driving seat, we see very little H4 supports standing in the way until we reach January’s opening level at 1.0515.
With the weekly bears looking on course to challenge the 2017 yearly opening level at 1.0515/weekly support area at 1.0333-1.0502, and daily demand at 1.0589-1.0662 (now acting resistance area) now out of the picture, the next downside target on the higher timeframes can be seen at a daily support level coming in at 1.0520.
Our suggestions: As per the black arrows on the H4 chart, we’re ultimately looking for a retest of 1.06/1.0590 today. Assuming that this comes to fruition, and price chalks in a reasonably sized H4 bear candle, our team would, dependent on time of day, look to sell, targeting the 1.0520/1.0515 neighborhood.
Data points to consider: US CPI and US retail sales scheduled for release at 1.30pm, with another day of testimony from Fed Chair Janet Yellen at 3pm. FOMC member Harker speaks at 5.45pm GMT.
Levels to watch/live orders:
- Buys: Flat (stop loss: N/A).
- Sells: 1.06/1.0590 ([waiting for a H4 bear candle to form from here is advised before pulling the trigger] stop loss: ideally beyond the trigger candle).
GBP/USD:
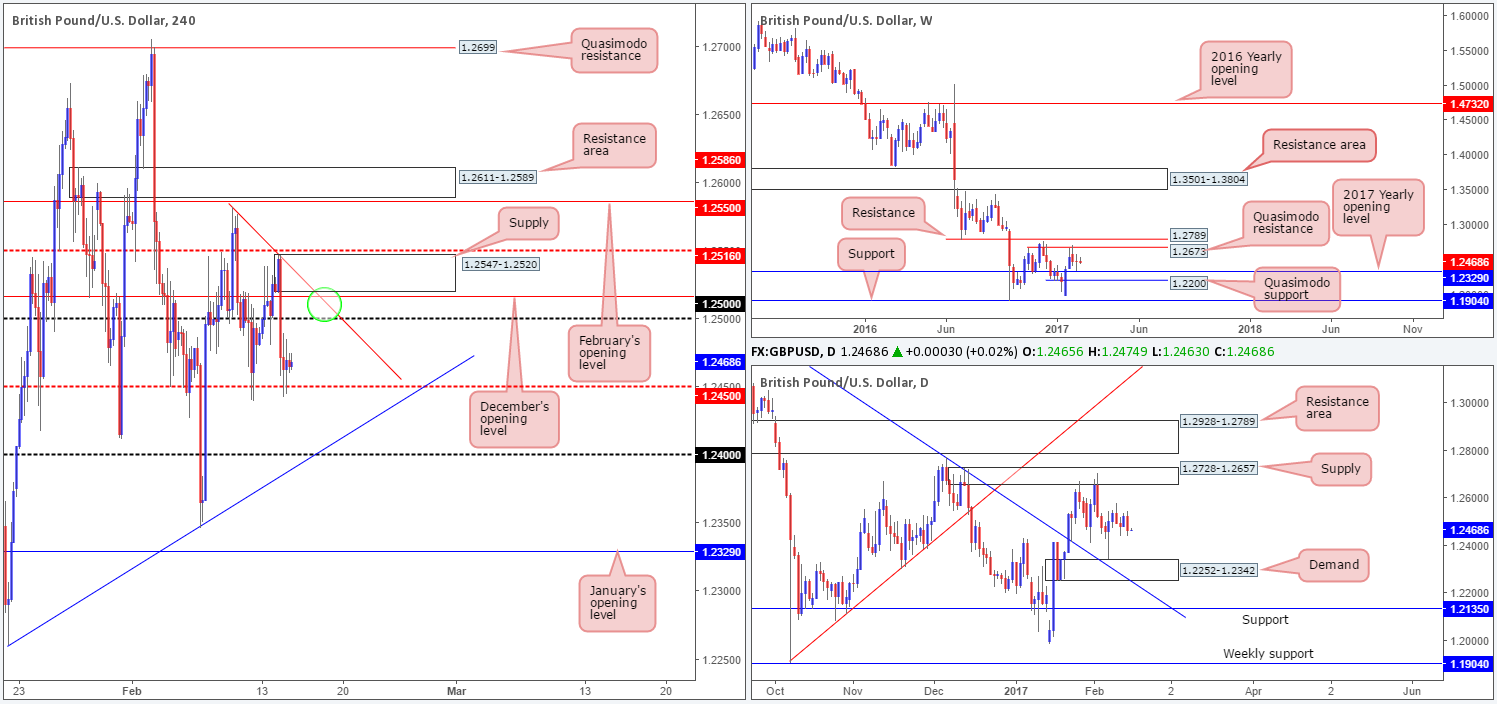
The aftermath of yesterday’s disappointing UK inflation print saw the GBP aggressively plummet lower against its US counterpart. As can be seen from the H4 scale, both December’s opening base at 1.2516 and the psychological level 1.25 were taken out during this bearish assault, and only began stabilizing once price connected with the H4 mid-way support at 1.2450.
As far as structure goes, there is unfortunately very little direction seen on the bigger picture at this time. The weekly candles are currently trading mid-range between the 2017 yearly opening level at 1.2329 and a weekly Quasimodo resistance coming in at 1.2673. By the same token, a similar pattern exists on the daily chart. Daily price is loitering between a daily demand at 1.2252-1.2342 (bolstered by a daily trendline support stretched from the high 1.3437) and a daily supply penciled in at 1.2728-1.2657.
Our suggestions: Seeing as how the pair lacks higher-timeframe (structural) direction at present, our attention is drawn to the H4 supply at 1.2547-1.2520 (green circle) for a possible bounce today. In addition to this zone’s strong bearish momentum, the area brings together a H4 trendline resistance taken from the high 1.2582, as well as December’s opening level at 1.2516. This confluence, as long as the H4 candles do not close above 1.25 on approach, would be sufficient enough to permit a short without the need to wait for additional confirmation, in our opinion. The reason for not wanting to see a H4 close above 1.25 on approach is that there is a rather large risk that buyers will look to defend this line and with our short just a few pips above here, which would naturally put us in a vulnerable position!
Data points to consider: UK employment data at 9.30am. US CPI and US retail sales scheduled for release at 1.30pm, with another day of testimony from Fed Chair Janet Yellen at 3pm. FOMC member Harker speaks at 5.45pm GMT.
Levels to watch/live orders:
- Buys: Flat (stop loss: N/A).
- Sells: 1.2547-1.2520 ([possible area to sell from without the need for additional confirmation] stop loss: 1.2252).
AUD/USD:
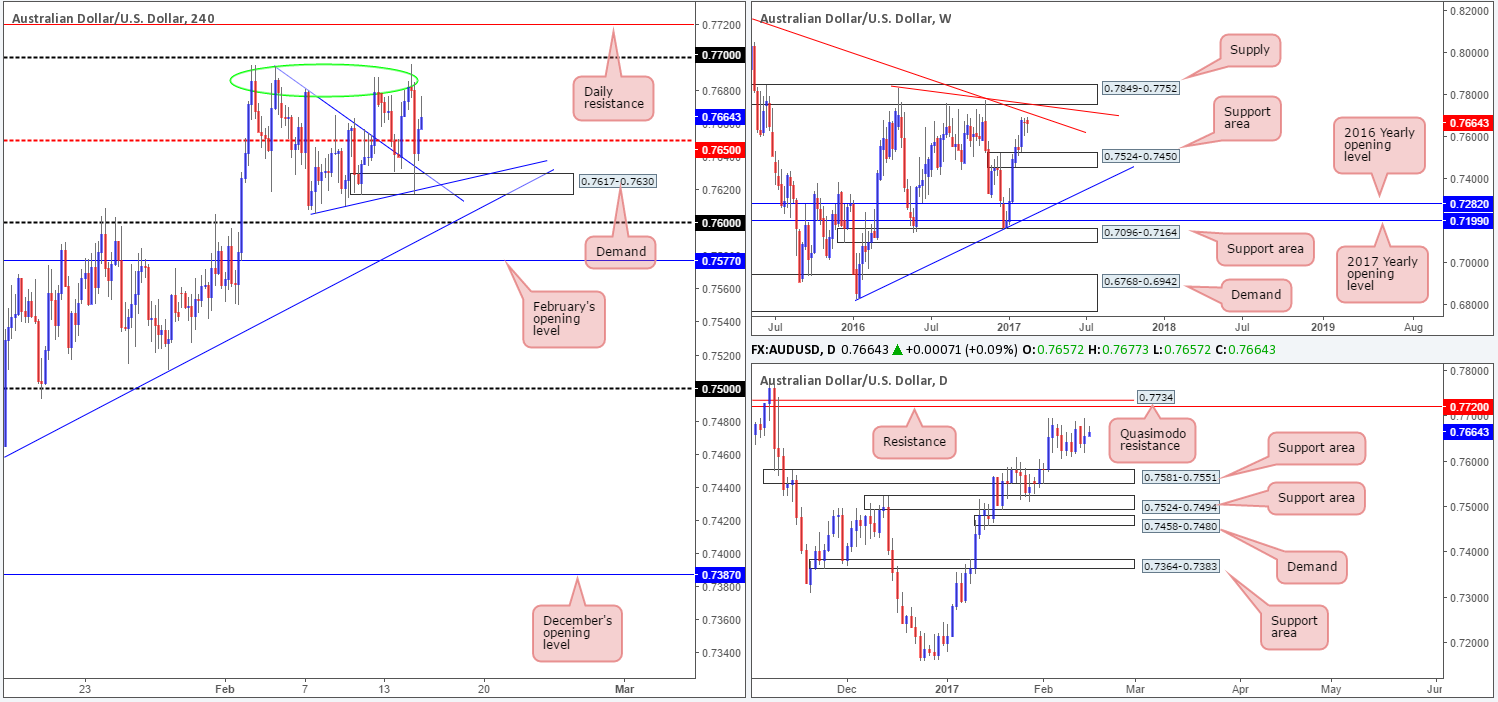
Following Yellen’s testimony the AUD/USD crumbled lower, consequently swallowing the H4 mid-way support at 0.7650, and only becoming stable once price shook hands with a H4 demand at 0.7617-0.7630 that merged nicely with two H4 trendline supports (0.7695/0.7605). On account of price whipsawing back above 0.7650 into the closing bell, where does one go from here?
We feel the commodity currency will look to challenge the tops that have formed (green circle) just ahead of the 0.77 handle today. Although this area looks tempting to short, we feel these tops, along with the 0.77 number, may be engulfed soon. Our reasoning lies within the higher-timeframe structures.
From the weekly chart, the Aussie remains lurking nearby a weekly trendline resistance taken from the high 0.8163, followed closely by a weekly supply zone logged in at 0.7849-0.7752 (bolstered by yet another weekly trendline resistance stretched from the high 0.7835). Additionally, we can also see that the weekly trendline resistance (0.8163) is positioned nearby a daily Quasimodo resistance penciled in at 0.7734 and a daily resistance at 0.7720.
Our suggestions: With the above notes in mind, we will not be looking for shorting opportunities at 0.77, but slightly above this region at 0.7752/0.7720. Ideally, a reasonably sized H4 bear candle printed from this zone would be a strong indication that the bears will likely take things lower from here. 0.7752 denotes the underside of the weekly supply, while 0.7720, as mentioned above, represents daily resistance. To that end, we feel we have a relatively strong-looking higher-timeframe sell zone in the making here.
Data points to consider: US CPI and US retail sales scheduled for release at 1.30pm, with another day of testimony from Fed Chair Janet Yellen at 3pm. FOMC member Harker speaks at 5.45pm GMT.
Levels to watch/live orders:
- Buys: Flat (stop loss: N/A).
- Sells: 0.7752/0.7720 ([wait for a H4 bear candle to form before pulling the trigger] stop loss: ideally beyond the trigger candle).
USD/JPY:
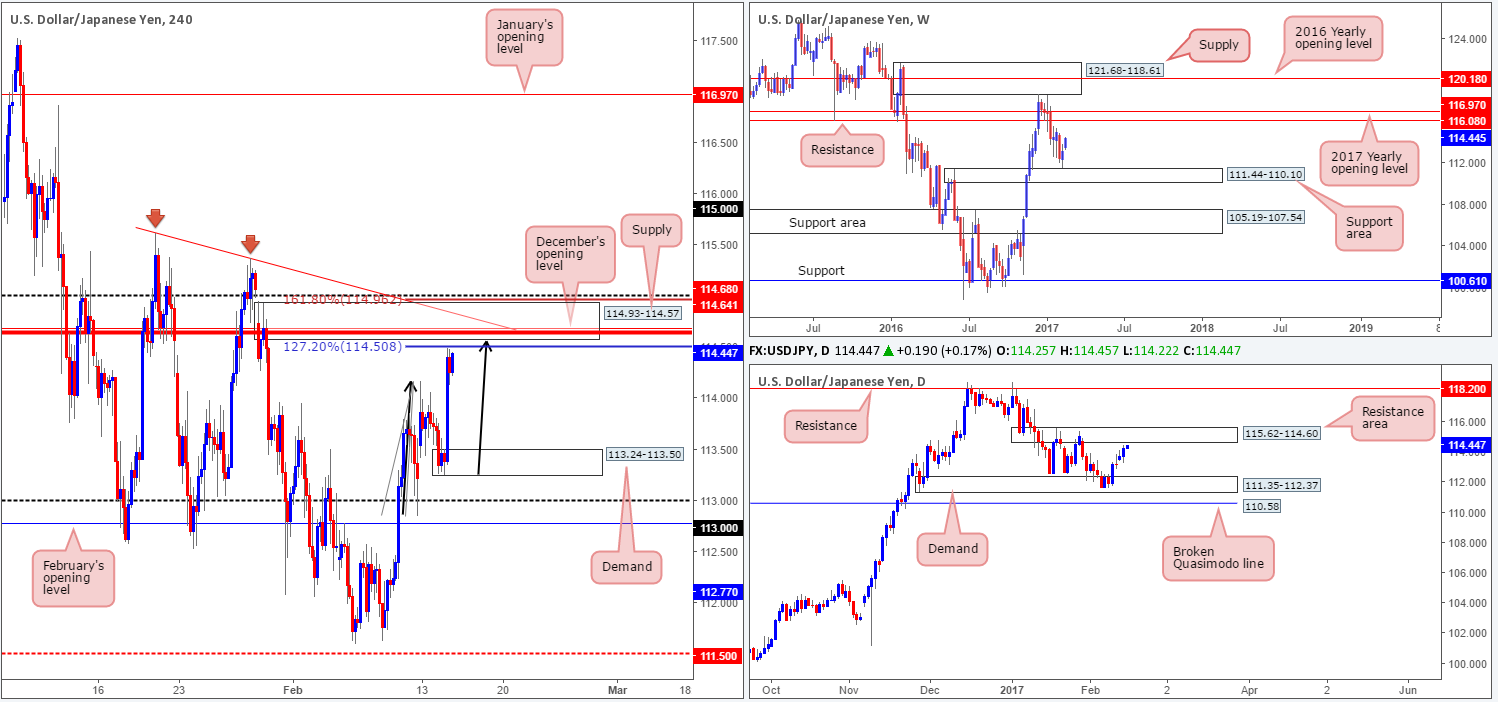
The impact of Yellen’s testimony drove the USD/JPY skywards yesterday, reaching a high of 114.49 on the day. To make a long story short, this has brought H4 price up to a nearby area of H4 supply at 114.93-114.57, which we feel will likely hold price lower today. There are a number of technical aspects that support this view:
- A H4 trendline resistance etched from the high 115.62.
- December’s opening level at 114.68.
- A H4 AB=CD approach which (symmetrically) concludes just ahead of the H4 supply mentioned above.
- Bolstered by a daily resistance area at 115.62-114.60.
Our suggestions: In light of the above confluence, our team is looking to short at 114.71, with the stop set a few pips above the H4 AB=CD 161.8% ext. (114.96) and round number (115) at 115.03. Please ignore the bold red line as this our alert, nothing more.
Data points to consider: US CPI and US retail sales scheduled for release at 1.30pm, with another day of testimony from Fed Chair Janet Yellen at 3pm. FOMC member Harker speaks at 5.45pm GMT.
Levels to watch/live orders:
- Buys: Flat (stop loss: N/A).
- Sells: 114.71 ([possible market order] stop loss: 115.03).
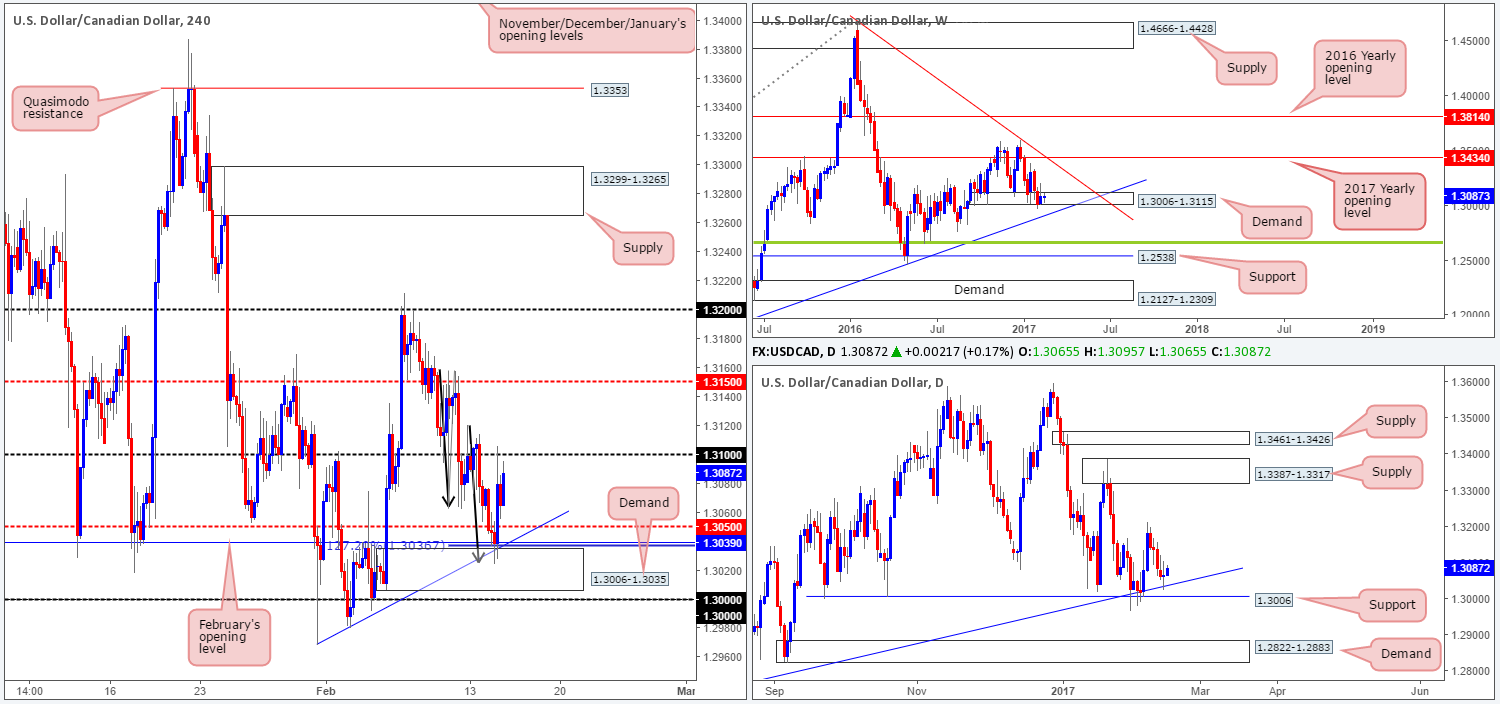
USD/CAD:
For those who read Tuesday’s report on the USD/CAD you may recall our desk highlighting the possibility of a long trade from the H4 demand at 1.3006-1.3035. Our interest in this zone was sparked by the strong confluence seen comprising of the following structures: February’s opening level at 1.3039, a H4 trendline support taken from the low 1.2968, a H4 AB=CD (see black arrows) 127.2% approach terminating around 1.3036 mark and to top it off there was also a daily trendline support taken from the low 1.2654 intersecting with this H4 zone.
As you can see, price responded beautifully to the top edge of this H4 area! However, we did in fact miss this setup since, as mentioned in Tuesday’s analysis, we required a reasonably sized H4 bull candle to take shape here before pressing the buy button. Well done to any of our readers who managed to get in on this trade call!
Going forward, we are looking for the 1.31 hurdle to be engulfed before making any further decisions on this pair regarding buys. A H4 close above this psychological boundary would not only likely open the gates for prices to challenge the H4 mid-way resistance at 1.3150, it would also further confirm upside from the aforementioned daily trendline support and also weekly demand at 1.3006-1.3115.
Our suggestions: Should a H4 close be seen beyond 1.31 today, this would be considered a bullish cue to begin watching for price to retest this number as support. If the retest is then followed up with a lower-timeframe buy signal (see the top of this report), we would look to trade long, targeting 1.3150 as an initial take-profit target.
Data points to consider: US CPI and US retail sales scheduled for release at 1.30pm, with another day of testimony from Fed Chair Janet Yellen at 3pm. FOMC member Harker speaks at 5.45pm. Canadian manufacturing at 1.30pm GMT.
Levels to watch/live orders:
- Buys: Watch for a H4 close above 1.31 and then look to trade any retest seen thereafter ([waiting for a lower-timeframe signal to form following the retest is advised before pulling the trigger] stop loss: dependent on where one confirms this zone).
- Sells: Flat (stop loss: N/A).
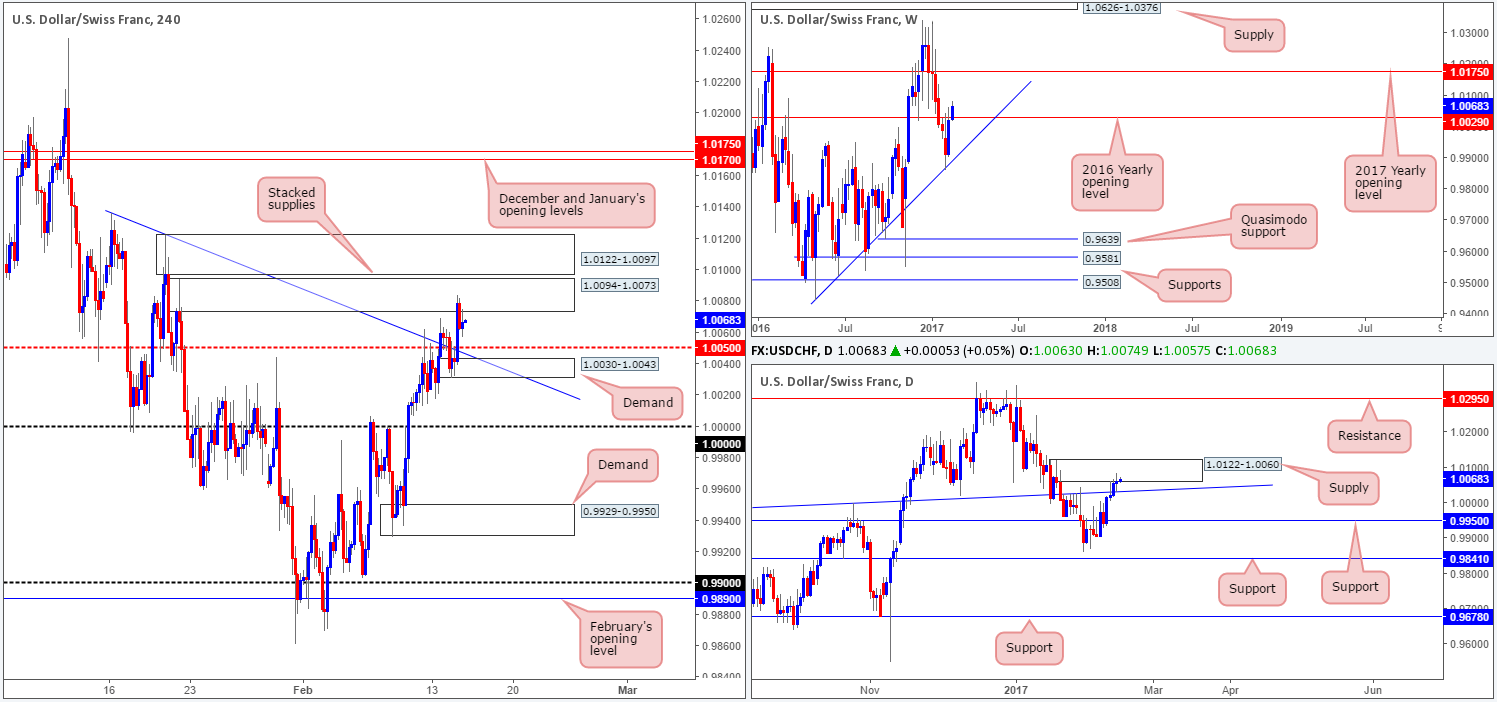
USD/CHF:
Let’s take this from this the top this morning. Looking at the weekly chart, weekly price is currently edging above the 2016 yearly opening level at 1.0029. In order to confirm this break, however, we would require a weekly close above here. The story on the daily chart shows that the buyers and sellers are seen battling for position between a daily supply zone drawn from 1.0122-1.0060, and a daily trendline support extended from the high 0.9956.
Stepping across to the H4 candles, we can see that the unit is teasing the underside of a H4 supply coming in at 1.0094-1.0073. Downside from this angle is somewhat limited given the nearby H4 mid-way support at 1.0050, H4 trendline support extended from the high 1.0136 and H4 demand at 1.0030-1.0043. A break of the current H4 supply, on the other hand, would only see price stretch into the H4 supply marked at 1.0122-1.0097, which, as you can probably see, is positioned within the upper edge of the aforementioned daily supply area.
Our suggestions: At the time of writing, we see very little room for price to move today. With that being the case, we’ll remain on the sidelines and wait for further developments.
Data points to consider: US CPI and US retail sales scheduled for release at 1.30pm, with another day of testimony from Fed Chair Janet Yellen at 3pm. FOMC member Harker speaks at 5.45pm GMT.
Levels to watch/live orders:
- Buys: Flat (stop loss: N/A).
- Sells: Flat (stop loss: N/A).
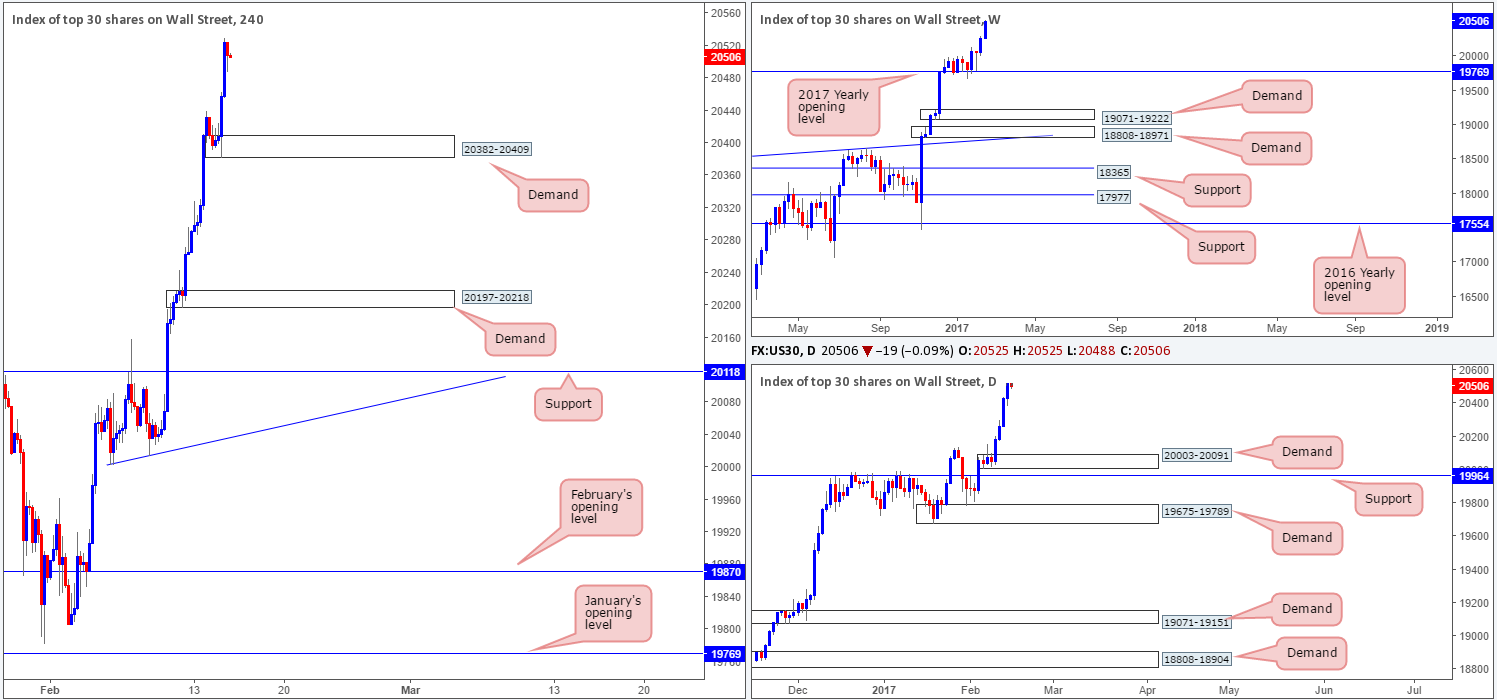
DOW 30:
Thanks largely to an upbeat testimony from the Fed Chair Janet Yellen yesterday, the buyers printed a fourth consecutive bull candle. Given that there is absolutely no weekly resistance levels in sight, the best we can do for the time being is continue looking to ‘buy the dips’. The closest higher-timeframe area can be seen at 20003-20091: a daily demand that is positioned directly above a daily support barrier at 19964.
Our suggestions: While the newly-formed H4 demand area at 20382-20409 boasts little higher-timeframe (structural) convergence, there’s a good chance that price will react from here should a pullback be seen today. However, trading this area would, at least for our team, require additional confirmation in the form a reasonably sized H4 bull candle.
Data points to consider: US CPI and US retail sales scheduled for release at 1.30pm, with another day of testimony from Fed Chair Janet Yellen at 3pm. FOMC member Harker speaks at 5.45pm GMT.
Levels to watch/live orders:
- Buys: 20382-20409 ([wait for a H4 bull candle to form before looking to execute a trade] stop loss: ideally beyond the trigger candle).
- Sells: Flat (stop loss: N/A).
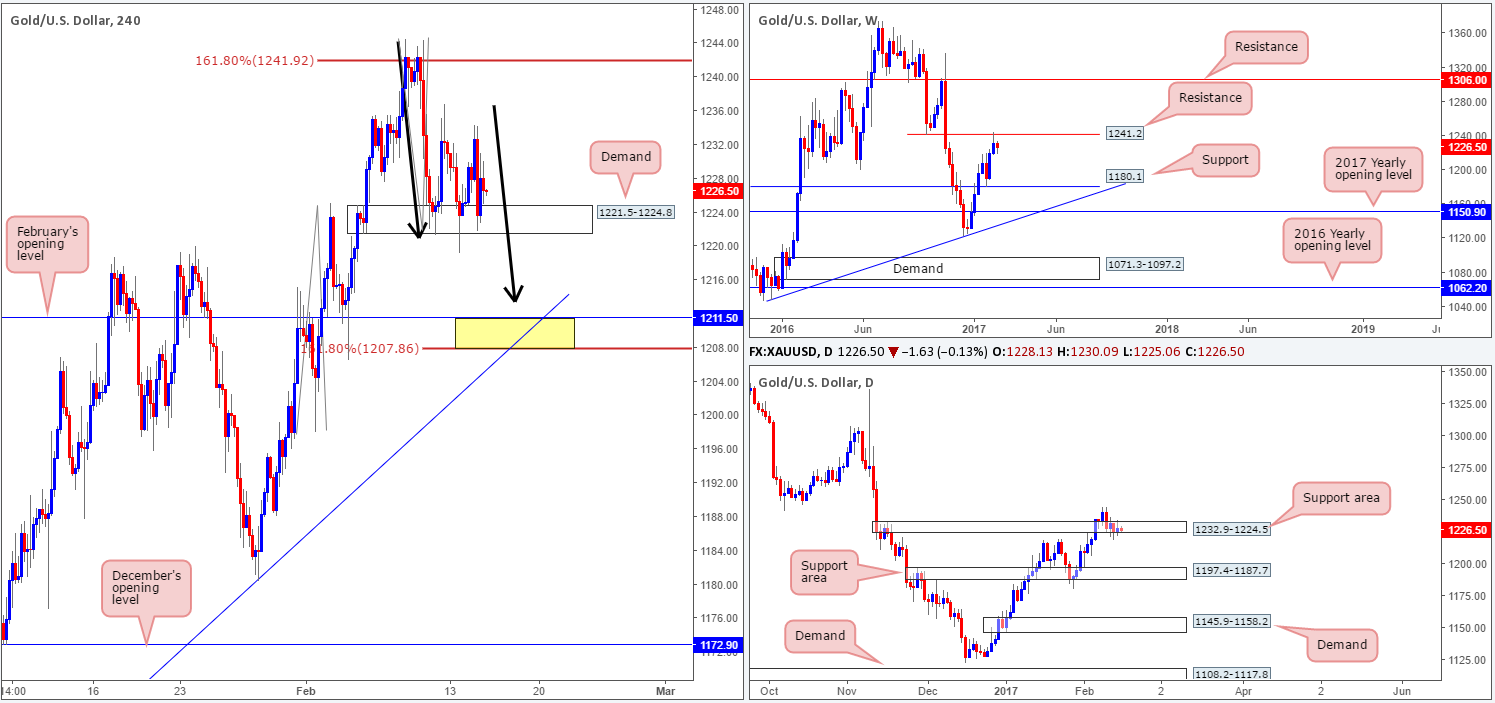
GOLD:
Despite the gold market recently tapping the underside of a weekly resistance level at 1241.2, H4 demand at 1221.5-1224.8, along with a daily support area at 1232.9-1224.5, continue to hold ground. For those who have been following our reports on gold recently you may recall our desk highlighting a short position we took from 1239.6, with a stop logged in at 1245.4. As mentioned in Friday’s report, we liquidated 70% of the position around the 1227.6-1230.5 area (which represented H4 demand at the time) and reduced risk to breakeven. Our next port of call for profit taking is still seen at February’s opening base drawn from 1211.5. However, before this can be achieved, price will have to overcome the current H4 demand area.
Our suggestions: What is still quite notable from recent trade is the possible H4 AB=CD pattern (see black arrows) terminating at the H4 161.8% ext. at 1207.8. Notice that it not only bottoms nearby the February opening level at 1211.5, it is also located nearby a H4 trendline support etched from the low 1145.9 (1207.8/1211.5 yellow zone). Not only is this a reasonable area to take profits on our current short position at 1239.6, it’s also a platform in which one could potentially hunt for long opportunities. With this area lacking higher-timeframe (structural) convergence, however, we would require a H4 bull candle to form here in order to validate this area before pulling the trigger.
Levels to watch/live orders:
- Buys: 1207.8/1211.5 ([wait for a H4 bull candle to form before looking to execute a trade] stop loss: ideally beyond the trigger candle).
- Sells: 1239.6 ([live order] stop loss: breakeven).


