
A note on lower timeframe confirming price action…
Waiting for lower timeframe confirmation is our main tool to confirm strength within higher timeframe zones, and has really been the key to our trading success. It takes a little time to understand the subtle nuances, however, as each trade is never the same, but once you master the rhythm so to speak, you will be saved from countless unnecessary losing trades. The following is a list of what we look for:
- A break/retest of supply or demand dependent on which way you’re trading.
- A trendline break/retest.
- Buying/selling tails/wicks – essentially we look for a cluster of very obvious spikes off of lower timeframe support and resistance levels within the higher timeframe zone.
- Candlestick patterns. We tend to only stick with pin bars and engulfing bars as these have proven to be the most effective.
We search for lower timeframe confirmation between the M15 and H1 timeframes, since most of our higher-timeframe areas begin with the H4. Stops are usually placed 5-10 pips beyond confirming structures.
EUR/USD:
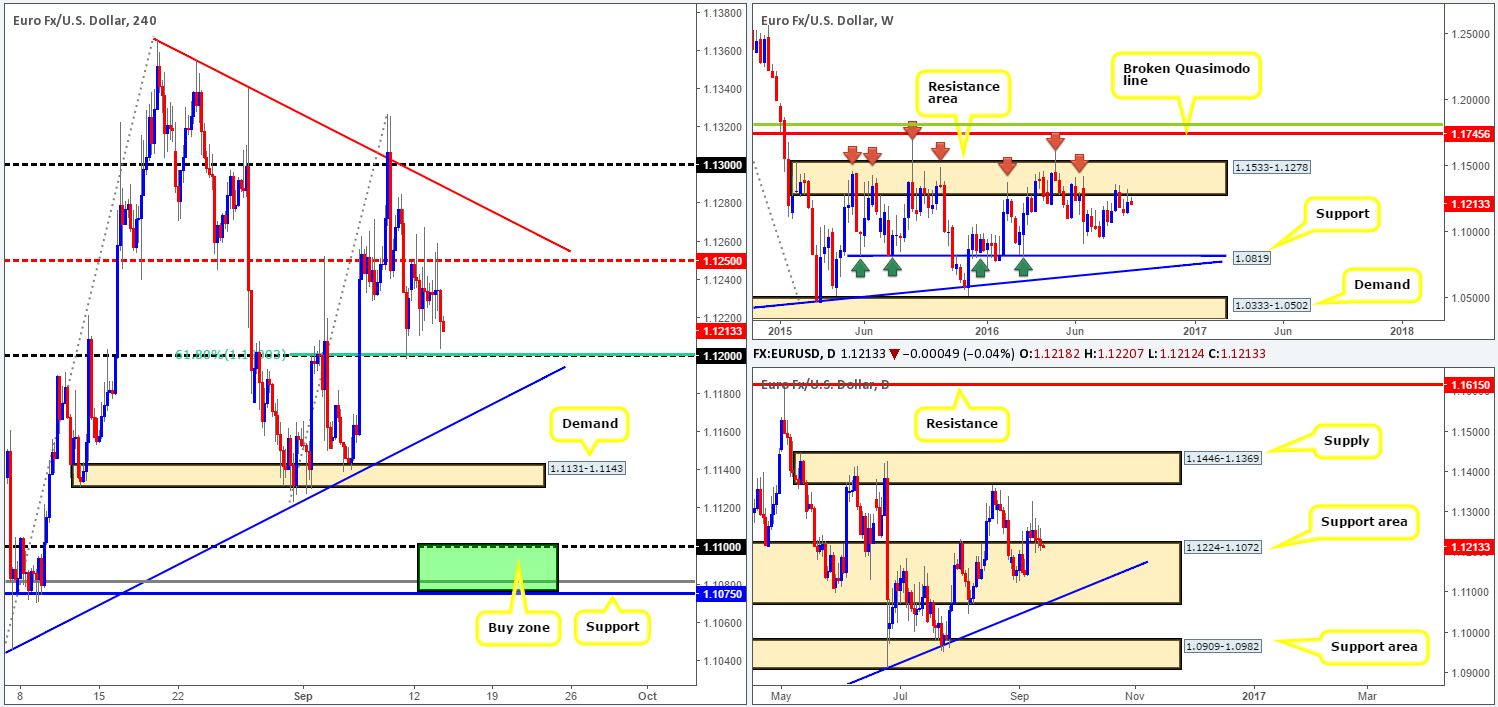
On the back of an overall stronger dollar, we can see that the EUR remained well-offered around the H4 mid-way resistance 1.1250 yesterday, consequently closing the day just ahead of the 1.12 band. Given that the overall structure of this pair has not changed since the week’s open, much of the following report will echo similar thoughts put forward in our previous analysis…
From a technical perspective, we feel a close beyond 1.12 is on the cards. Not only do we have the buyers and sellers seen battling for position around the underside of a major weekly resistance area at 1.1533-1.1278, there’s also little bullish intention currently being registered from the top edge of the daily support area at 1.1224-1.1072.Furthermore, the USD/CHF pair (an inversely correlated instrument to the EUR/USD) has recently peeked above a H4 resistance at 0.9762, thus increasing the chances of a push below 1.12.
Now don’t get us wrong, while there is a possibility of further consolidation around the current daily support area, we feel pressure from the overhead weekly supply will eventually push prices south to test the daily trendline taken from the low 1.0516.
Our suggestions: In the event that the market does indeed close below 1.12, a short trade could be possible on the retest of this number if followed up by a H4 bearish close. Should this come to view, we’d look to take profits at the following structures: the H4 trendline support taken from the low 1.1045 and the H4 demand base seen below it at 1.1131-1.1143. Our ultimate take-profit zone, nevertheless, is seen between the H4 support at 1.1075 and the 1.11 band. Not only is this a good take-profit area, it is also a fantastic barrier to look for longs. It sits within the depths of the aforementioned daily support area, and merges with both the above noted daily trendline support and also a deep H4 88.6% Fib support at 1.1081. Therefore, do keep an eyeball on this area during the week guys!
Levels to watch/live orders:
- Buys: 1.1075/1.11 [strong-looking buy zone which could, dependent on the time of day and approach, be sufficient enough to condone an entry without lower timeframe confirmation] (Stop loss: 1.1060).
- Sells: Watch for price to close below the 1.12 handle and then look to trade any retest seen thereafter (H4 bearish close required prior to pulling the trigger).
GBP/USD:
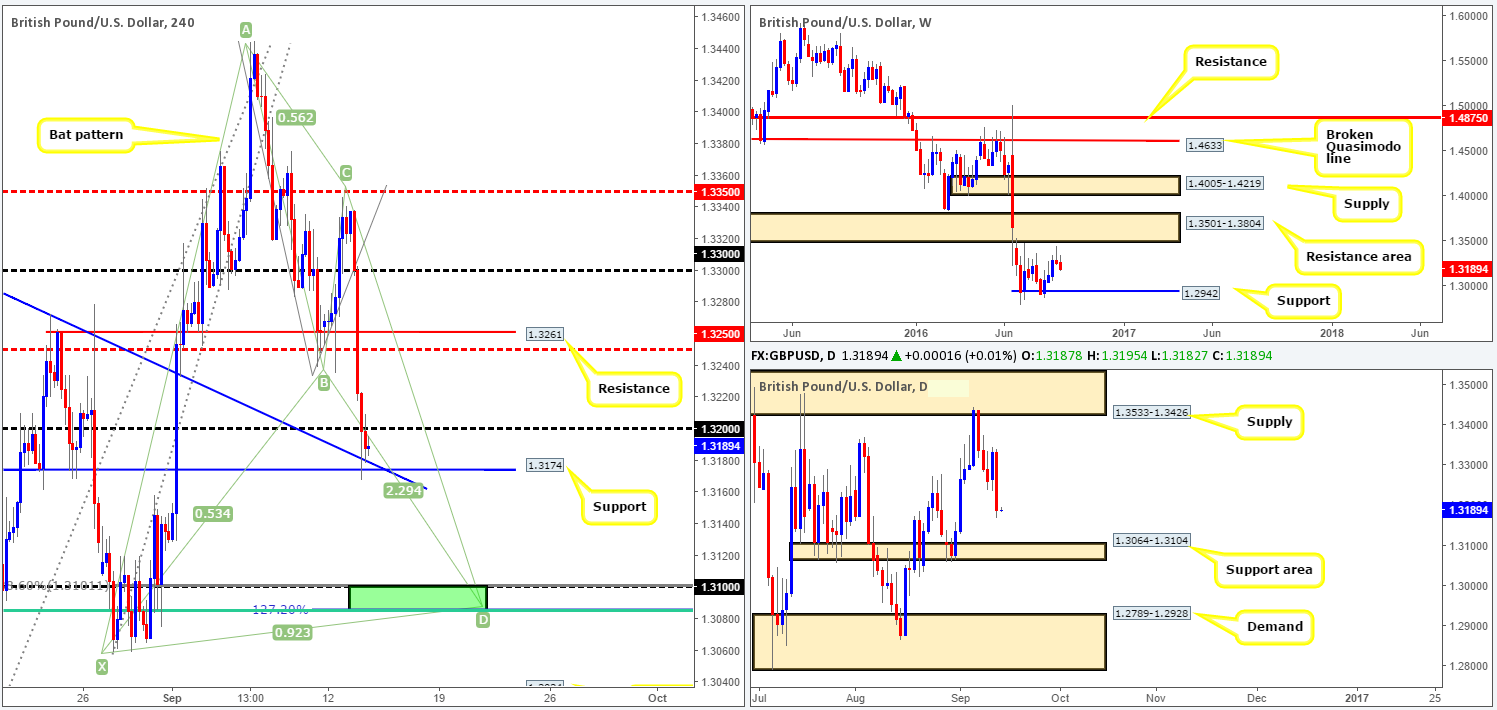
A string of disappointing UK data hit the wire yesterday, forcing cable to fall sharply into the close. Several technical supports were engulfed during this assault, with price only finding support once it connected with 1.3174, which, as you can probably see, merges nicely with a H4 trendline support taken from the high 1.3371.
Now despite this support currently holding ground, our team is not going to be looking to buy from here today unless a decisive close is seen above the 1.32 handle which we do not think will happen. In addition to this, there is a far more attractive H4 buy zone seen below around the 1.31 handle/1.3085 range (green rectangle). Collectively this area comprises of a H4 harmonic Bat completion point, a H4 61.8% Fib support at 1.3085 (taken from the low 1.2865) and also converges beautifully with the top edge of a daily support area coming in at 1.3064-1.3104.
Our suggestions: We would not advise placing a pending buy order around the 1.31 range simply because we have UK labor data scheduled for release at 9.30am GMT today, and also weekly action shows room to continue lower down to support at 1.2942! Waiting for a bullish H4 close to form prior to pulling the trigger would, in our opinion, be the safer route to take in this situation.
Levels to watch/live orders:
- Buys: 1.3085/1.31 region [H4 bullish close required] (Stop loss: below the trigger candle).
- Sells: Flat (Stop loss: n/a).
AUD/USD:
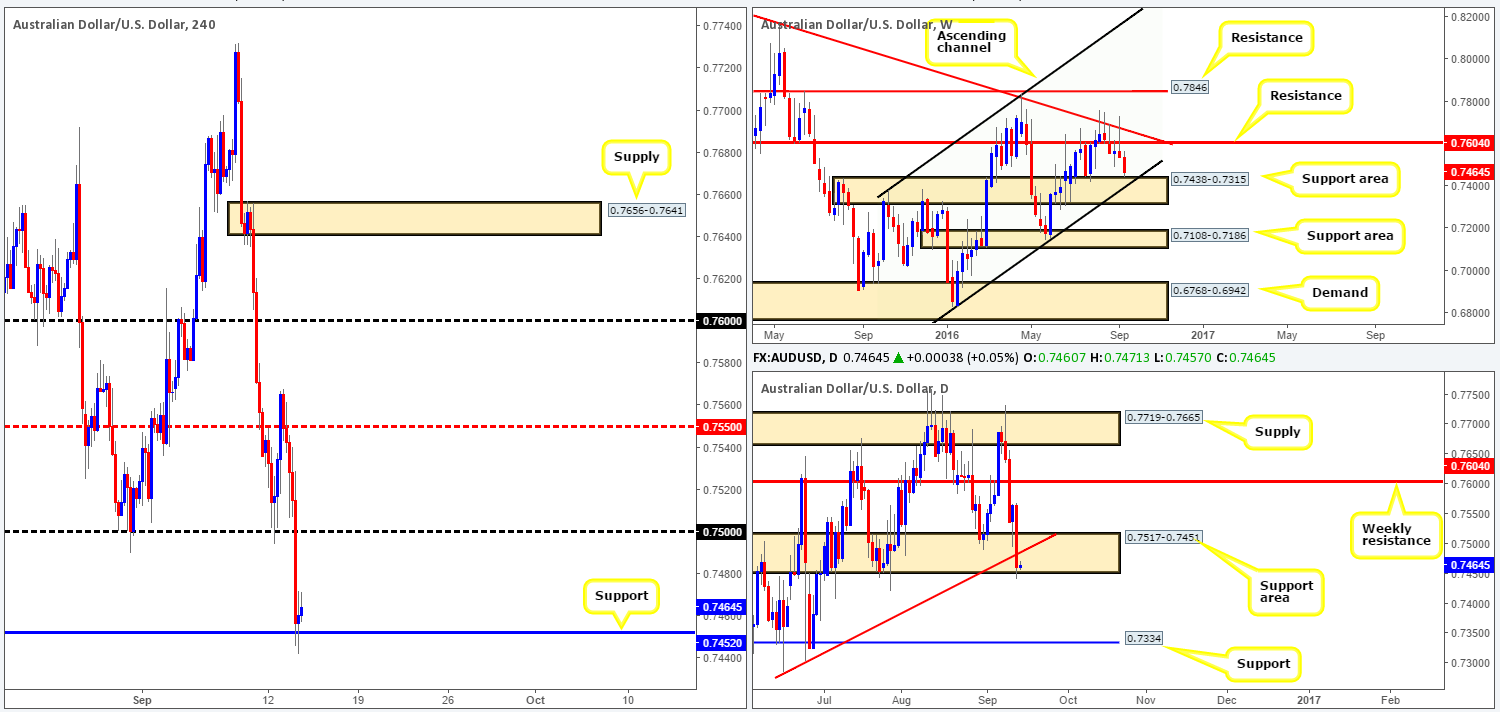
(Trade update: long position taken from 0.7501 – 50% was liquidated at 0.7550, while the other 50% hit our breakeven stop).
In view of weekly price currently seen trading just ahead of a support area at 0.7438-0.7315, which fuses with a channel support extended from the low 0.7046, we could see the commodity currency correct itself sometime soon. Scrolling down to the daily chart, yesterday’s action breached and closed below a trendline support taken from the low 0.7285, but, as you can see, remains within a support area at 0.7517-0.7451 (positioned just above the aforementioned weekly support area).
Jumping across to the H4 chart, the Aussie ended the day settling around a support level drawn from 0.7452, which for now is holding firm. From this angle, there appears to be little standing in the way for the pair to strike the 0.75 band today.
Our suggestions: With weekly action trading so close to a support area at the moment, taking shorts from either the 0.75 band or the underside of the daily trendline resistance is high risk in our book. Personally, we’re going to step aside here since selling into a weekly zone is not really something we’d be comfortable participating in. We would, however, consider becoming buyers in this market following a decisive close above 0.75.
Levels to watch/live orders:
- Buys: Flat (Stop loss: n/a).
- Sells: Flat (Stop loss: n/a).
USD/JPY:
Beginning with a look at the weekly chart this morning, candle action is currently seen trading mid-range between a resistance area at 105.19-107.54 and a support level coming in at 100.61. Down on the daily chart, we’re seeing similar price movement. Price is currently capped between a resistance area drawn from 103.50-103.89 and the aforementioned weekly support band. Moving across to the H4 chart, we can see that yesterday’s action saw price take out both the 102 handle and the H4 mid-way resistance 102.50 on dollar strength, with price now seen trading just ahead of the 103 level.
Our suggestions: While there is a possibility that price could find resistance around the 103 band today, we are more drawn to both the H4 supply zone at 103.86-103.62 and a H4 Quasimodo resistance at 103.99. The reason is that both of these barriers are closely positioned around the above said daily resistance area. However, given that weekly action shows that price could possibly stretch up to the weekly resistance area at 105.19-107.54, we would not feel comfortable placing pending orders at the H4 zones. Waiting for a bearish H4 close is, at least for us, required prior to pulling the trigger.

Levels to watch/live orders:
- Buys: Flat (Stop loss: n/a).
- Sells: 103.99 [H4 bullish close required] (Stop loss: above the trigger candle). 103.86-103.62 [H4 bullish close required] (Stop loss: above the trigger candle).
USD/CAD:
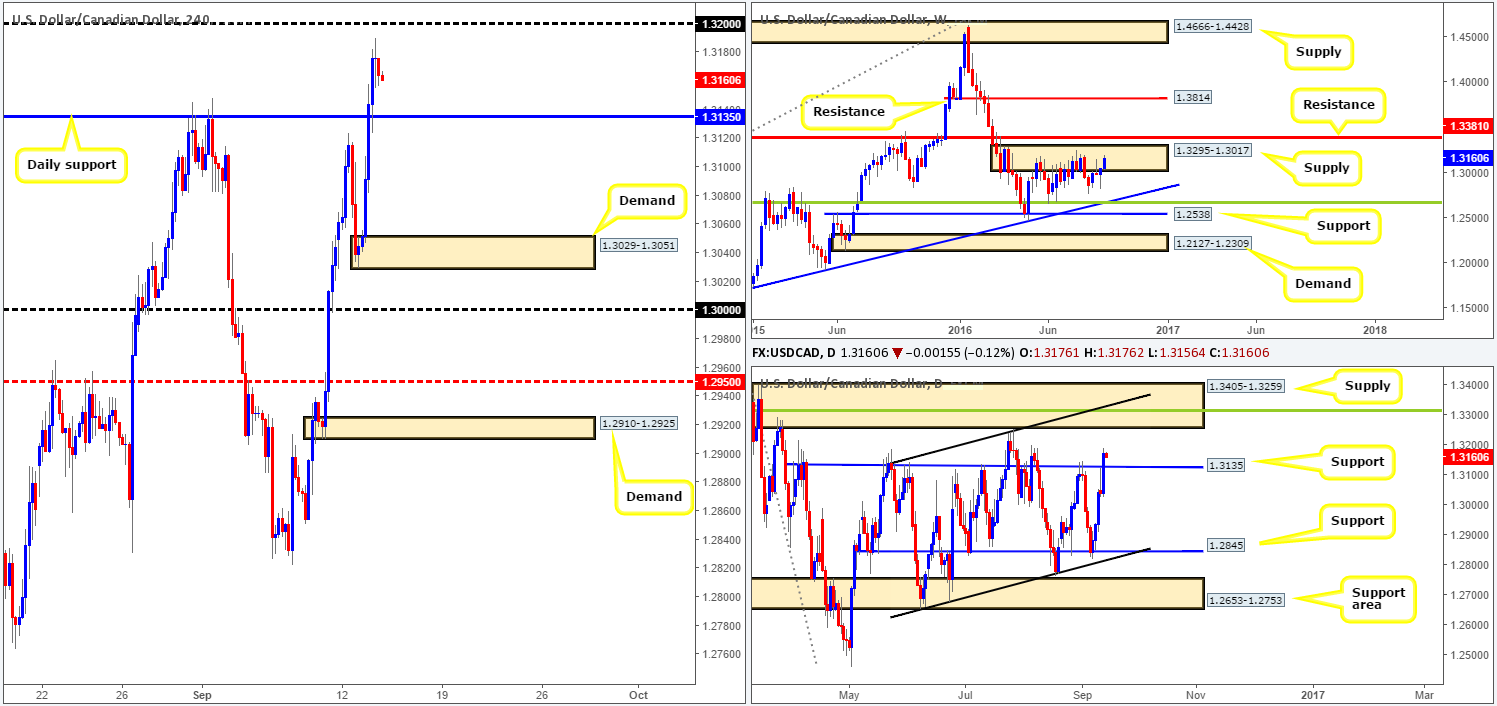
With oil prices softening and the dollar seen strengthening across the board yesterday, the USD/CAD bulls pressed forward and took out a daily resistance level chalked up at 1.3135. Although this break potentially signals higher prices up to at least the 1.32 handle or even the underside of daily supply at 1.3259, we remain wary due to weekly price lurking within a supply zone drawn from 1.3295-1.3017.
At this point in time we seem to be cornered! A long taken above the recently broken daily resistance puts one in direct line of fire with weekly supply. Meanwhile, a short from the weekly supply would be out of the question given the recent break higher and room seen to move north.
Our suggestions: In the absence of clearer price action, we have decided to remain flat going into today’s sessions. The risks are just too great in our opinion.
Levels to watch/live orders
- Buys: Flat (Stop loss: n/a).
- Sells: Flat (Stop loss: n/a).
USD/CHF:
A quick recap of yesterday’s action shows that the US dollar strengthened against the Swiss Franc from the H4 demand base at 0.9710-0.9721. This, as you can see, recently saw the pair close above a H4 resistance level coming in at 0.9762, potentially opening up the doors for price to challenge the 0.98 handle and beyond. A long on the retest of this broken level is certainly something that interests our team this morning, since daily action is seen rebounding from a support area at 0.9648-0.9708, and shows that there is some leeway up to the trendline resistance extended from the high 1.0256.
Our suggestions: Given the points made above, our prime focus today will be on looking for price to retest the H4 support at 0.9762. This – coupled with a relatively strong H4 bullish close would be sufficient enough to condone a long entry from this barrier, targeting the 0.98 handle as one’s immediate take-profit target, followed by the H4 Quasimodo resistance line at 0.9863.
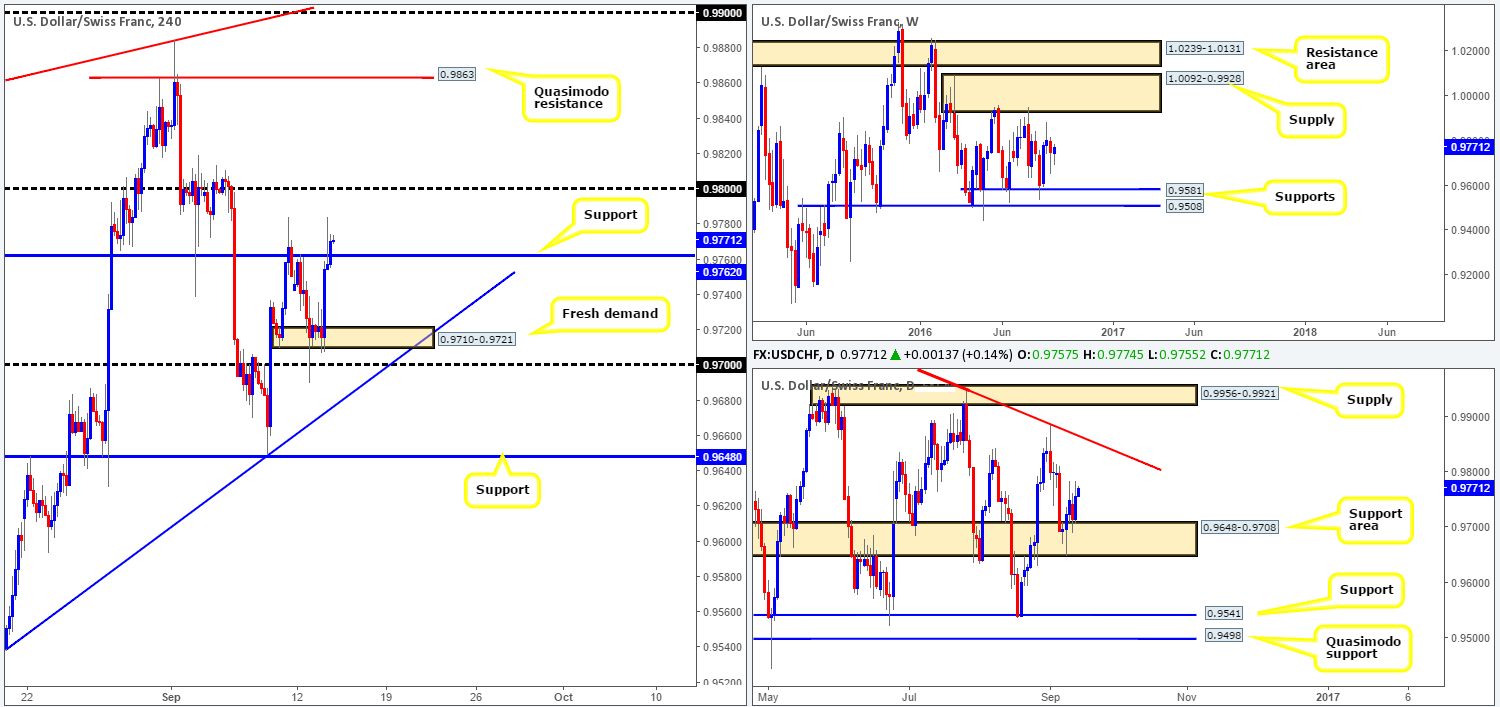
Levels to watch/live orders:
- Buys: 0.9762 [H4 bullish close required] (Stop loss: below the trigger candle).
- Sells: Flat (Stop loss: n/a).
DOW 30:
The weekly resistance area at 18365-18158 is, at the time of writing, doing a fine job in holding this index lower. Assuming that this area continues to hold, further selling from this point could potentially drag the equity market down to a support area carved from 17446-17606. Things on the daily chart, however, are a little more cramped. The DOW is currently sandwiched between a resistance level visible at 18322 and a broken Quasimodo line at 18018, which happens to fuse with a trendline support extended from the low 15501. A decisive close below here would, at least in our opinion, seal the deal for lower prices down to the weekly support area coming in at 17446-17606: the next downside target on that timeframe.
Stepping over to the H4 chart, US stocks continued to extend lower yesterday following the rebound off of a H4 resistance area at 18321-18349. At this point we do not see much being offered at the moment. We would, nevertheless, advise traders to keep an eyeball on the above said H4 resistance area today since it converges with the above said daily resistance line and is housed within the aforementioned weekly resistance area.
Our suggestions: A H4 bearish close from the H4 resistance area at 18321-18349 would, given its higher –timeframe confluence, be enough to condone a short trade. Taking a long from the current H4 demand base, however, is a little more challenging. Although it is bolstered by a daily trendline support, let’s not forget that it is against the current weekly flow. Therefore, caution is advised here guys!
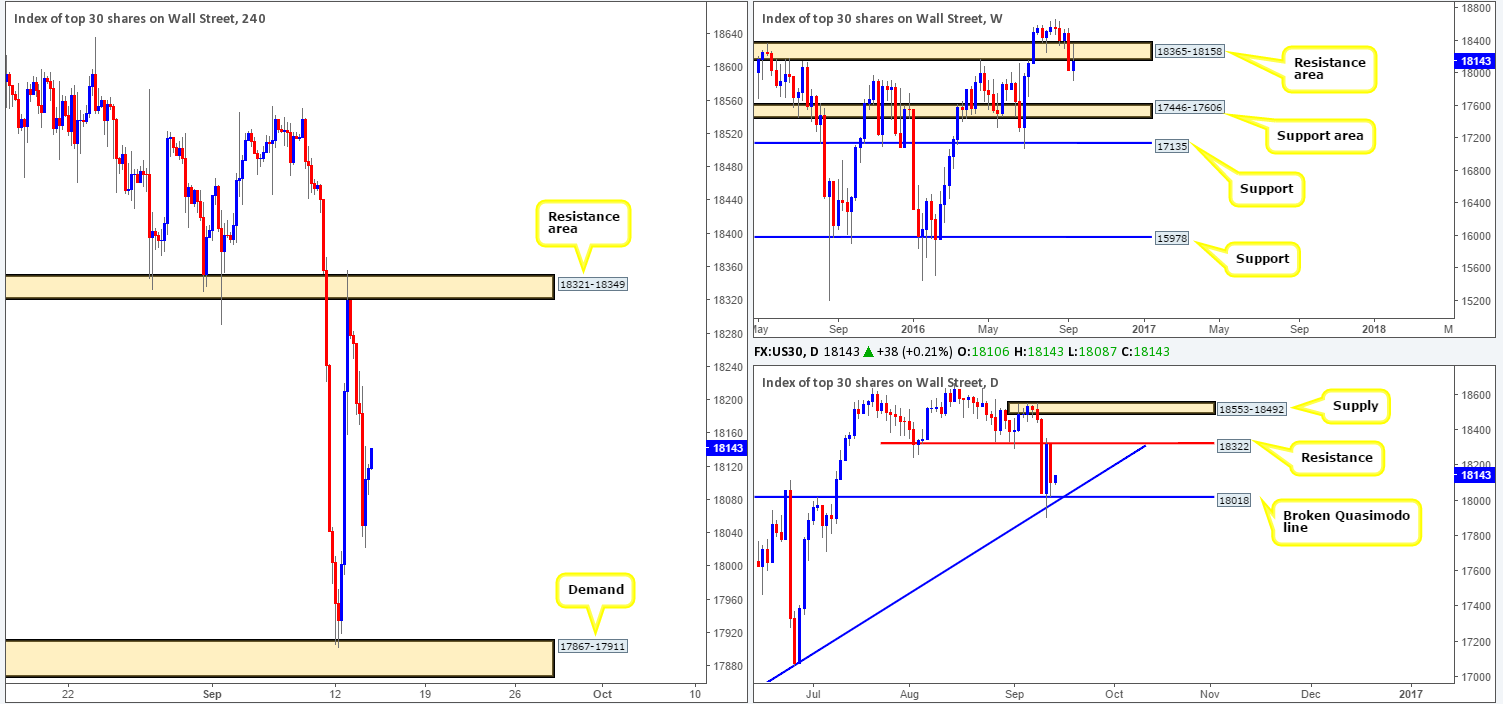
Levels to watch/live orders:
- Buys: Flat (Stop loss: n/a).
- Sells: 18321-18349 [H4 bullish close required] (Stop loss: above the trigger candle).
GOLD:
On account of the dollar strength that swept across the markets yesterday, it was not really a surprise to see that the precious metal fell lower. Gold continued to decline in value until finding a reasonably well-bid H4 support area seen at 1312.0-1316.0. Not only does this zone merge with a H4 trendline support taken from the high 1355.9, it also ties in nicely with a H4 78.6% Fib support at 1313.1 and is positioned within a daily demand area at 1305.3-1322.8. The only grumble we have in regard to buying from this area is that weekly flow shows room to press lower down to the top edge of a support area seen at 1307.4-1280.0.
Our suggestions: Despite the weekly chart showing room to move lower, we feel that this market is likely to bounce from the current H4 support area given its confluence and the fact that the US dollar index is presently trading around a H4 resistance line at 95.62. As such, our team has entered long at 1318.2 with our stop placed below the H4 support zone at 1311.2. Our first take-profit area is the H4 supply seen at 1331.8-1329.6.
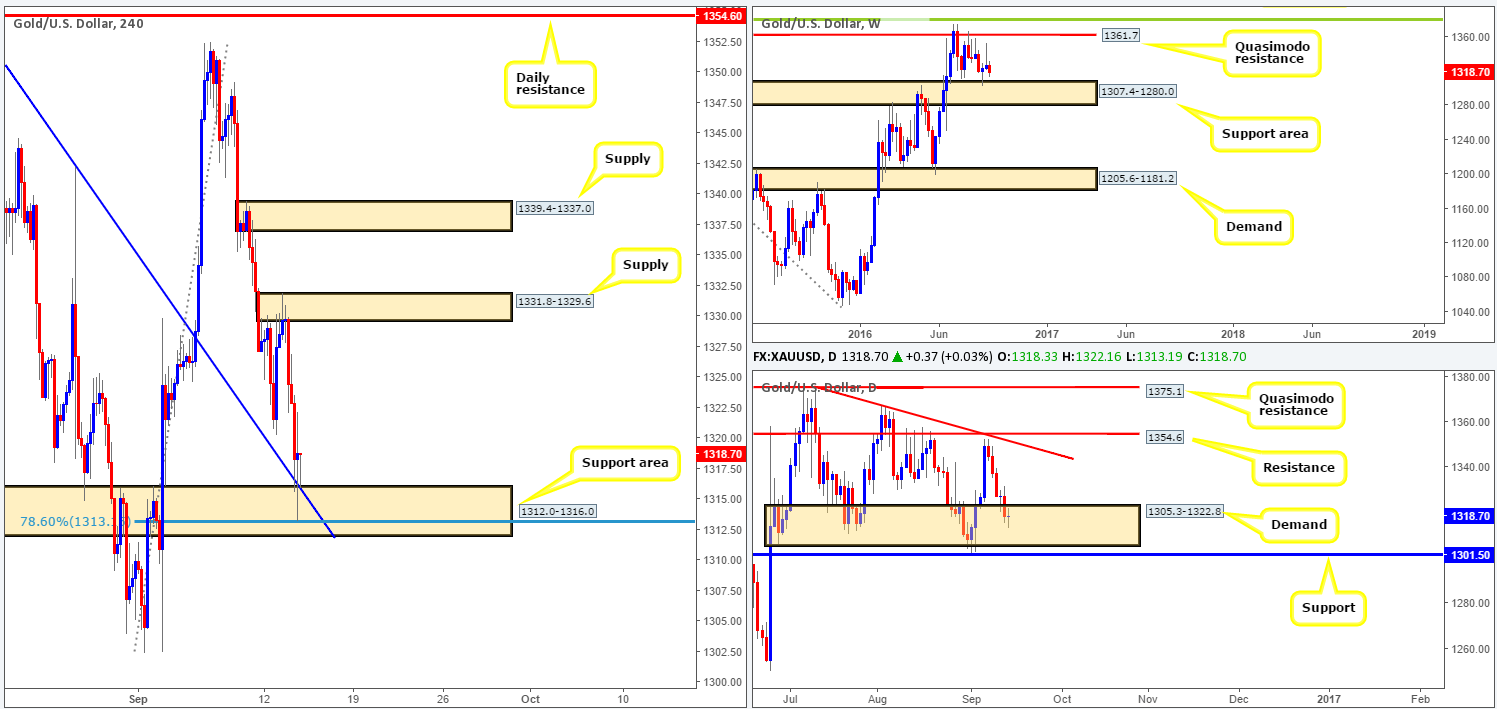
Levels to watch/live orders:
- Buys: 1318.2 [live] (Stop loss: 1311.2).
- Sells: Flat (Stop loss: n/a).


