
DXY:
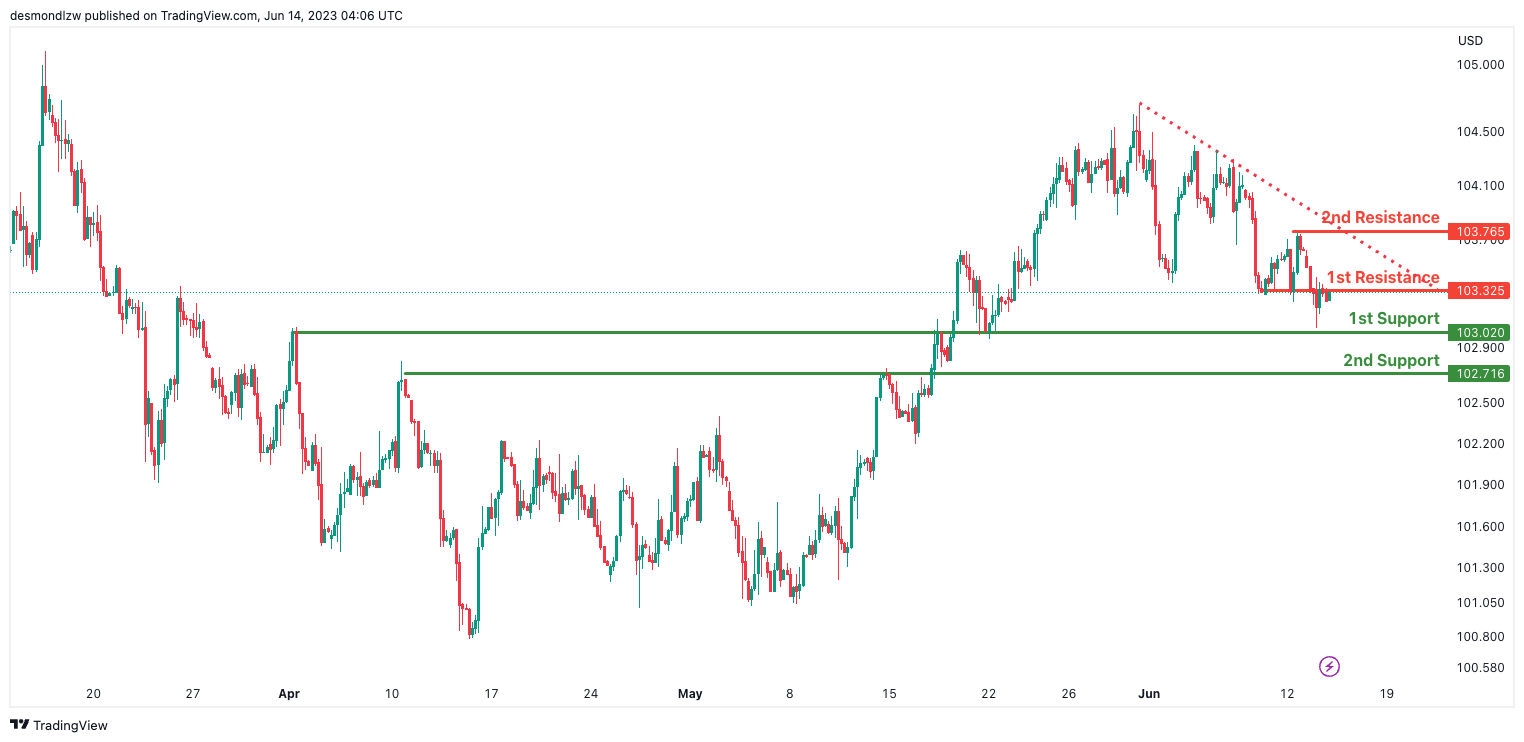
The DXY (US Dollar Index) chart currently shows a bearish momentum, indicating a downward trend in the market.
Factors contributing to this momentum include the price being below a major descending trend line, suggesting the presence of bearish pressure.
There is a potential for a bearish reaction off the first resistance level at 103.32, with a possible drop towards the first support level at 103.02.
The first and second support levels at 103.02 and 102.71, respectively, are identified as overlap supports, indicating their significance as potential areas of buying interest.
On the upside, the first and second resistance levels at 103.32 and 103.76, respectively, act as overlap resistances, potentially limiting upward price movements.
Overall, the chart’s momentum suggests a bearish bias, with potential support and resistance levels to monitor for future price action.
EUR/USD:
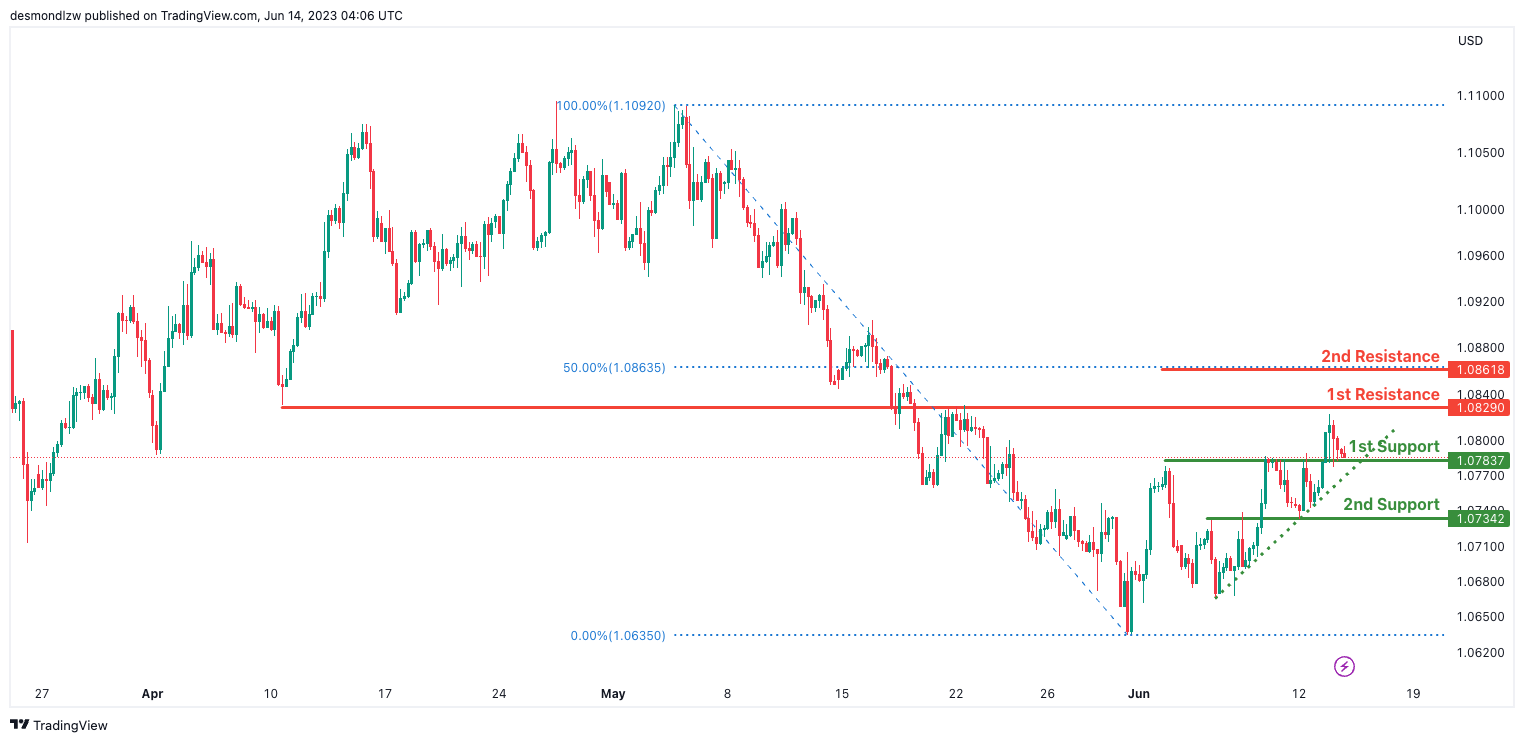
The EUR/USD chart currently demonstrates a bullish momentum, indicating an upward trend in the market.
The momentum is supported by the price being above a major ascending trend line, suggesting the potential for further bullish movement.
There is a possibility of a bullish bounce off the first support level at 1.0783, with potential upward movement towards the first resistance level at 1.0829.
The first and second support levels at 1.0783 and 1.0734, respectively, are identified as overlap supports, indicating their significance as potential levels where buyers may step in.
On the upside, the first resistance level at 1.0829 is an overlap resistance, suggesting a potential barrier to upward price movements.
Additionally, the second resistance level at 1.0861 aligns with the 50% Fibonacci retracement, further reinforcing its importance as a potential resistance level.
GBP/USD:
The GBP/USD chart currently exhibits a bullish momentum, indicating an upward trend in the market.
There is a potential for a bullish bounce off the first support level at 1.2588, with the price potentially heading towards the first resistance level at 1.2676.
The first and second support levels at 1.2588 and 1.2543, respectively, are identified as overlap supports, indicating their significance in providing potential buying interest.
On the upside, the first resistance level at 1.2676 is an overlap resistance, potentially acting as a barrier to upward price movements.
Additionally, an intermediate resistance level at 1.2651 shows Fibonacci confluence with a -27% Fibonacci Expansion and the 78.60% Fibonacci Projection, further reinforcing its importance as a potential area of resistance..

USD/CHF:
The USD/CHF chart currently demonstrates a bearish momentum, indicating a downward trend in the market.
The price has broken below an ascending support line, triggering a potential bearish move.
There is a possibility of a bearish break off the first support level at 0.9028, with the price potentially dropping towards the second support level at 0.8990.
The first support level at 0.9028 is identified as an overlap support and aligns with the 61.80% Fibonacci retracement, making it a significant level to watch.
On the upside, the first resistance level at 0.9117 serves as an overlap resistance.
Furthermore, an intermediate resistance level at 0.9150 is recognized as a swing high resistance and shows Fibonacci confluence with a -27% Fibonacci Expansion, further reinforcing its significance as a potential area of resistance.
Overall, the chart’s bearish momentum suggests a downward bias, with key support and resistance levels providing potential areas for price movement.

USD/JPY:
The USD/JPY chart currently demonstrates a bearish momentum, indicating a downward trend in the market.
There is a potential for a bearish reaction off the first resistance level at 140.23, with the price potentially dropping towards the first support level at 138.79.
The first support level at 138.79 is identified as an overlap support, while the second support level at 137.71 serves as another overlap support and aligns with the 50% Fibonacci retracement level.
On the upside, the first resistance level at 140.23 represents a multi-swing high resistance.
Additionally, an intermediate resistance level at 140.91 is recognized as a swing high resistance, further contributing to its significance.
Overall, the bearish momentum of the chart suggests a downward bias, with key support and resistance levels providing potential areas for price movement.

USD/CAD:
The USD/CAD chart currently shows a neutral momentum, indicating a lack of clear direction in the market.
There is a possibility for price to fluctuate between the first resistance level at 1.3323 and the first support level at 1.3275.
The first support level at 1.3275 is identified as an overlap support, while the second support level at 1.3238 serves as another area of overlap support.
On the upside, the first resistance level at 1.3323 represents an overlap resistance, and it is further supported by the 61.80% Fibonacci projection.
Additionally, an intermediate resistance level at 1.3411 is recognized as an overlap resistance, and it coincides with the 38.20% Fibonacci retracement.

AUD/USD:
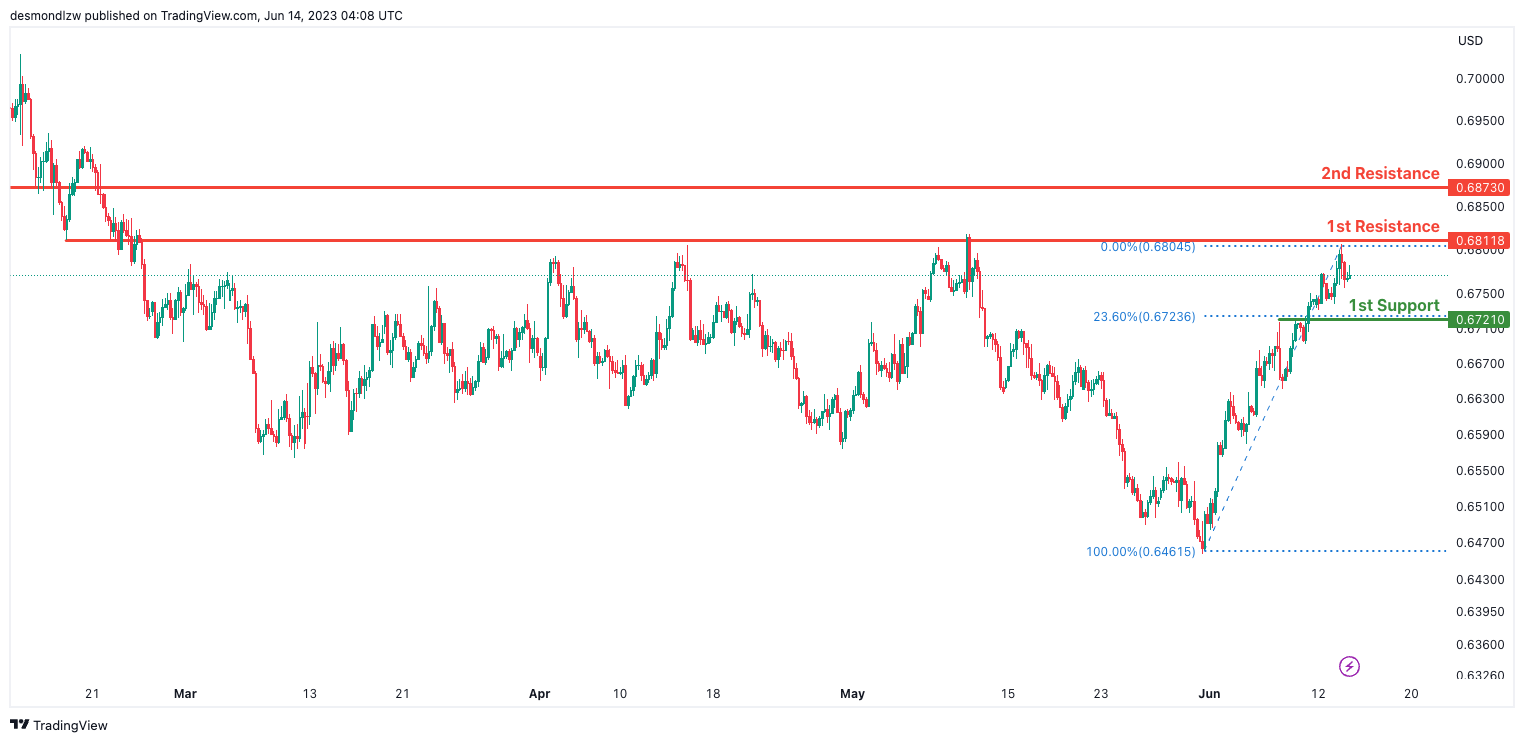
The AUD/USD chart currently shows a bearish momentum, indicating a downward trend in the market.
There is a potential for a bearish continuation towards the first support level at 0.6721. This level is identified as an overlap support and is further supported by the 23.60% Fibonacci retracement.
On the upside, the first resistance level at 0.6811 represents an area of overlap resistance.
Additionally, the second resistance level at 0.6870 serves as a pullback resistance.
With the overall bearish momentum, the price is expected to potentially continue its downward movement towards the first support level.
NZD/USD
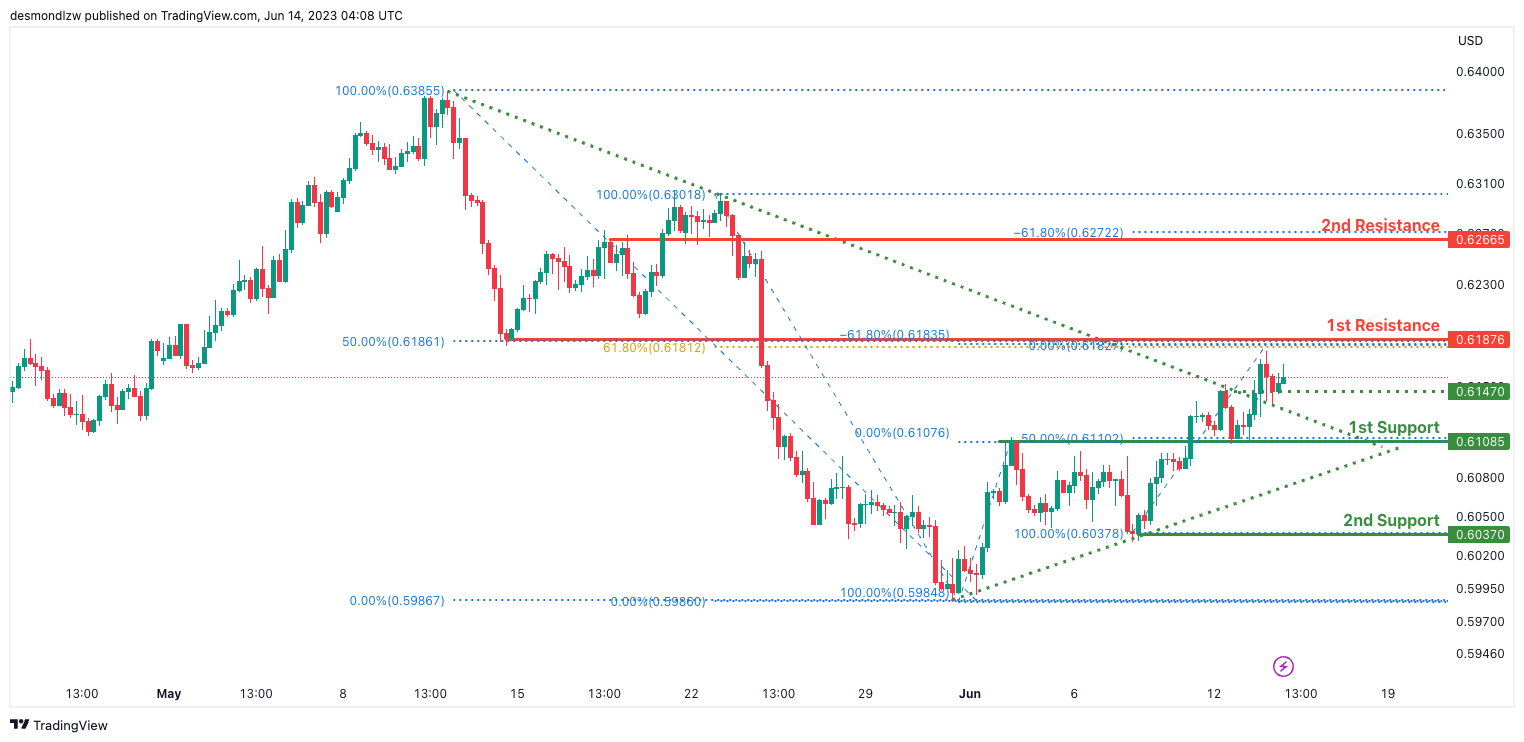
The NZD/USD chart currently exhibits a bearish momentum, indicating a downward trend in the market.
There is a potential for a bearish reaction off the first resistance level at 0.6187, followed by a drop towards the first support level at 0.6108. The first support level is an area of overlap support, further reinforced by the presence of a 50% Fibonacci retracement.
Additionally, the second support level at 0.6037 is identified as a swing low support.
On the upside, the first resistance level at 0.6187 acts as an area of overlap resistance. It also coincides with a 50% Fibonacci retracement and a 61.80% Fibonacci retracement, representing a Fibonacci confluence.
Furthermore, the second resistance level at 0.6266 serves as a pullback resistance, coupled with a -61.8% Fibonacci expansion.
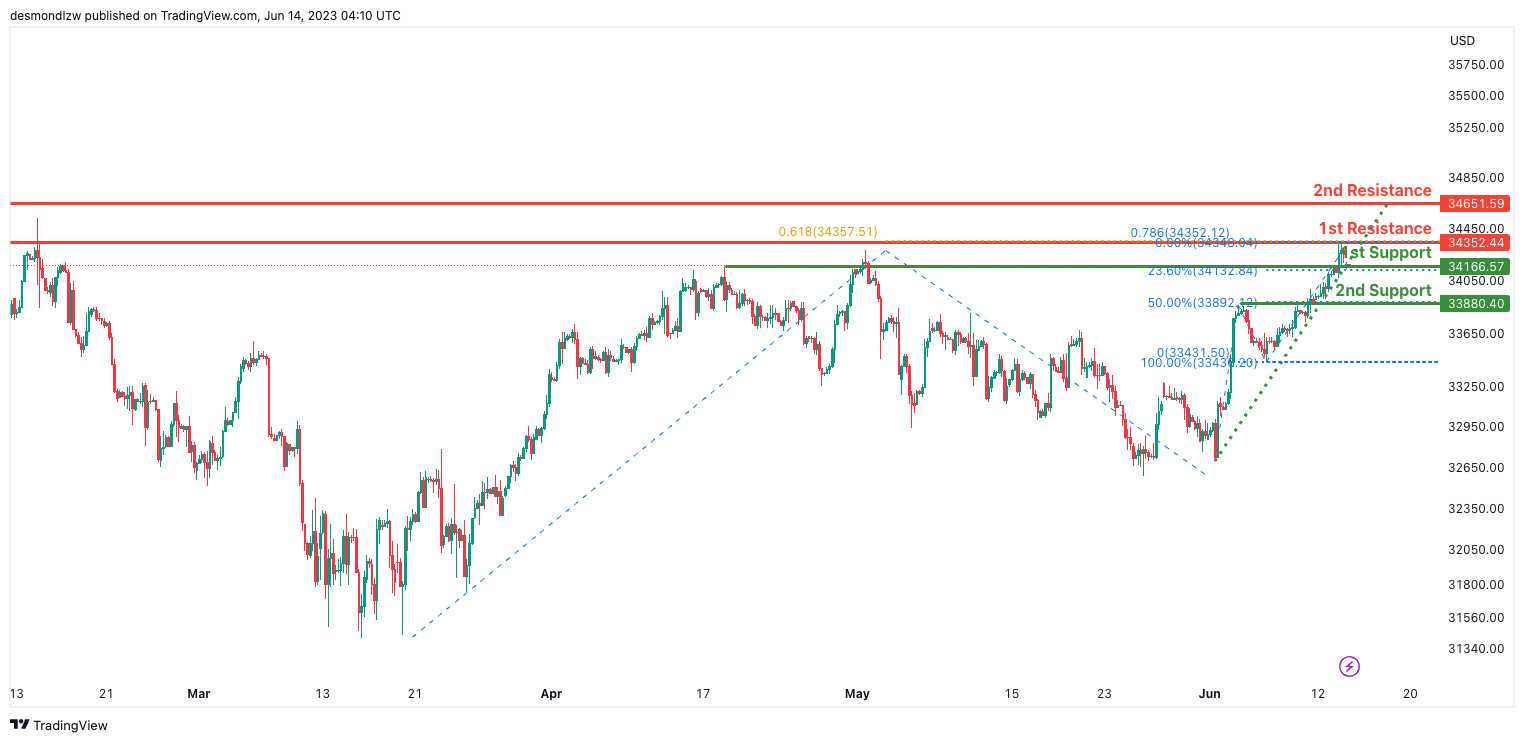
DJ30:
The DJ30 chart currently shows a bullish momentum, indicating an upward trend in the market.
There is a possibility of a short-term drop towards the first support level at 34166.57, which is an area of overlap support and aligns with a 23.60% Fibonacci retracement. From there, the price could bounce and rise towards the first resistance level at 34352.44.
Additionally, the second support level at 33880.40 serves as another area of overlap support, coinciding with a 50% Fibonacci retracement.
On the upside, the first resistance level at 34352.44 is significant as it represents an area of overlap resistance and coincides with a Fibonacci confluence of the 61.80% Fibonacci projection and the 78.60% Fibonacci projection.
Furthermore, the second resistance level at 34651.59 is identified as a swing high resistance.
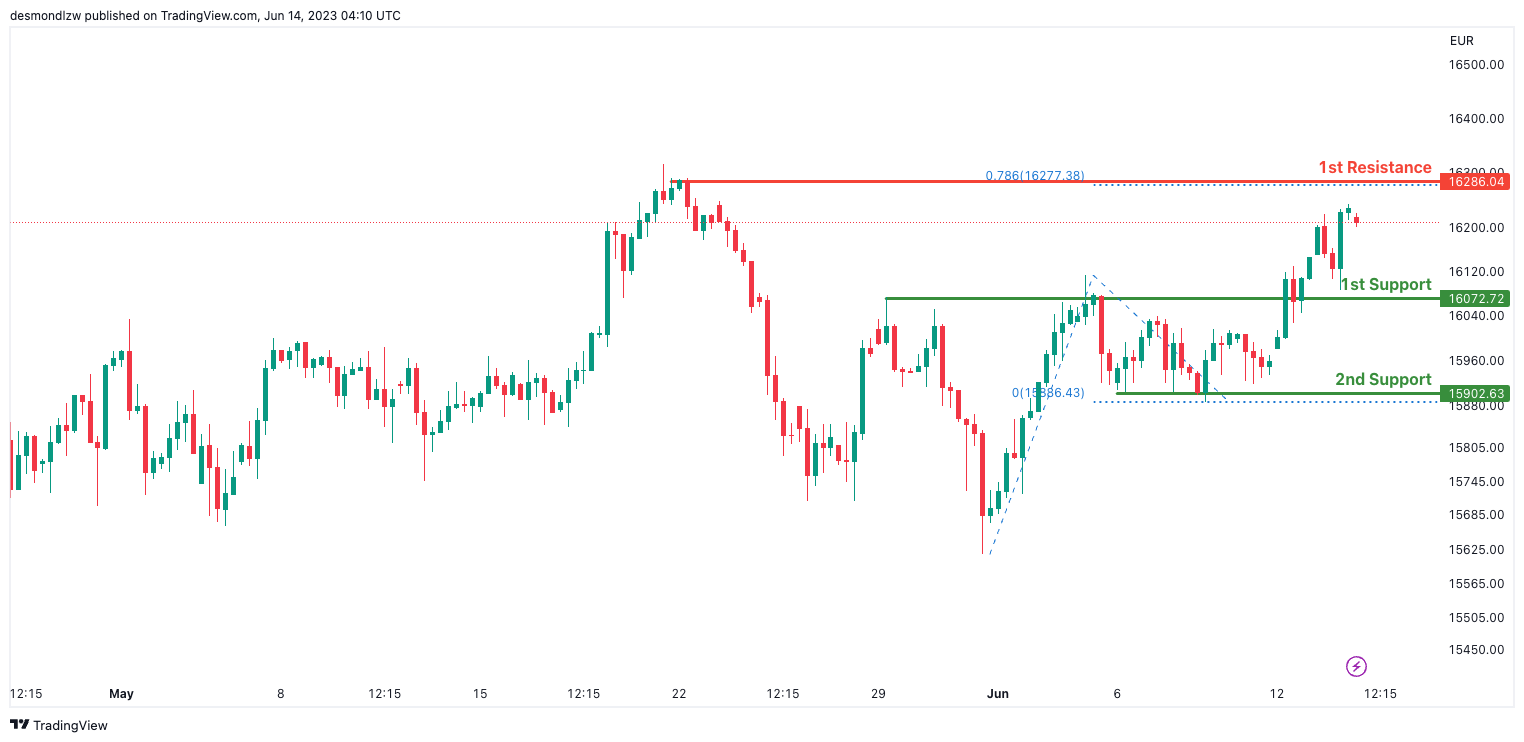
GER30:
The GER30 chart currently exhibits a bearish momentum, suggesting a downward trend in the market.
There is a potential for a bearish reaction off the first resistance level at 16286.04, which is identified as an area of overlap resistance. In the event of a bearish reaction, the price could drop towards the first support level at 16072.72.
Support levels include the first support at 16072.72, recognized as an overlap support, and the second support at 15902.63, which represents a multi-swing low support.
Furthermore, the first resistance level at 16286.04 is significant as it aligns with a 78.60% Fibonacci retracement level, adding to its importance as a potential area of resistance.
US500
The US500 chart currently shows a bullish momentum, indicating an upward trend in the market.
There is a possibility for a short-term drop towards the first support level at 4326.90, which is identified as an area of overlap support. Following this drop, the price could bounce from the support level and rise towards the first resistance at 4386.60.
Support levels include the first support at 4326.90 and the second support at 4298.60, both serving as areas of overlap support.
Furthermore, the first resistance level at 4386.60 acts as a pullback resistance, potentially impeding further upward movement.
Similarly, the second resistance level at 4522.30 is another area of pullback resistance, adding to its significance.

BTC/USD:
The BTC/USD chart currently exhibits a bearish momentum, indicating a downward trend in the market.
There is a possibility for the price to fluctuate between the first resistance level at 26105 and the first support level at 25607.
Support levels include the first support at 25607, identified as a multi-swing low support, and the second support at 25252, characterized as a swing low support and coinciding with a 61.80% Fibonacci projection.
Furthermore, the first resistance level at 26105 is an area of overlap resistance.
Similarly, the second resistance level at 26778 also represents an area of overlap resistance.

ETH/USD:
The ETH/USD chart currently demonstrates a neutral momentum, indicating a lack of clear direction in the market.
There is a possibility for the price to fluctuate between the first resistance level at 1760.95 and the first support level at 1722.00.
Support levels include the first support at 1722.00, recognized as an overlap support, and the second support at 1663.88, identified as a swing low support.
On the upside, the first resistance level at 1760.95 acts as an area of overlap resistance.
Similarly, the second resistance level at 1804.84 serves as a pullback resistance and coincides with the 50% Fibonacci retracement level.

WTI/USD:
The WTI chart currently shows a bearish momentum, indicating a downward trend in the market.
There is a possibility for the price to react bearishly at the first resistance level at 70.66 and drop towards the first support level at 67.51.
Support levels include the first support at 67.51, recognized as a multi-swing low support, and the second support at 64.78, which is also a multi-swing low support and aligns with the 127.20% Fibonacci Extension level.
On the upside, the first resistance level at 70.66 acts as a pullback resistance and coincides with the 50% Fibonacci Retracement level.
Additionally, the second resistance level at 74.23 is an area of overlap resistance to watch.
XAU/USD (GOLD):
The XAU/USD chart currently exhibits a bearish momentum, indicating a downward trend in the market.
There is a potential for a bearish reaction at the first resistance level of 1966.26, followed by a drop towards the first support level at 1937.38.
Support levels include the first support at 1937.38 and the second support at 1914.16, both identified as areas of overlap support.
On the upside, the first resistance level at 1966.26 is a multi-swing high resistance, while the second resistance level at 1980.08 is an area of overlap resistance.

The accuracy, completeness and timeliness of the information contained on this site cannot be guaranteed. IC Markets does not warranty, guarantee or make any representations, or assume any liability regarding financial results based on the use of the information in the site.
News, views, opinions, recommendations and other information obtained from sources outside of www.icmarkets.com, used in this site are believed to be reliable, but we cannot guarantee their accuracy or completeness. All such information is subject to change at any time without notice. IC Markets assumes no responsibility for the content of any linked site.
The fact that such links may exist does not indicate approval or endorsement of any material contained on any linked site. IC Markets is not liable for any harm caused by the transmission, through accessing the services or information on this site, of a computer virus, or other computer code or programming device that might be used to access, delete, damage, disable, disrupt or otherwise impede in any manner, the operation of the site or of any user’s software, hardware, data or property.


