
Key risk events today:
Australia Wage Price Index q/q; RBNZ Official Cash Rate, Monetary Policy Statement, Rate Statement and Press Conference; UK Prelim GDP q/q; UK GDP m/m; UK Manufacturing Production m/m; US Core PPI m/m and PPI m/m; Fed Chair Powell Speaks.
(Previous analysis as well as outside sources – italics).
EUR/USD:
Organised in the form of a daily bullish outside day candlestick pattern, the single currency gathered traction against the greenback Tuesday, erasing Monday’s losses and adding 0.4%. On the data front, disappointing US inflation had little effect on the dollar, which eventually pushed through 100.00 to 99.66.
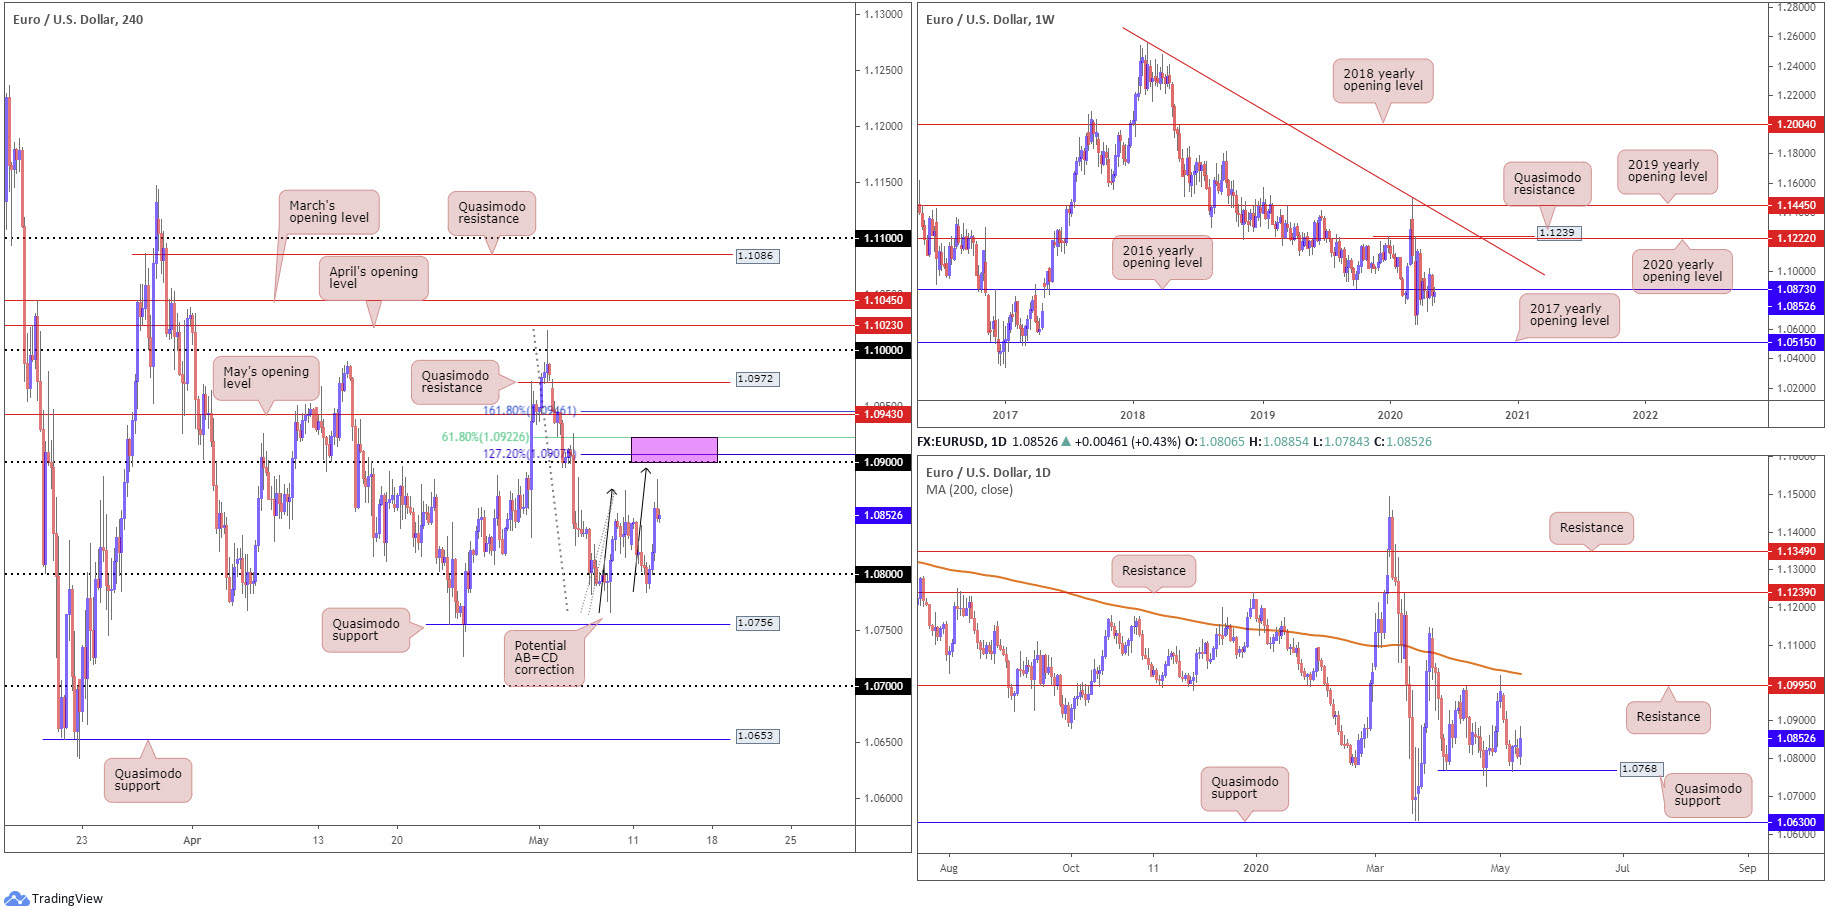
Despite a nudge through orders at 1.08 in the early hours Tuesday, the baton was passed to buyers heading into London, eventually running to a high of 1.0885, formed by means of a shooting star candlestick pattern. Despite this pattern suggesting sellers may have the upper hand, technical focus has shifted to 1.09. The round number joins closely with a potential AB=CD correction (black arrows) at 1.0895, a 127.2% Fibonacci extension point coming in from 1.0907 and a 61.8% Fibonacci retracement ratio at 1.0922 (pink). Above here, analysts may also show interest in May’s opening level at 1.0943 and a 161.8% Fibonacci extension point at 1.0946.
Farther out, weekly price, as highlighted in Monday’s technical briefing, has traded around its 2016 yearly opening level at 1.0873 since April, offering a somewhat directionless tone at present. Overall, though, EUR/USD has been involved in a long-term downtrend since topping in early 2018. A nudge lower could see multi-year lows enter sight at 1.0635, while firming may eventually witness the 2020 yearly opening level at 1.1222 make a play.
Price movement on the daily timeframe finished Tuesday in the form of a bullish outside day candlestick pattern, just north of a Quasimodo support from 1.0768. Resistance at 1.0995 is likely to be the first port of call should we continue to climb, closely tailed by the 200-day SMA (orange – 1.1024).
Areas of consideration:
With weekly price toying with 1.0873, a level that could provide the market with some resistance, traders are likely hoping for a pop to 1.09 before dropping lower. As underscored above, 1.09 comes with appealing bearish confluence between 1.0922/1.09 (pink). Therefore, technicians will be expecting a move out of this zone should we reach this far north today. Conservative traders may opt to position protective stop-loss orders above 1.0946, with take-profit targets set at the 38.2%/61.8% Fibonacci retracement ratios of legs A-D (however, this can only be set once the AB=CD pattern completes).
GBP/USD:
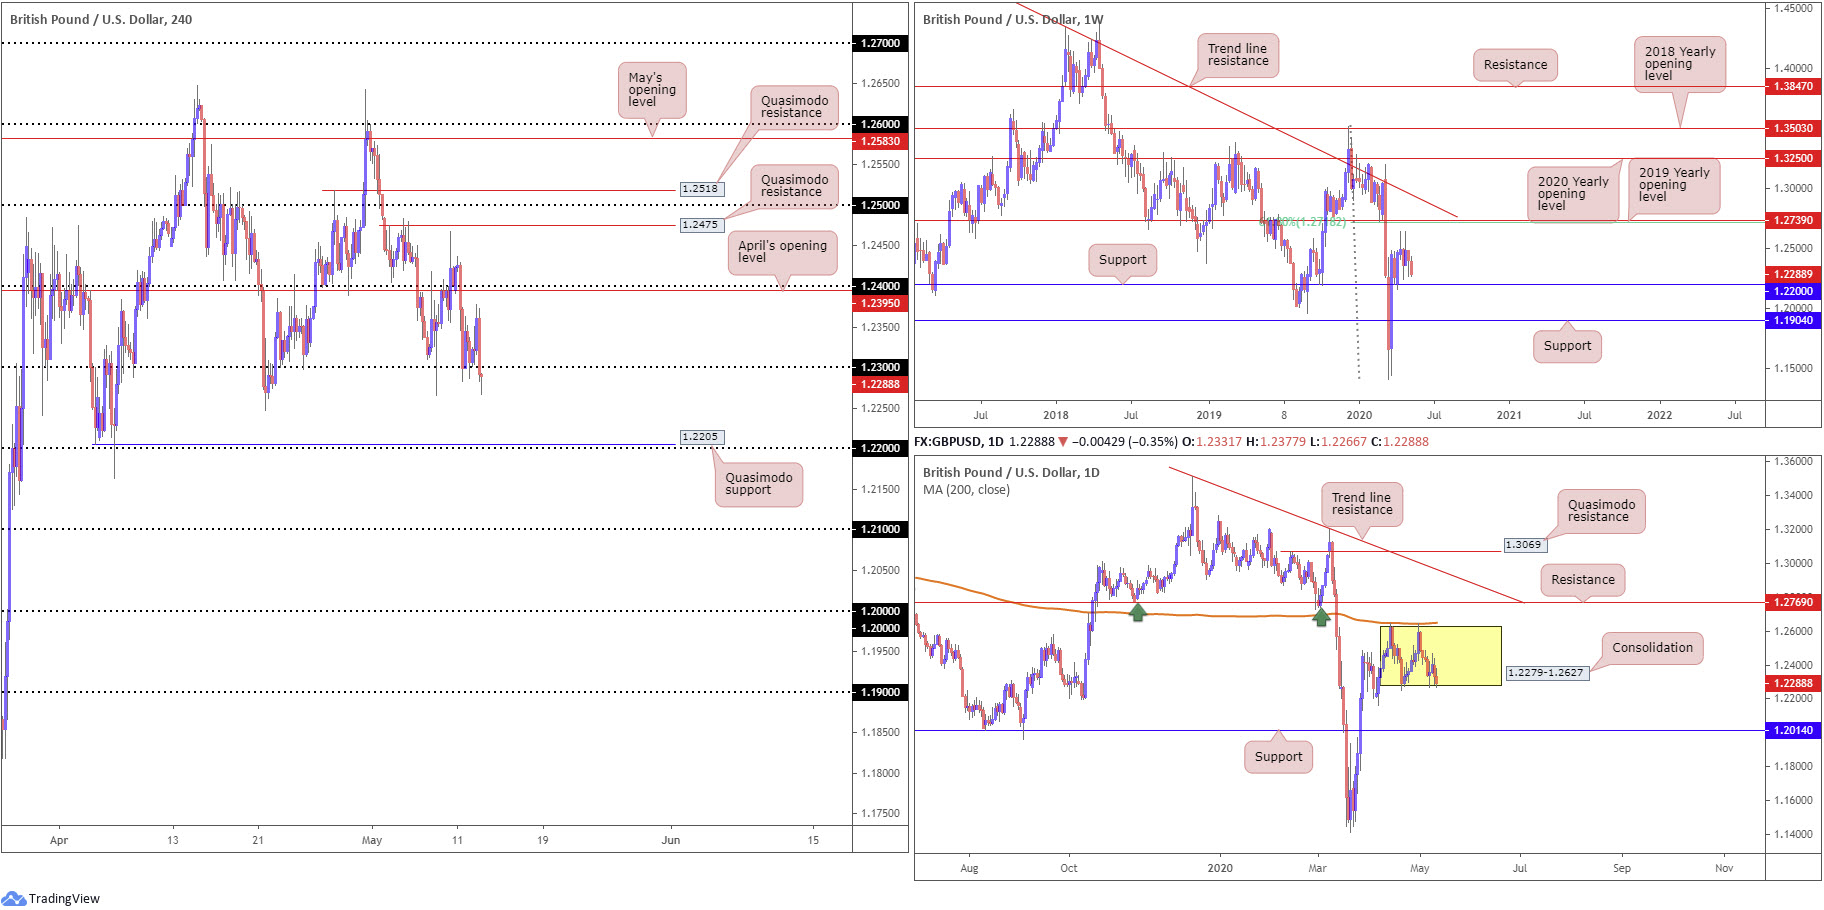
Amid downbeat comments from Bank of England’s (BoE) Ben Broadbent, sterling remained under pressure Tuesday, recently establishing a position sub 1.23. This locates H4 Quasimodo support at 1.2205 on the radar, sited a handful of pips off 1.22. What’s also interesting is sell-stops likely lurking beneath last Thursday’s low at 1.2266 and also under the 1.2247 April 21 low. This, as highlighted in Tuesday’s technical briefing, may provide enough liquidity to rebound price off 1.22ish.
Meanwhile, on the weekly timeframe, support at 1.2200 offers a pivotal base, holding price action higher since the beginning of April. Scope to explore higher ground is visible until reaching the 2019 yearly opening level at 1.2739, which aligns closely with a 61.8% Fibonacci retracement ratio at 1.2718. Breaking the aforementioned levels reveals a long-standing trend line resistance, taken from the high 1.5930. Additionally, we see the pair pulled back from historic lows at 1.1409 in March. Seeing as the pair has been trending south since April 2018, sellers could eventually make a run for fresh lows.
The story on the daily timeframe has price action clinging to the lower boundary of a familiar consolidation zone between 1.2279-1.2627 (yellow). Interestingly, the upper boundary of the aforesaid range is currently reinforced by the 200-day SMA (orange – 1.2649). Traders will also note external resistance sits at 1.2769 and support at 1.2014.
Areas of consideration:
Dethroning 1.23 on the H4 timeframe has placed a question mark on the validity of the daily range support from 1.2279. This may interest breakout sellers south of the said round number today.
Breaching 1.23 has likely jolted buyers and perhaps filled breakout sellers’ orders, targeting 1.22 as the next downside target. Not only is 1.22 a widely watched figure by and of itself, it comes together with H4 Quasimodo support at 1.2205 and weekly support at 1.2200. Therefore, 1.22 serves as a downside target for breakout sellers sub 1.23 and also as a platform for buying opportunities, owing to its confluence.
AUD/USD:
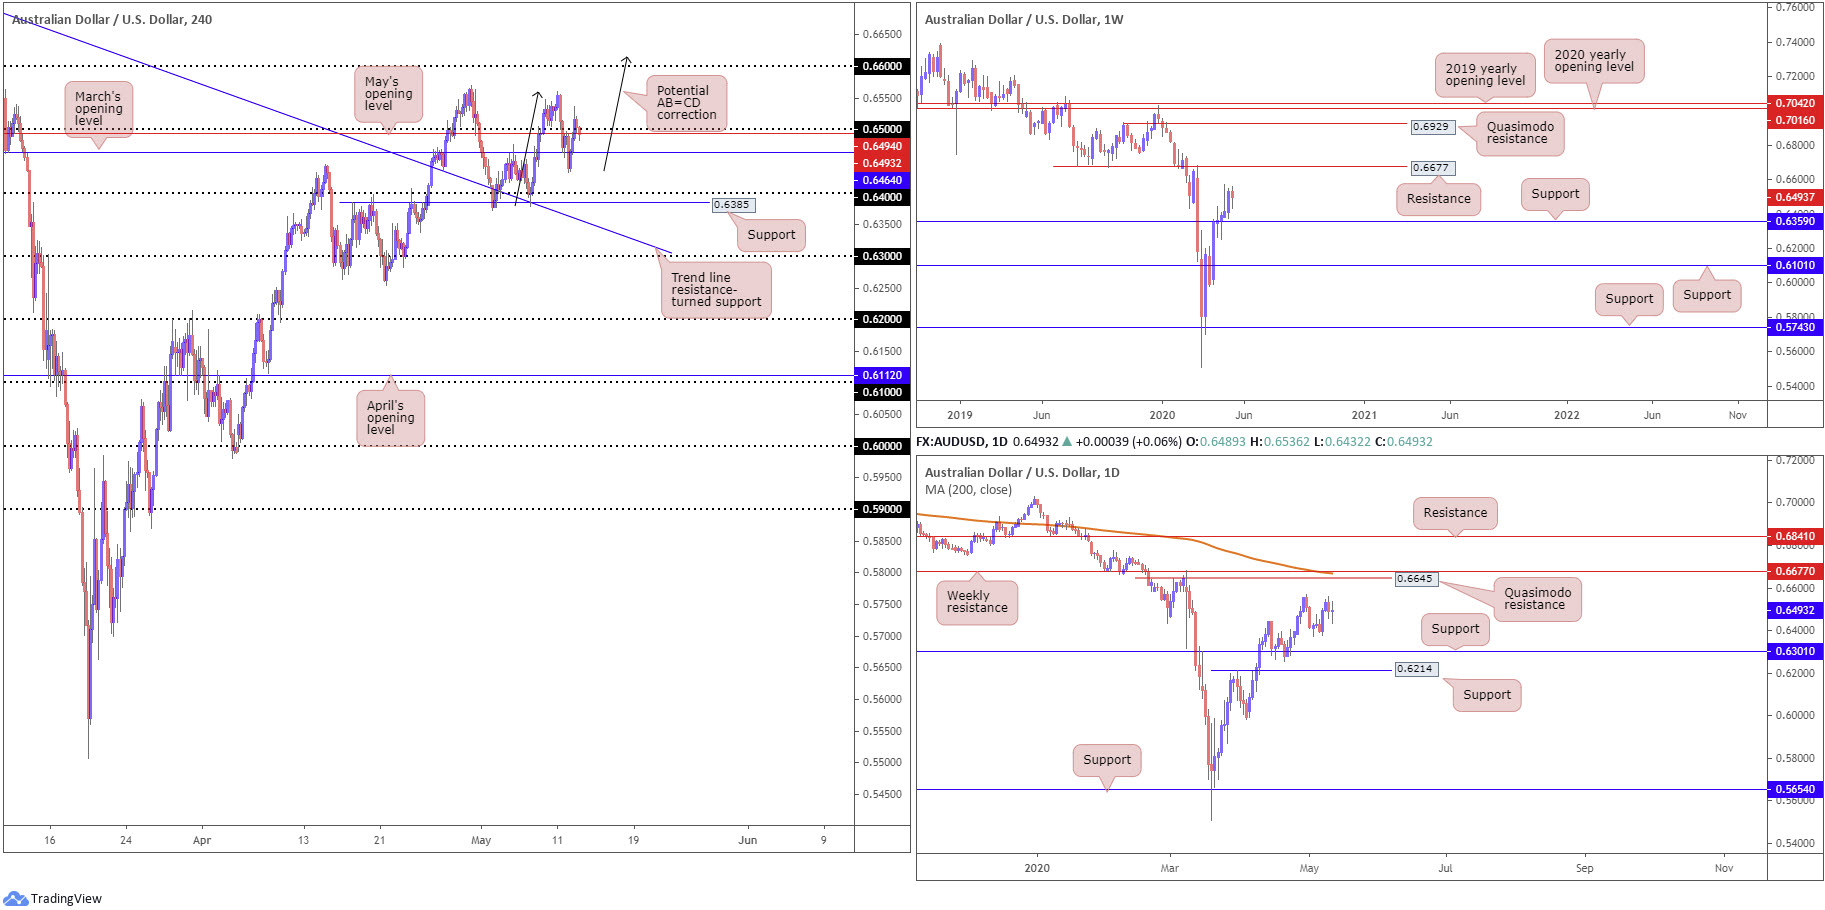
AUD/USD wrapped up Tuesday pretty much directionless, despite ranging between 0.6536/0.6432. Mixed sentiment surrounding COVID-19 along with trade war concerns resurfacing, we can see price action on the H4 timeframe currently nibbles at 0.65 and May’s opening level from 0.6494. To the upside, tops sit around 0.6560ish, with a break throwing 0.66 into view. An approach north of 0.65 also meets the characteristics of an AB=CD correction (black arrows) that terminates above 0.66 at 0.6615.
Across the page on the weekly timeframe, we can see the overall tone remains biased to the upside, recording its fifth consecutive weekly gain last week. Closing the week out shaped by a near-full-bodied bullish candle ahead of support at 0.6359, traders’ crosshairs are likely fixed on resistance at 0.6677. Overall, however, longer-term traders will also note we have been trading lower since the start of 2018, therefore recognising that current upside from multi-year lows at 0.5506 could simply be a bulky pullback before pressing lower. Could 0.6677 be that level to trigger a sell-off?
From the daily timeframe, local support is seen around 0.6370ish, with the possibility of the April 30 high at 0.6569 serving up resistance. Major resistance can be seen at a Quasimodo formation from 0.6645, parked just ahead of the weekly resistance level mentioned above at 0.6677 and a 200-day SMA (orange – 0.6669). Beneath 0.6370, 0.6301 is noted as possible support.
Areas of consideration:
Holding above 0.65 today could spark another wave of buying, targeting 0.6560 and 0.66.
0.66, knowing it aligns with a H4 AB=CD correction at 0.6615, may hold off buyers today and produce a pullback. The problem here, however, is the higher timeframes demonstrate the possibility of a run to at least the daily Quasimodo resistance at 0.6645. Conservative sellers off 0.66, therefore, may consider waiting for candlestick confirmation to form before pulling the trigger.
USD/JPY:
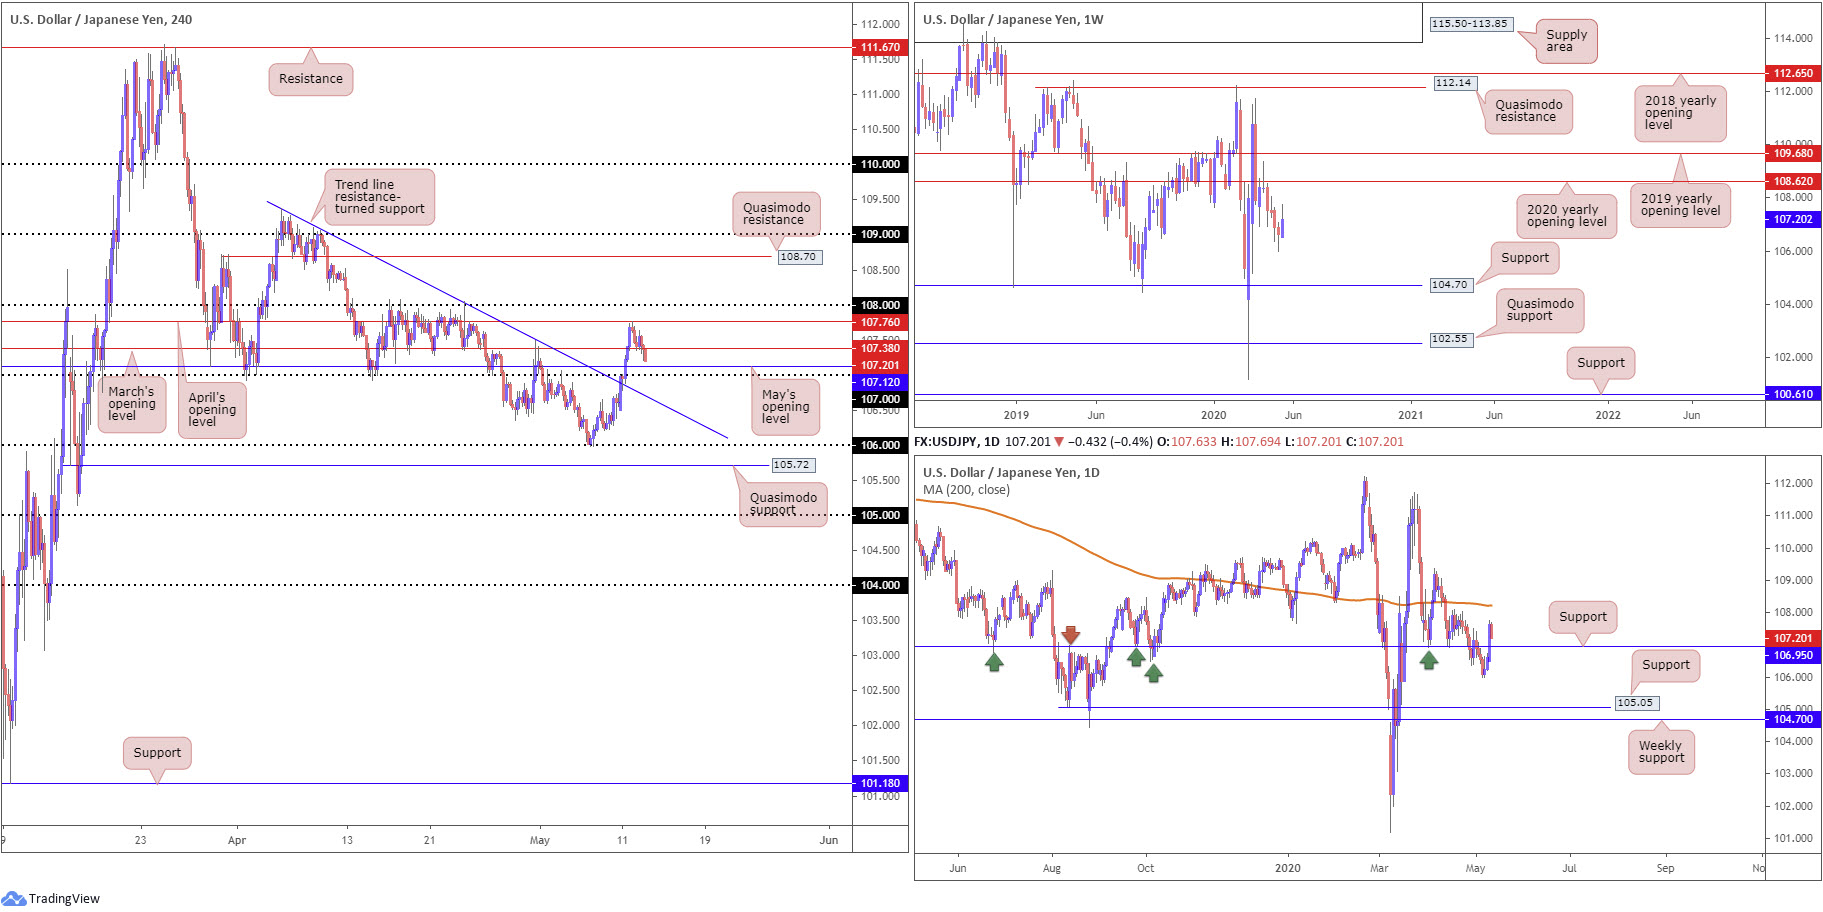
The US dollar failed to build on recent upside against the Japanese yen Tuesday, stalling at April’s opening level drawn from 107.76, a level sited under 108, and mildly pulling back to test territory south of March’s opening level at 107.38. According to the H4 timeframe, May’s opening level rests close by at 107.12, closely shadowed by the 107 psychological band.
The weekly timeframe shows price action continues to reflect a bearish tone beneath the 2020 yearly opening level at 108.62, with 104.70 positioned as the next support target.
Technical action on the daily timeframe saw price take out resistance at 106.95 and rush to highs of 107.76 on Monday, throwing the 200-day SMA (orange – 108.22) into the firing range. As a result of yesterday’s retreat, nevertheless, a retest at 106.95 may enter the mix today.
Areas of consideration:
Daily support at 106.95, coupled with the 107 handle and May’s opening level at 107.12, may tempt dollar bulls to make an appearance from here today. 107.38 offers feasible resistance, therefore traders will want to secure a position allowing for reasonable risk/reward before reaching 107.38.
Alternatively, some may feel a H4 close beneath 107 may warrant breakout selling to trend line resistance-turned support, taken from the high 109.26.
USD/CAD:
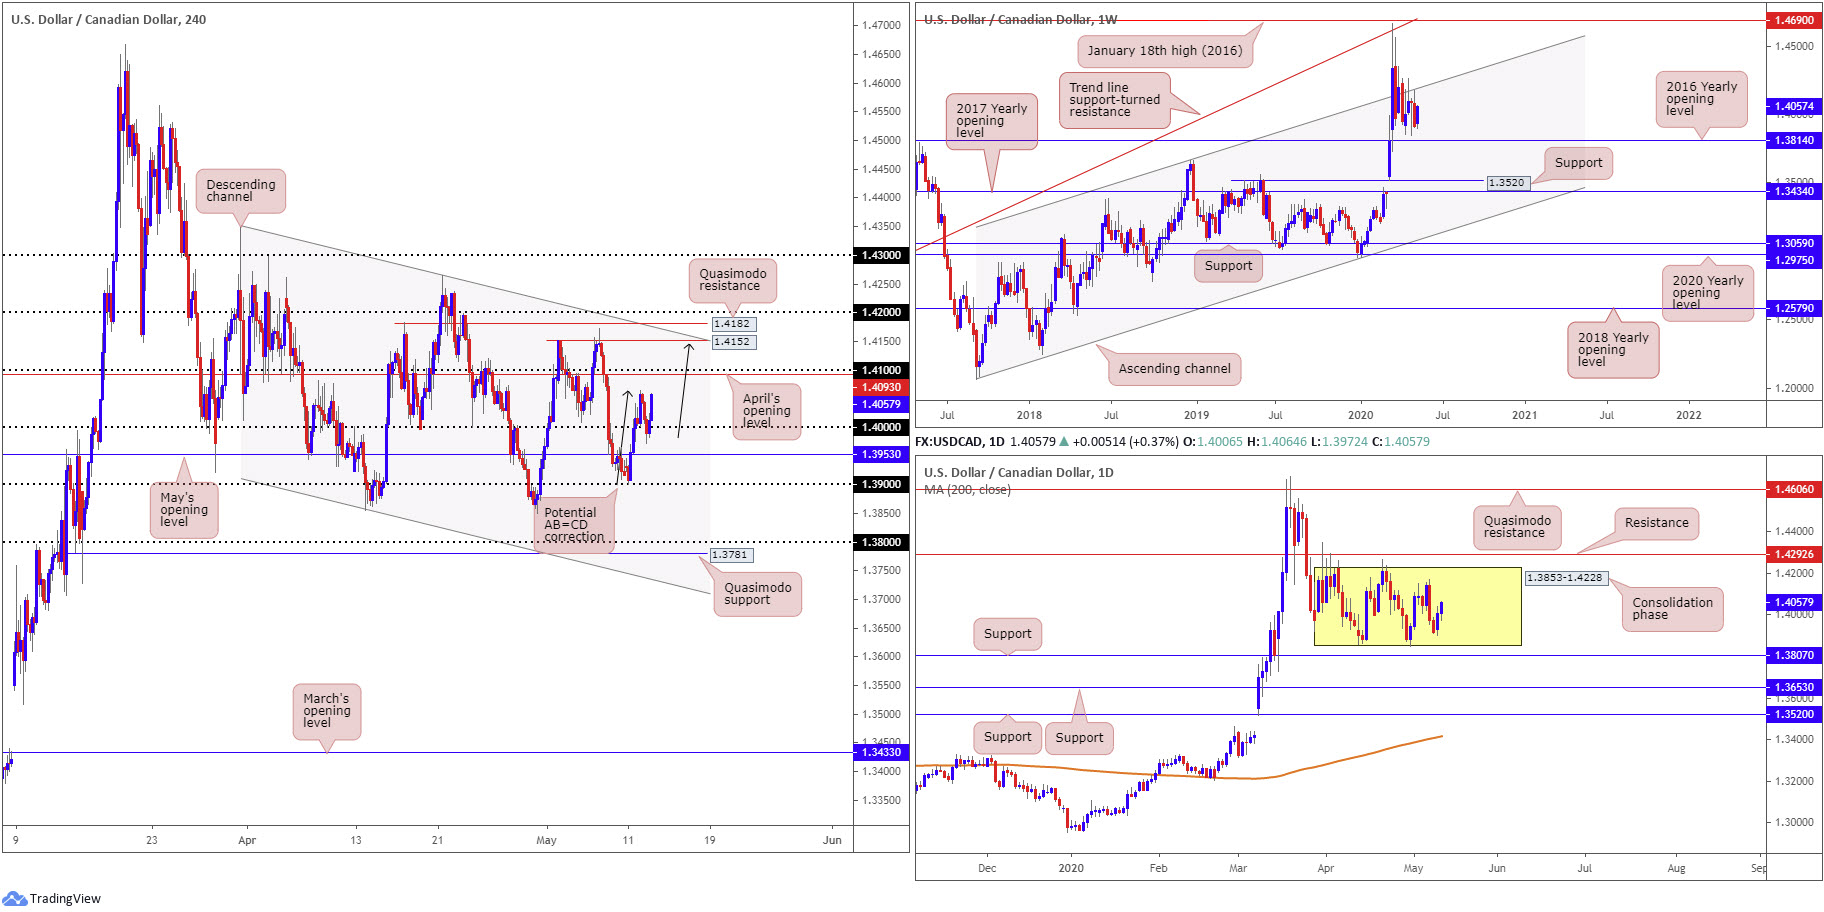
The US dollar concluded higher vs. the Canadian dollar for a second consecutive session Tuesday, adding 40 pips, or 0.3%. WTI also modestly firmed, helping the Canadian dollar limit losses, while the US dollar index pulled back and tested territories under 100.00.
In recent hours, H4 price steadied itself off the key figure 1.40, although dipping to lows at 1.3972. Sustained upside from 1.40 has April’s opening level at 1.4093 to target, as well as the 1.41 handle. Beyond these structures, traders will have eyes on two Quasimodo resistances at 1.4152 and 1.4182, along with a channel resistance, taken from the high 1.4349. Additionally, further upside may bring with it an AB=CD correction (black arrows) at 1.4144.
Price structure remains unchanged on the weekly timeframe. USD/CAD came within inches of clipping a long-term channel resistance, taken from the high 1.3661, last week, before collapsing to lows at 1.3908. Sellers, in the event of further selling, will face possible support off the 2016 yearly opening level at 1.3814. The said base stands in a reasonably healthy position as, overall, we’ve been trending higher since September 2017.
Since kicking off April, we have been carving out a consolidation between 1.3853-1.4228 on the daily timeframe. Areas outside of this base can be found at resistance drawn from 1.4292 and support at 1.3807. The 200-day SMA (orange – 1.3415), as you can probably see, has been drifting northbound since March.
Areas of consideration:
Traders who bought the dip into 1.40 enter Wednesday on a strong footing, targeting 1.41.
A move through 1.41 should not surprise today, owing to the H4 Quasimodo resistances seen at 1.4152/1.4182, channel resistance and AB=CD pattern at 1.4146 forming tight confluence.
As a result, active sellers will likely be looking to engage with 1.4152/1.4182.
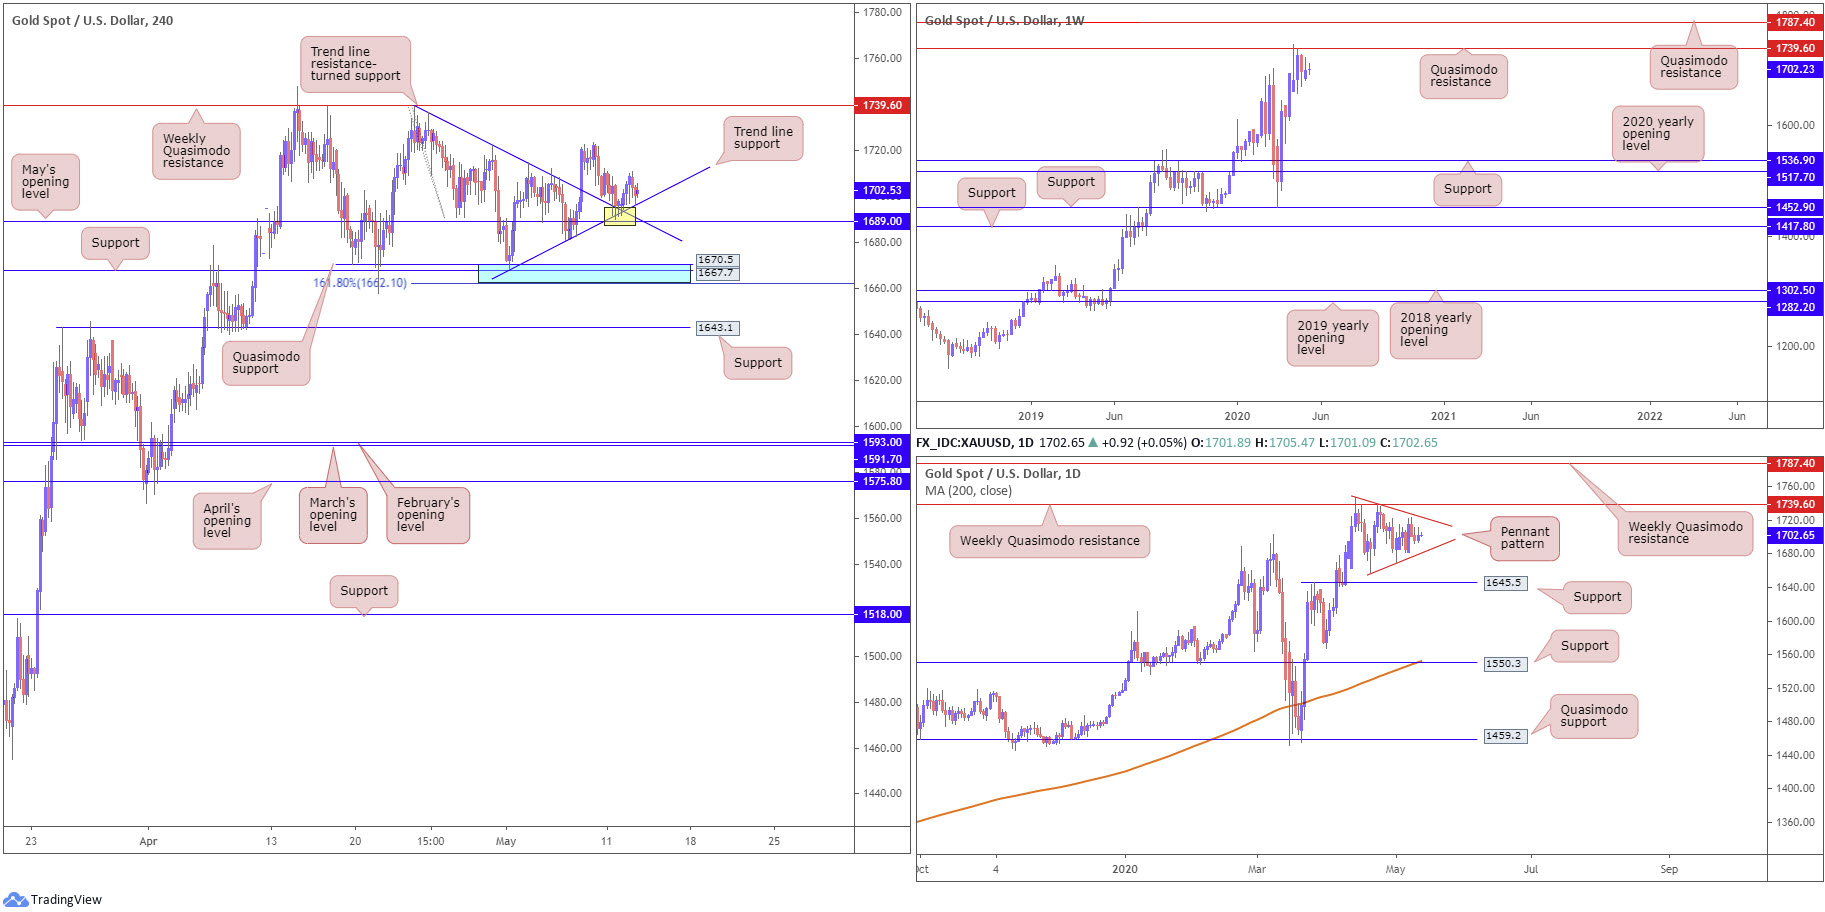
XAU/USD (GOLD):
Outlook unchanged due to Tuesday’s lacklustre movement.
As covered in Tuesday’s technical briefing, we recently shook hands with two merging trend line supports (1739.1/1668.0) on the H4 timeframe, plotted just north of May’s opening level at 1689.0 (yellow). Price has so far respected the said supports and held higher, though buying has not been much to get excited about.
South of the current H4 support, traders may recognise familiar support (blue), comprised of a 161.8% Fibonacci extension point at 1662.1, support at 1667.7 and Quasimodo support at 1670.5.
Buyers and sellers on the weekly timeframe continue to battle for position around the underside of Quasimodo resistance at 1739.6. Downside from this region echoes the prospect of eventually reaching support at 1536.9, while a breach of 1739.6 shifts focus towards another layer of Quasimodo resistance at 1787.4. It may also interest some traders to note the primary trend on gold has faced a northerly trajectory since 2016.
In similar fashion to the weekly timeframe, the weekly Quasimodo formation at 1739.6 is also posted as prominent resistance on the daily chart. The difference can be seen with reference to supports: the next support target on the daily timeframe falls in at 1645.5. Pattern traders may also acknowledge a forming pennant pattern at the underside of the weekly Quasimodo base, established from a high of 1747.7 and a low of 1658.1.
Areas of consideration:
The area of confluence on the H4 timeframe around May’s opening level at 1689.0 still offers intraday traders an area to work with. Failure to hold here will likely trigger breakout selling towards 1662.1-1670.5 (blue), which is another potential reversal zone buyers may have noted.
Printing a H4 close above 1739.6 will see longer-term breakout buyers make a show, perhaps taking aim at weekly Quasimodo resistance from 1787.4 as an initial target. This would also likely seal a daily close above the upper boundary of the current daily pennant pattern, adding fuel to any upside.
The accuracy, completeness and timeliness of the information contained on this site cannot be guaranteed. IC Markets does not warranty, guarantee or make any representations, or assume any liability regarding financial results based on the use of the information in the site.
News, views, opinions, recommendations and other information obtained from sources outside of www.icmarkets.com.au, used in this site are believed to be reliable, but we cannot guarantee their accuracy or completeness. All such information is subject to change at any time without notice. IC Markets assumes no responsibility for the content of any linked site.
The fact that such links may exist does not indicate approval or endorsement of any material contained on any linked site. IC Markets is not liable for any harm caused by the transmission, through accessing the services or information on this site, of a computer virus, or other computer code or programming device that might be used to access, delete, damage, disable, disrupt or otherwise impede in any manner, the operation of the site or of any user’s software, hardware, data or property.


