
DXY:
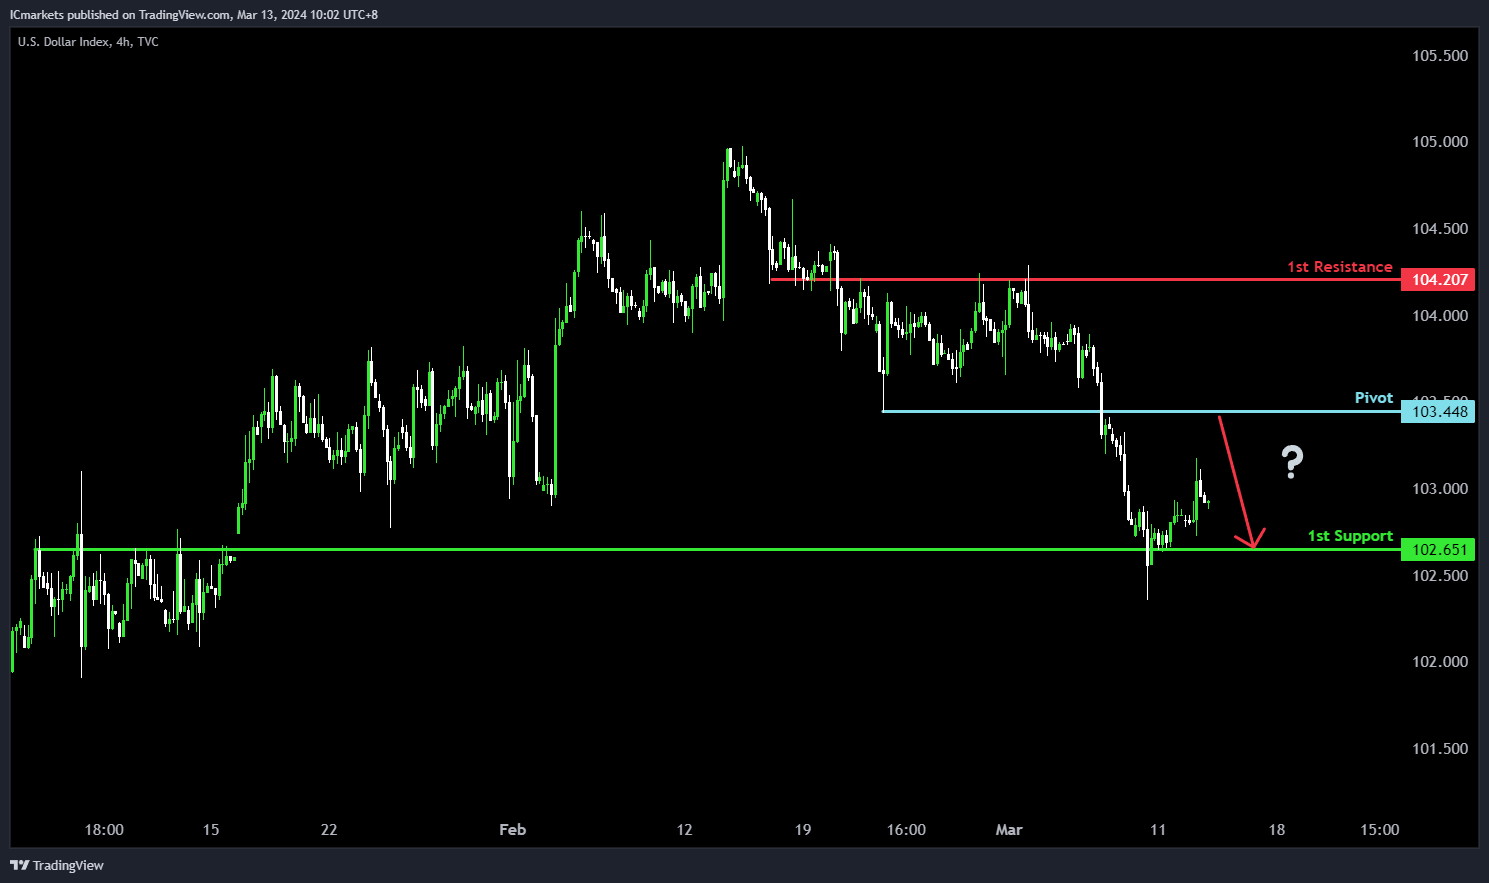
The DXY (Dollar Index) chart indicates a potential bearish movement, with a probable reaction at the pivot leading to a drop towards the 1st support. The pivot at 103.44 serves as significant pullback resistance, suggesting a potential barrier where selling pressure could intensify.
Conversely, the 1st support at 102.65 acts as crucial overlap support, potentially attracting buying interest and acting as a barrier against further downward movement.
On the resistance side, the 1st resistance at 104.20 forms a notable barrier, indicating a potential area where selling pressure may increase, potentially limiting further upward movement in the price.
EUR/USD:
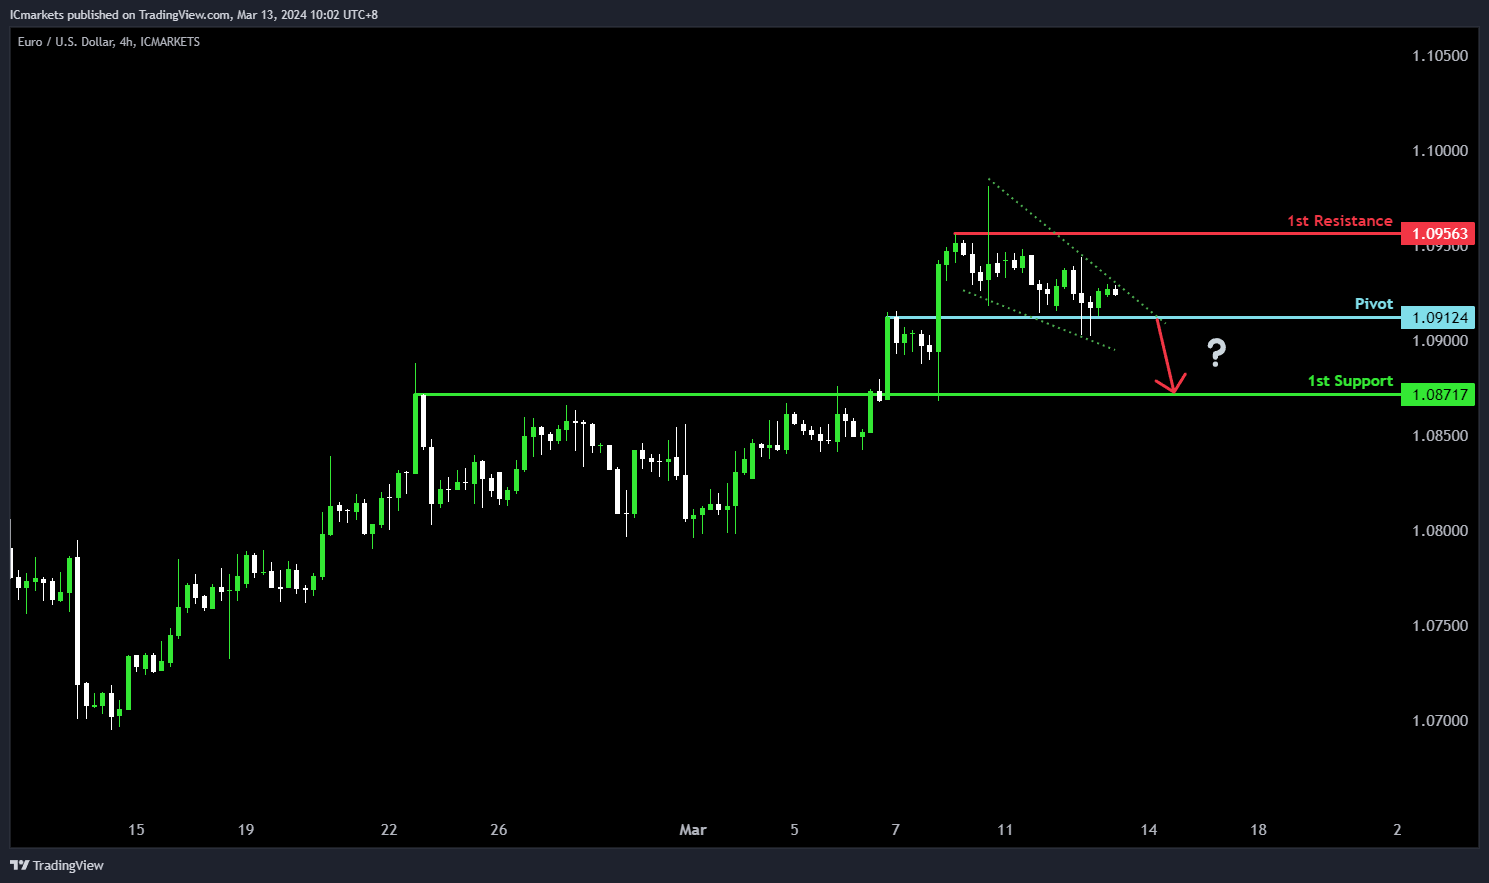
The EUR/USD pair presents a potential bearish scenario, despite the overall bullish momentum. There’s a likelihood of a bearish breakout from the pivot, with a subsequent drop towards the 1st support. The pivot level at 1.0912 acts as significant overlap support, indicating a potential area where buyers may intervene.
Moreover, the 1st support at 1.0871 reinforces this pattern, further indicating a historical area where buying interest has been observed. On the resistance side, the 1st resistance at 1.0956 forms a notable barrier, suggesting a potential area where selling pressure may increase, potentially limiting further upward movement in the price.
EUR/JPY:
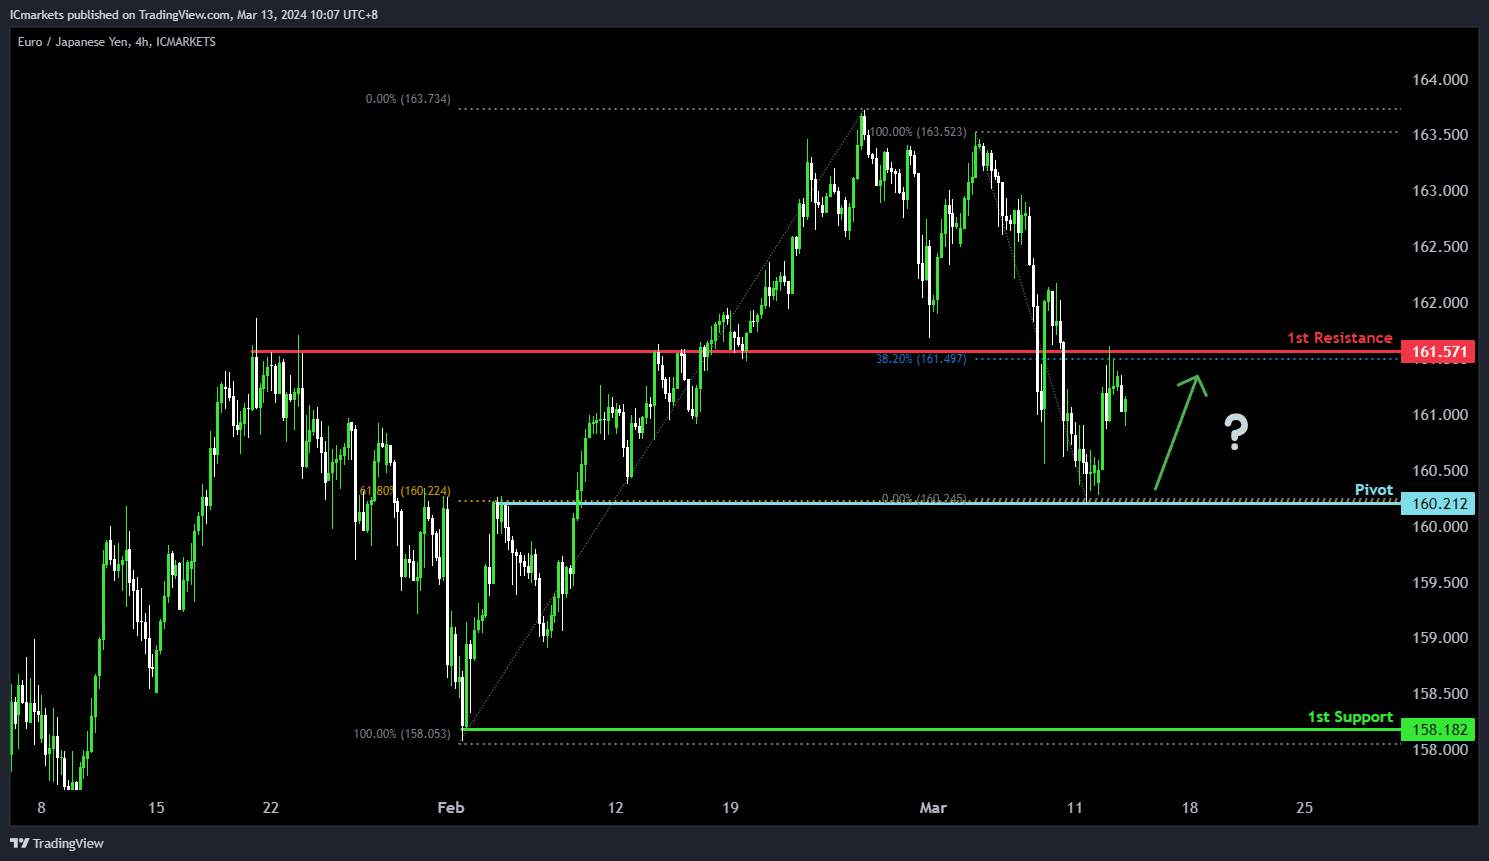
The EUR/JPY chart suggests a potential bullish direction, although the overall momentum appears bearish. Several factors contribute to this analysis.
The pivot level at 160.212 serves as an overlap support, indicating a significant historical level where buying interest may emerge. Additionally, it coincides with the 61.80% Fibonacci Retracement level, adding to its significance as a potential area of support.
Furthermore, the 1st support at 158.182 aligns with a swing low support, suggesting another level where buyers might enter the market.
On the resistance side, the 1st resistance level at 161.635 is identified as an overlap resistance, indicating a historical barrier to upward movement.
EUR/GBP:
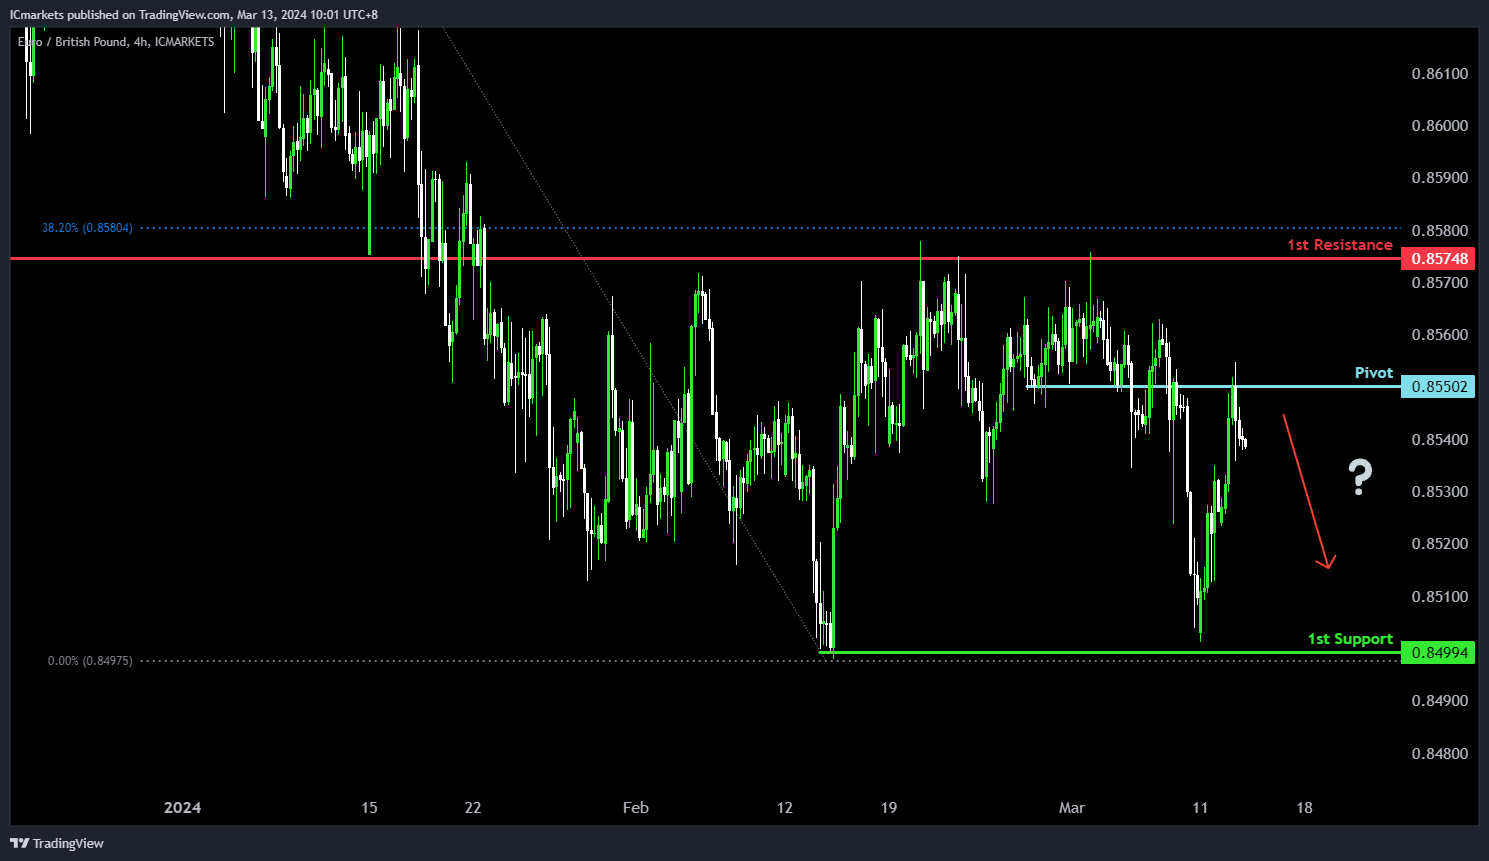
The EUR/GBP chart suggests a potential bearish direction, aligning with its overall bearish momentum. Several factors contribute to this outlook.
The pivot level at 0.85502 is identified as a point of interest, serving as a pullback resistance. This suggests a significant historical level where selling pressure may emerge.
Additionally, the 1st support level at 0.84994 corresponds to a swing low support, indicating a level where buying interest has previously emerged.
On the resistance side, the 1st resistance level at 0.85748 is notable as it aligns with an overlap resistance and coincides with the 38.20% Fibonacci Retracement level. This suggests a potential barrier to further upward movement.
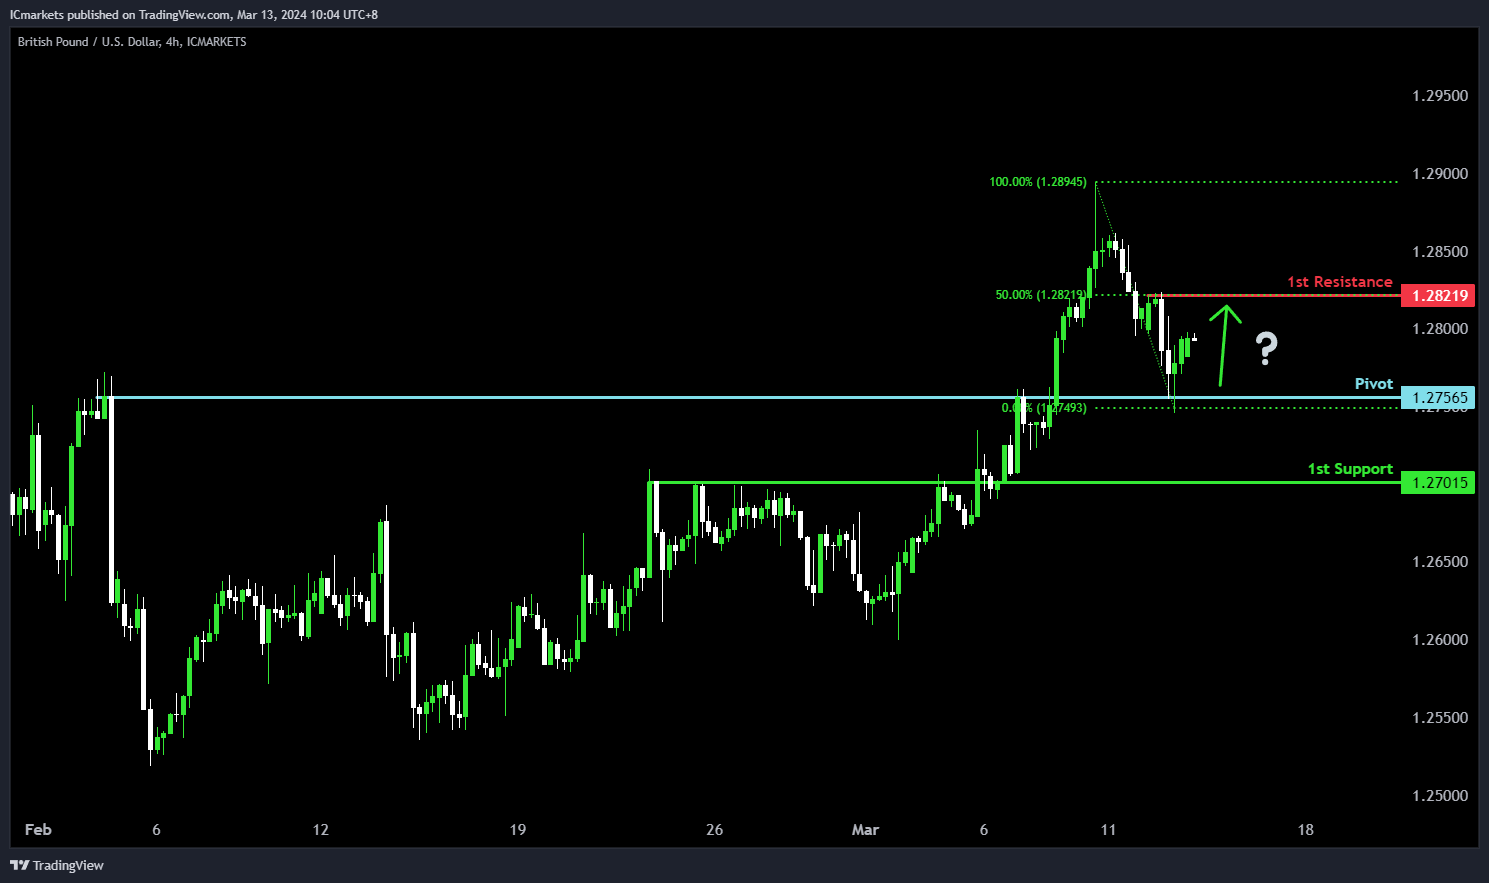
GBP/USD:
The GBP/USD pair indicates a potential bullish direction, aligning with the overall bullish momentum. There’s a possibility of a bullish continuation towards the 1st resistance level. The pivot at 1.2756 serves as significant overlap support, suggesting its importance as a level where buyers might intervene.
Additionally, the 1st support at 1.2701 reinforces this notion, indicating historical buying interest in this area. On the resistance side, the 1st resistance at 1.282 forms a notable barrier, supported by the 50% Fibonacci Retracement, indicating a potential area where selling pressure may intensify, potentially limiting further upward movement in the price.
.
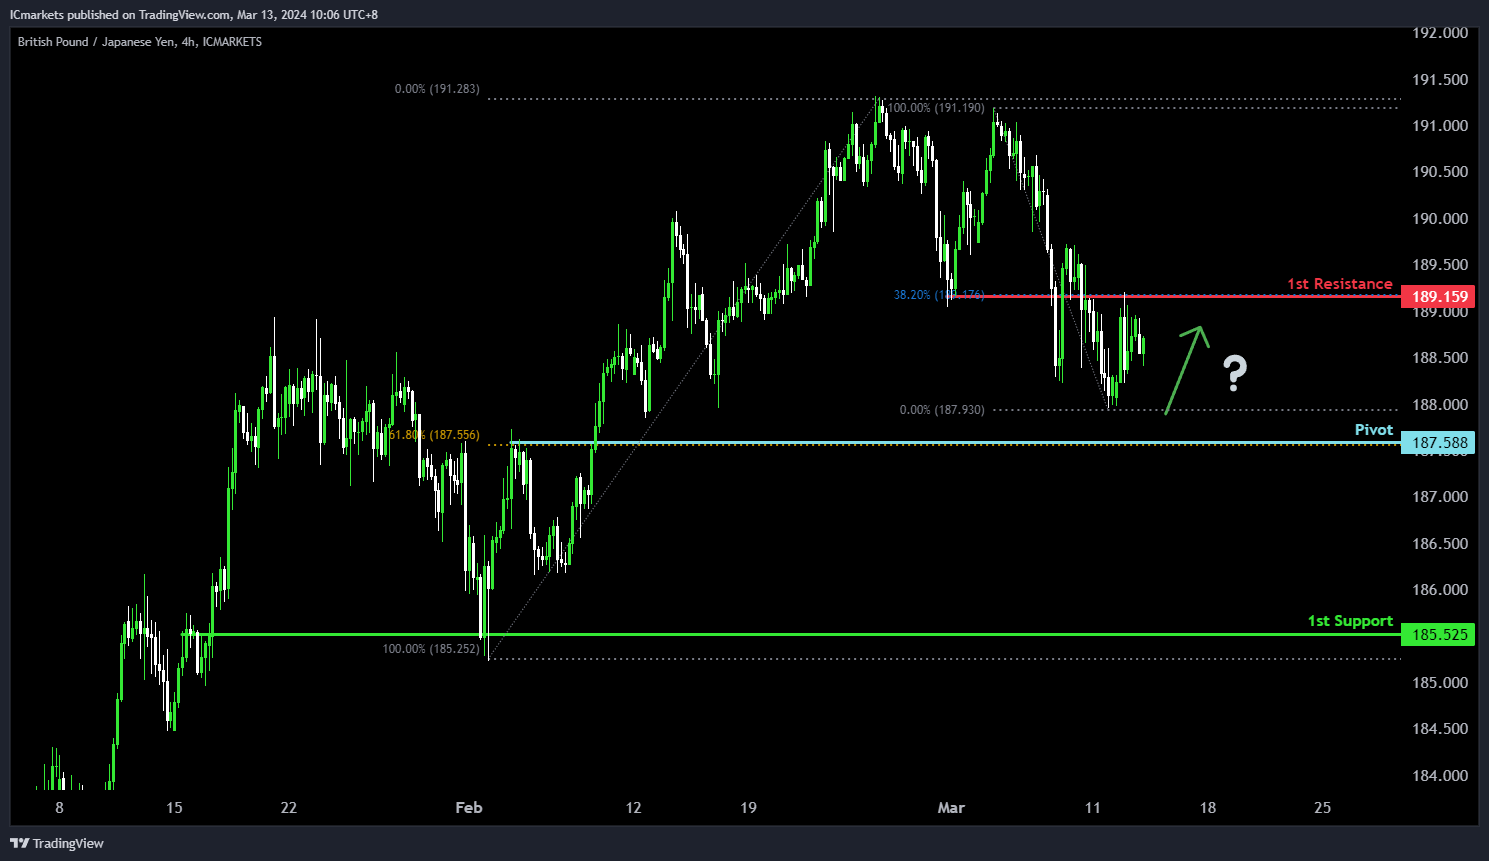
GBP/JPY:
The GBP/JPY chart suggests a potential bullish direction, although the overall momentum appears bearish. Several factors contribute to this analysis.
The pivot level at 187.588 serves as a pullback support and coincides with the 61.80% Fibonacci Retracement level, indicating a significant historical level where buying interest may emerge.
Additionally, the 1st support at 185.525 aligns with another pullback support level, reinforcing its significance as a potential area where buyers might enter the market.
On the resistance side, the 1st resistance level at 189.159 is identified as an overlap resistance and coincides with the 38.20% Fibonacci Retracement level, suggesting a historical barrier to upward movement.
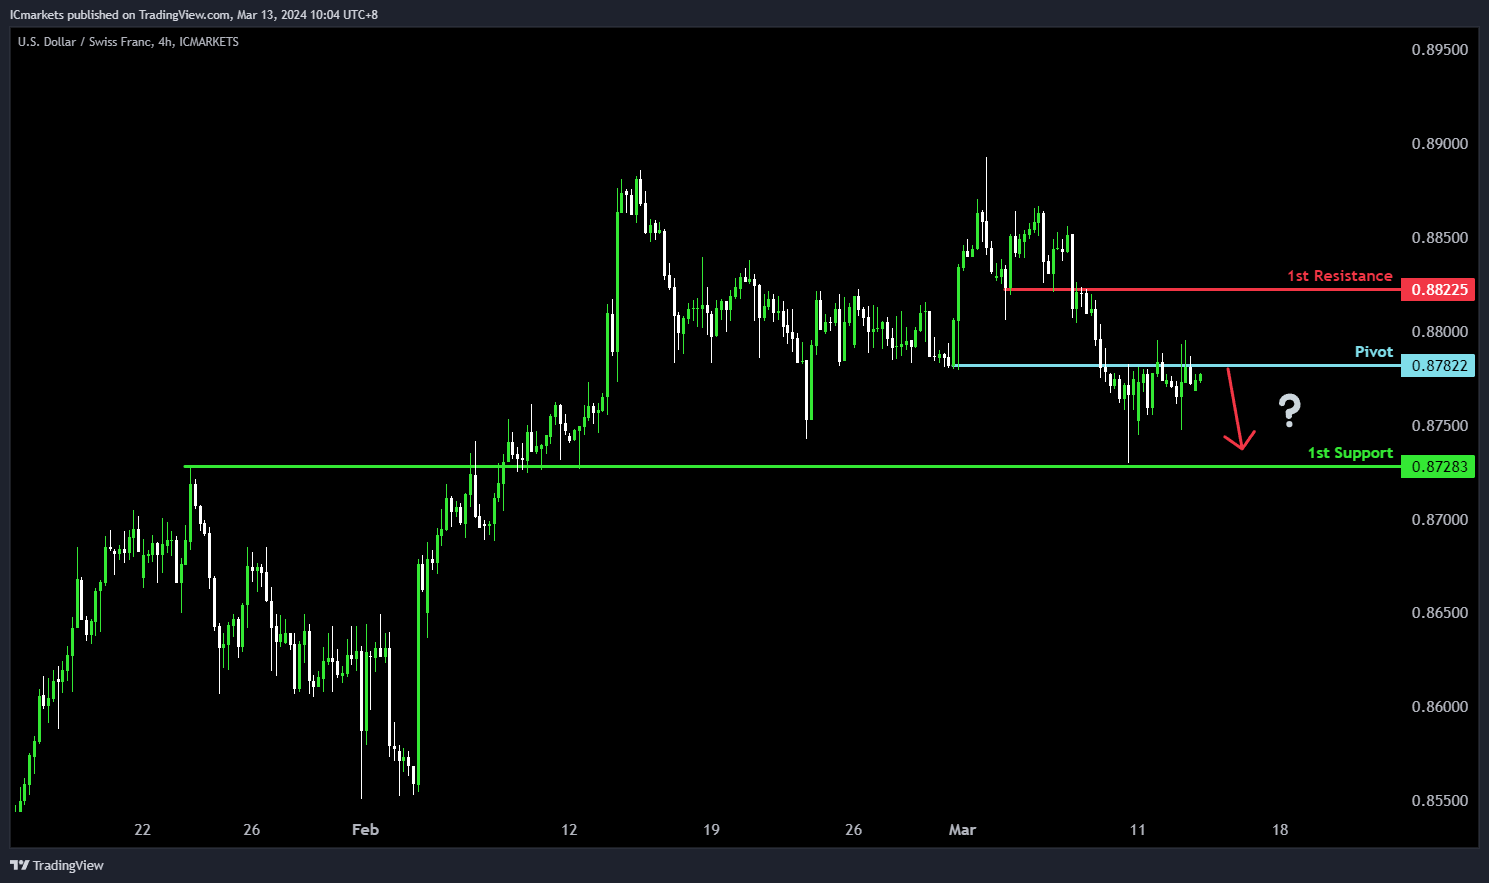
USD/CHF:
The potential direction for USD/CHF is bearish, consistent with the overall bearish momentum. There’s a likelihood of a bearish reaction from the pivot towards the 1st support level. The pivot at 0.8782 acts as a significant overlap resistance, suggesting its importance as a level where selling pressure might intensify.
Furthermore, the 1st support at 0.8728 serves as another crucial level, indicating historical buying interest. On the resistance side, the 1st resistance at 0.8822 forms a notable barrier, supported by overlap resistance, which could potentially hinder further upward movement in the price.
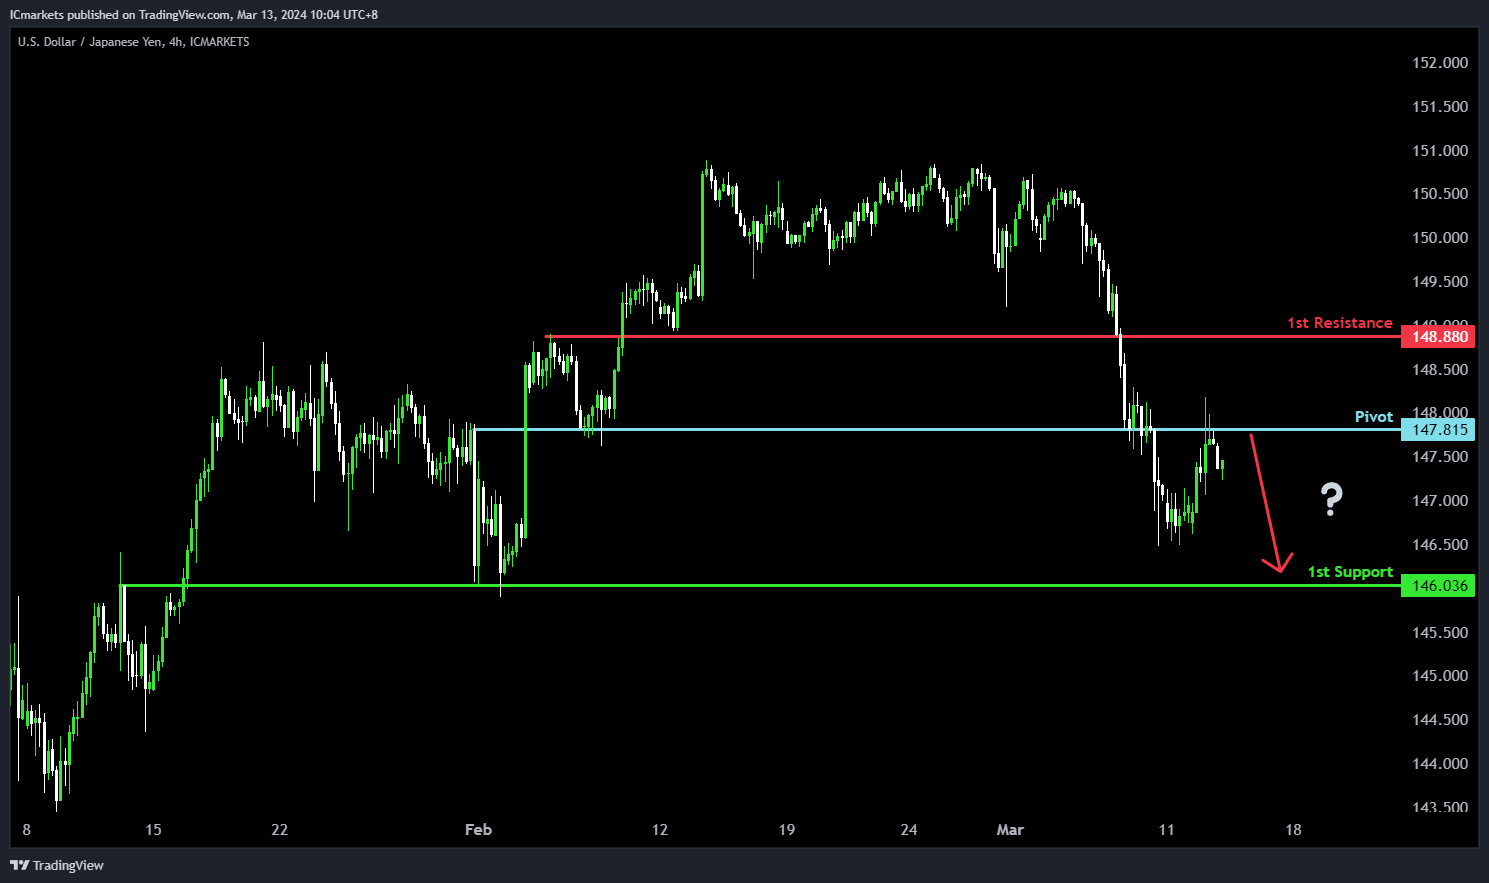
USD/JPY:
The USD/JPY, the potential direction is bearish, aligning with the prevailing bearish momentum. There’s a possibility of a bearish continuation towards the 1st support level. The pivot at 147.81 serves as a notable overlap resistance, indicating a level where selling pressure could intensify.
On the support side, the 1st support at 146.03 presents a significant level of historical buying interest, potentially acting as a support zone. Conversely, the 1st resistance at 148.88 forms a notable barrier, supported by pullback resistance, which could potentially limit further upward movement in the price.
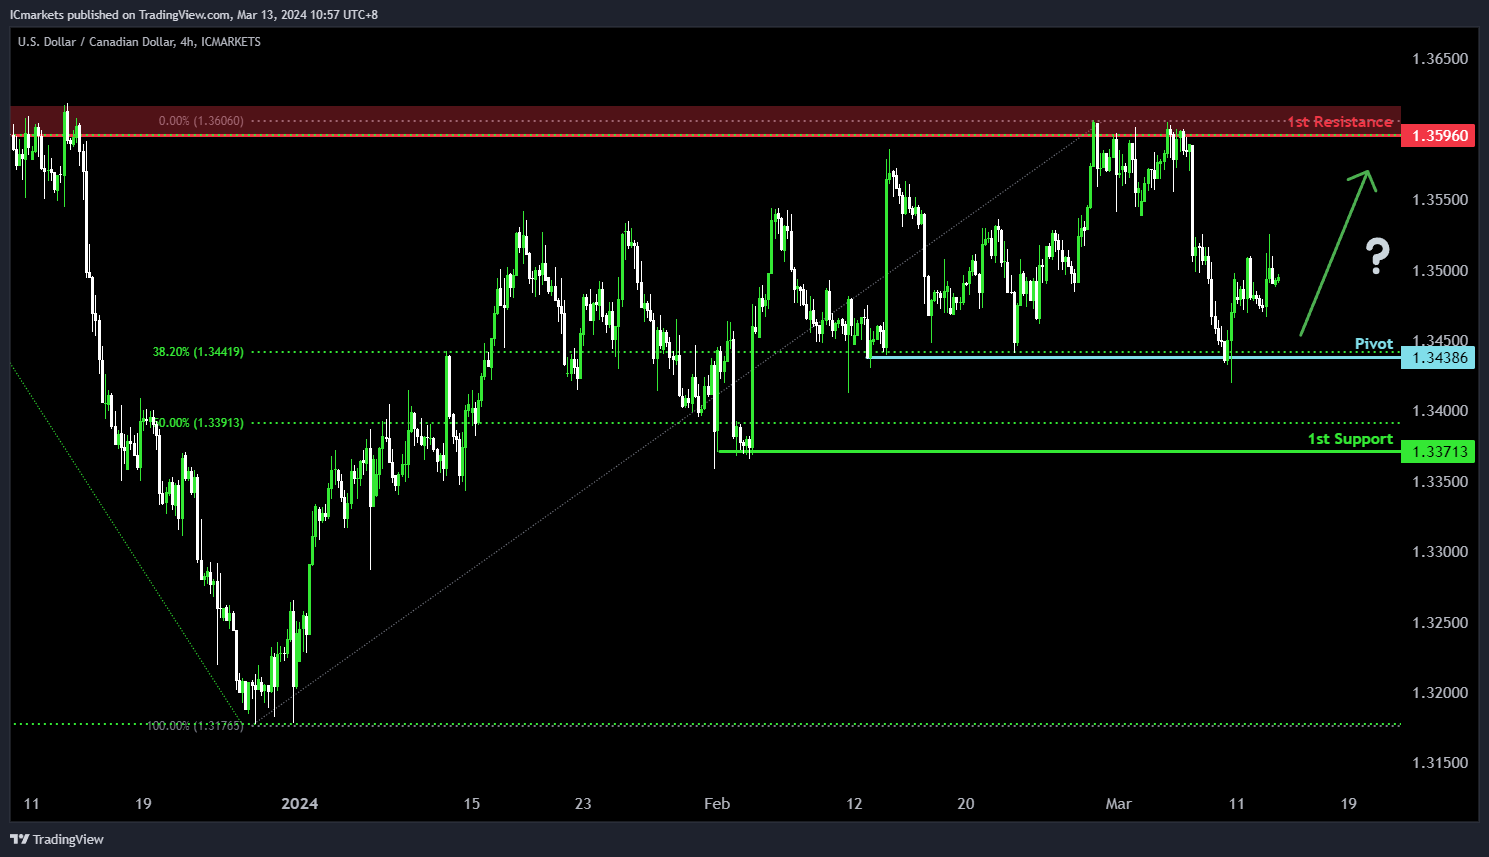
USD/CAD:
The USD/CAD chart currently demonstrates a neutral bias. In this context, there is a potential scenario for price to fluctuate between the pivot and the 1st resistance.
The pivot level at 1.3438 is identified as a pullback support that aligns with the 38.20% Fibonacci Retracement level where price could potentially bounce off to climb higher. Higher up, the 1st resistance level at 1.3596 is identified as a pullback resistance that aligns with the 61.80% Fibonacci Retracement level, further highlighting its importance as a potential resistance zone.
To the downside, the 1st support level at 1.3371 is marked as a pullback support that aligns close to the 50.00% Fibonacci Retracement level, reinforcing its significance as a key support level.
AUD/USD:
The AUD/USD chart currently demonstrates a neutral bias. In this context, there is a potential scenario for price to fluctuate between the pivot and the 1st resistance.
The pivot level at 0.6650 is identified as an overlap resistance that aligns with the 50.00% Fibonacci Retracement level where price could potentially reverse from to drop lower. The 1st support level at 0.6480 is marked as a pullback support, reinforcing its significance as a key support level.
On the resistance side, the 1st resistance level at 0.6726 is identified as a pullback resistance, potentially limiting any further upward movement.

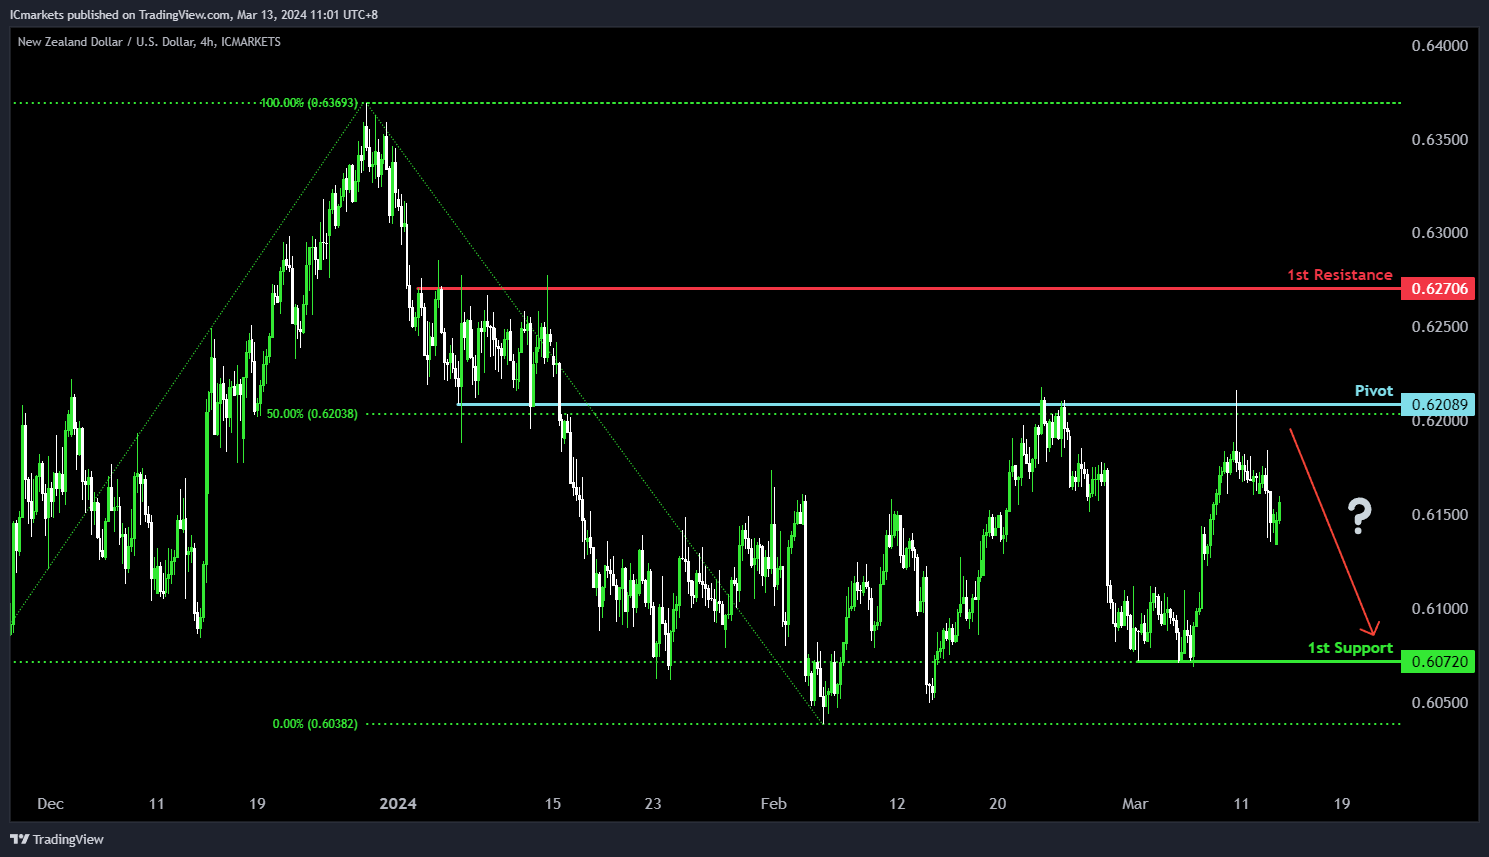
NZD/USD
The NZD/USD chart currently demonstrates a neutral bias. In this context, there is a potential scenario for price to fluctuate between the pivot and the 1st support.
The pivot level at 0.6208 is identified as an overlap resistance that aligns with the 50.00% Fibonacci Retracement level where price could potentially reverse from to drop lower. The 1st support level at 0.6072 is marked as a pullback support, reinforcing its significance as a key support level.
On the resistance side, the 1st resistance level at 0.6270 is identified as a pullback resistance, potentially limiting any further upward movement.
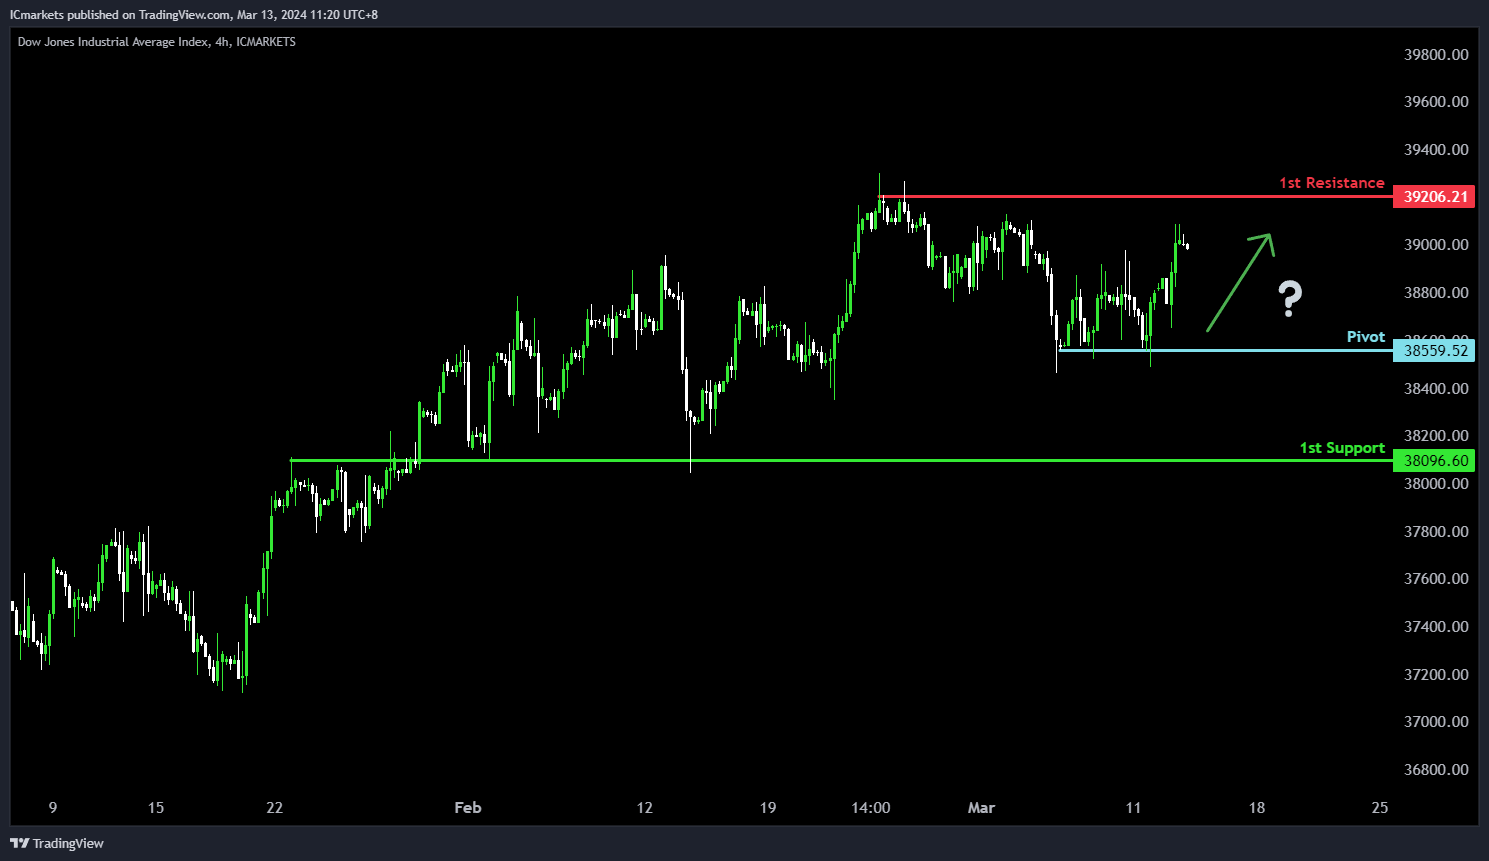
DJ30:
The DJ30 chart indicates a potential bullish direction, aligning with the overall bullish momentum. Several factors contribute to this analysis.
The pivot level at 38559.52 serves as a swing low support, indicating a significant historical level where buying interest has previously emerged.
Furthermore, the 1st support at 38096.60 is identified as an overlap support, reinforcing its significance as a potential area where buyers might enter the market.
On the resistance side, the 1st resistance level at 39206.21 is characterized as a swing high resistance, suggesting a historical barrier to upward movement.
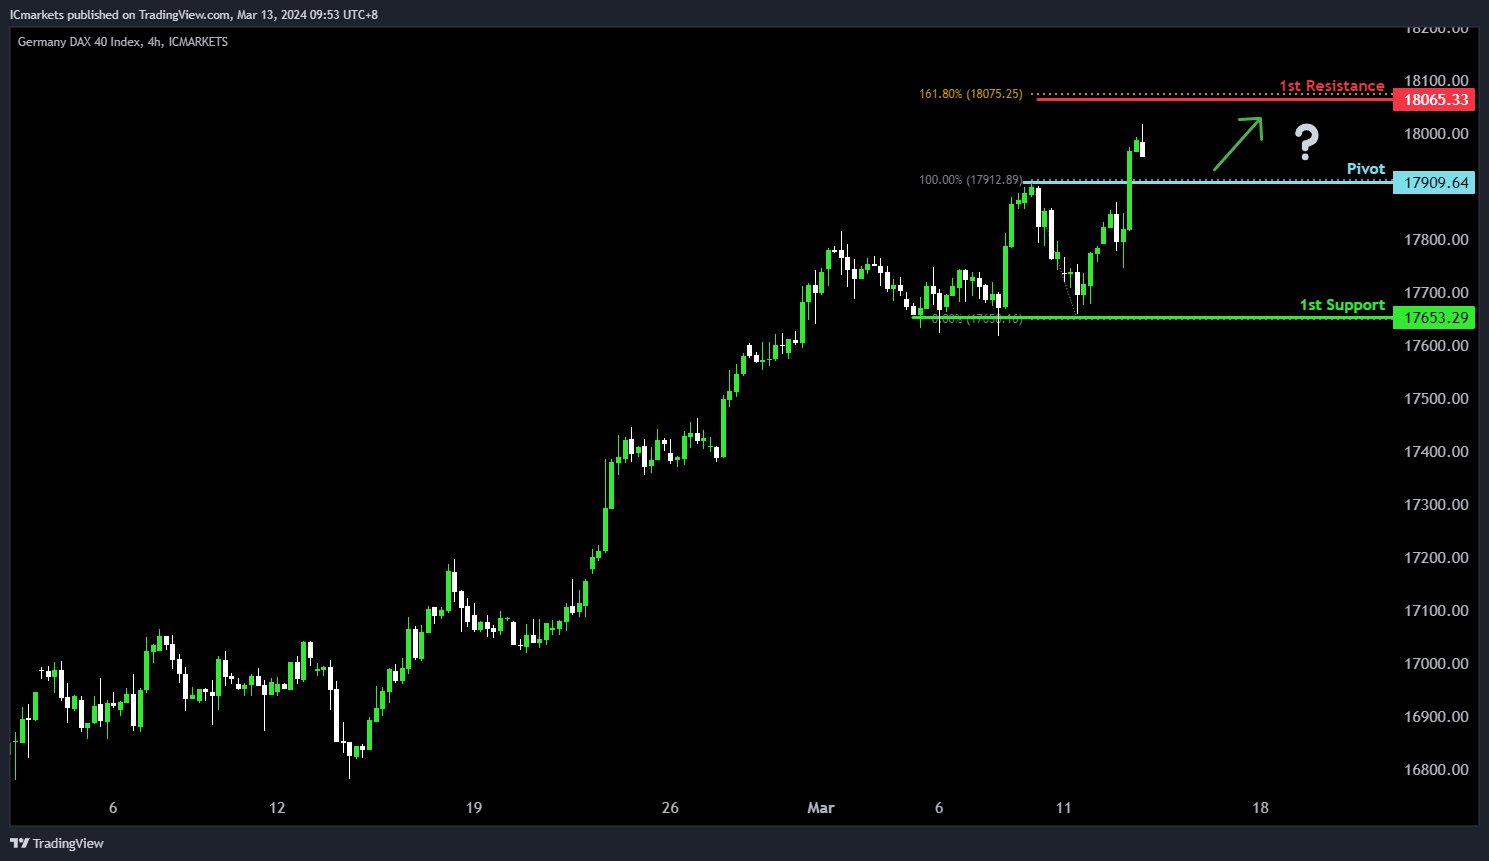
GER40:
The GER40 chart presents a bullish potential direction, aligned with its overall bullish momentum. Several factors contribute to this outlook.
The pivot level at 17909.64 is pivotal as it serves as a pullback support, indicating a significant historical level where buying interest has been observed in the past.
Furthermore, the 1st support at 17653.29 is identified as a swing low support, strengthening its significance as a potential area where buyers might step in.
On the resistance side, the 1st resistance level at 18065.33 is noteworthy as it corresponds to the 161.80% Fibonacci Extension, suggesting a potential barrier to further upward movement.
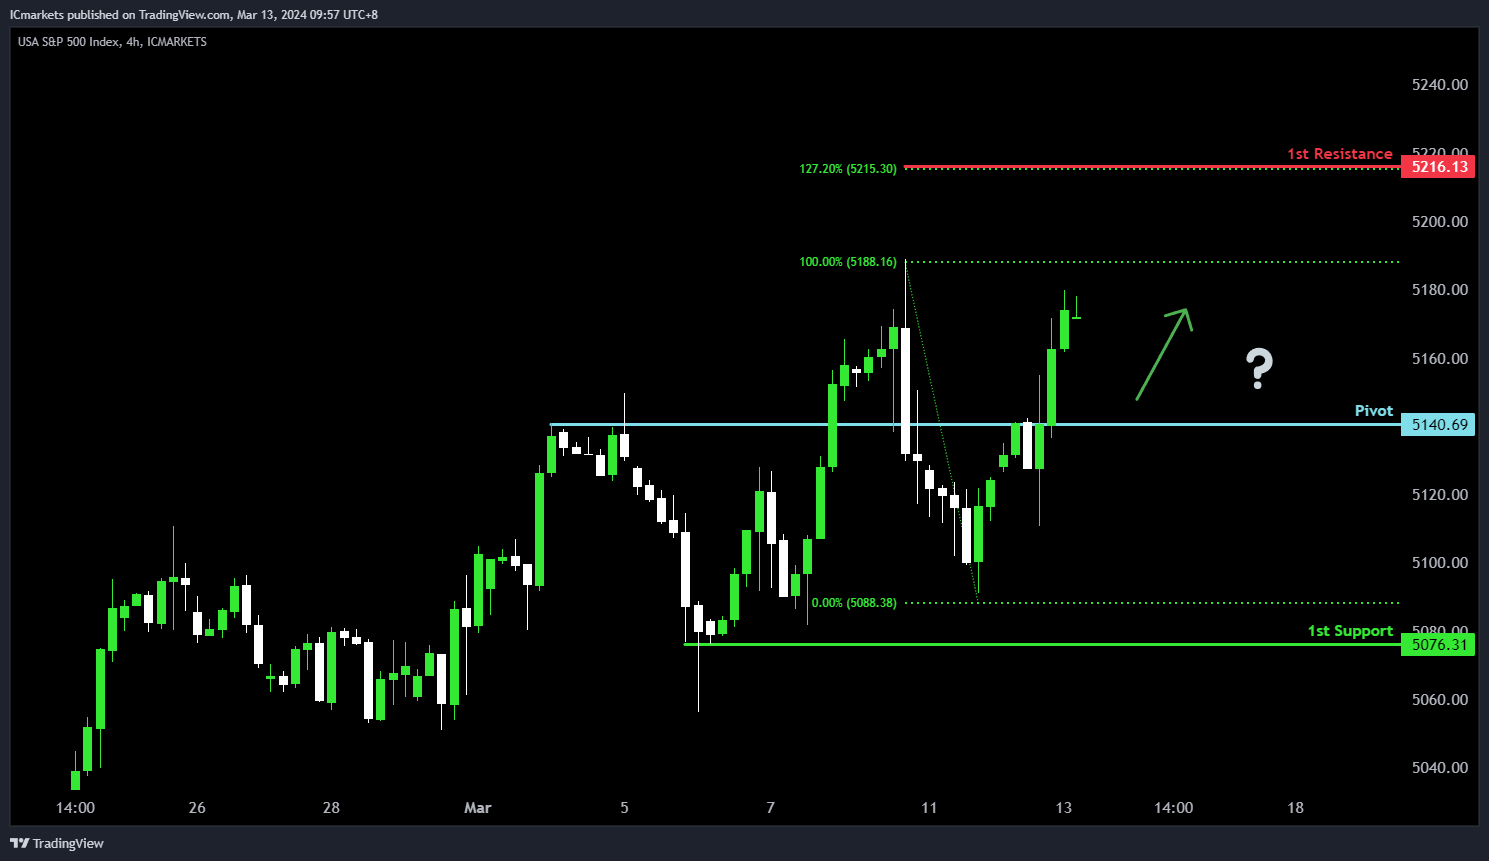
US500:
The US500 chart indicates a potential bullish direction, consistent with its overall bullish momentum. Several factors contribute to this sentiment.
The pivot level at 5140.69 serves as a crucial point of interest, functioning as a pullback support, indicating a significant historical level where buying interest has previously emerged.
Additionally, the 1st support level at 5076.31 aligns with a swing low support, further reinforcing its significance as a potential area where buyers might step in.
On the resistance side, the 1st resistance level at 5216.13 is notable as it corresponds to the 127.20% Fibonacci Extension, suggesting a potential barrier to further upward movement.
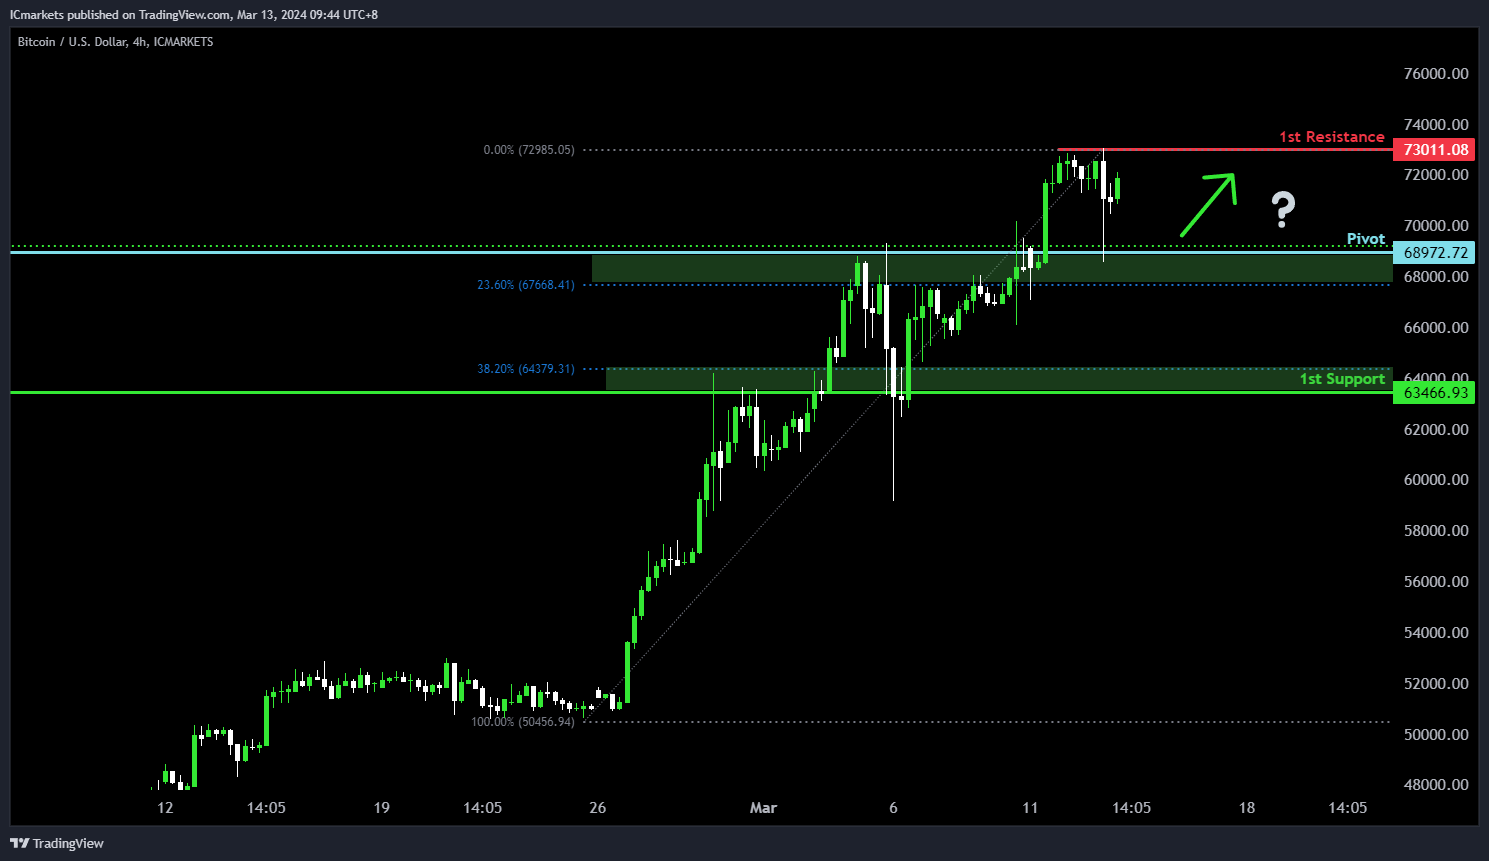
BTC/USD:
The BTC/USD chart currently exhibits a bullish overall momentum, indicating a potential continuation of the upward trend. Several factors contribute to this bullish sentiment.
The pivot level at 68972.72 serves as an overlap support and coincides with the 23.60% Fibonacci Retracement level, indicating a significant historical level where buying interest could emerge.
Additionally, the 1st support at 63466.93 aligns with another overlap support and the 38.20% Fibonacci Retracement level, further reinforcing its significance as a potential area of support.
On the resistance side, the 1st resistance level at 73011.08 is identified as a swing high resistance, suggesting a historical barrier to further upward movement.
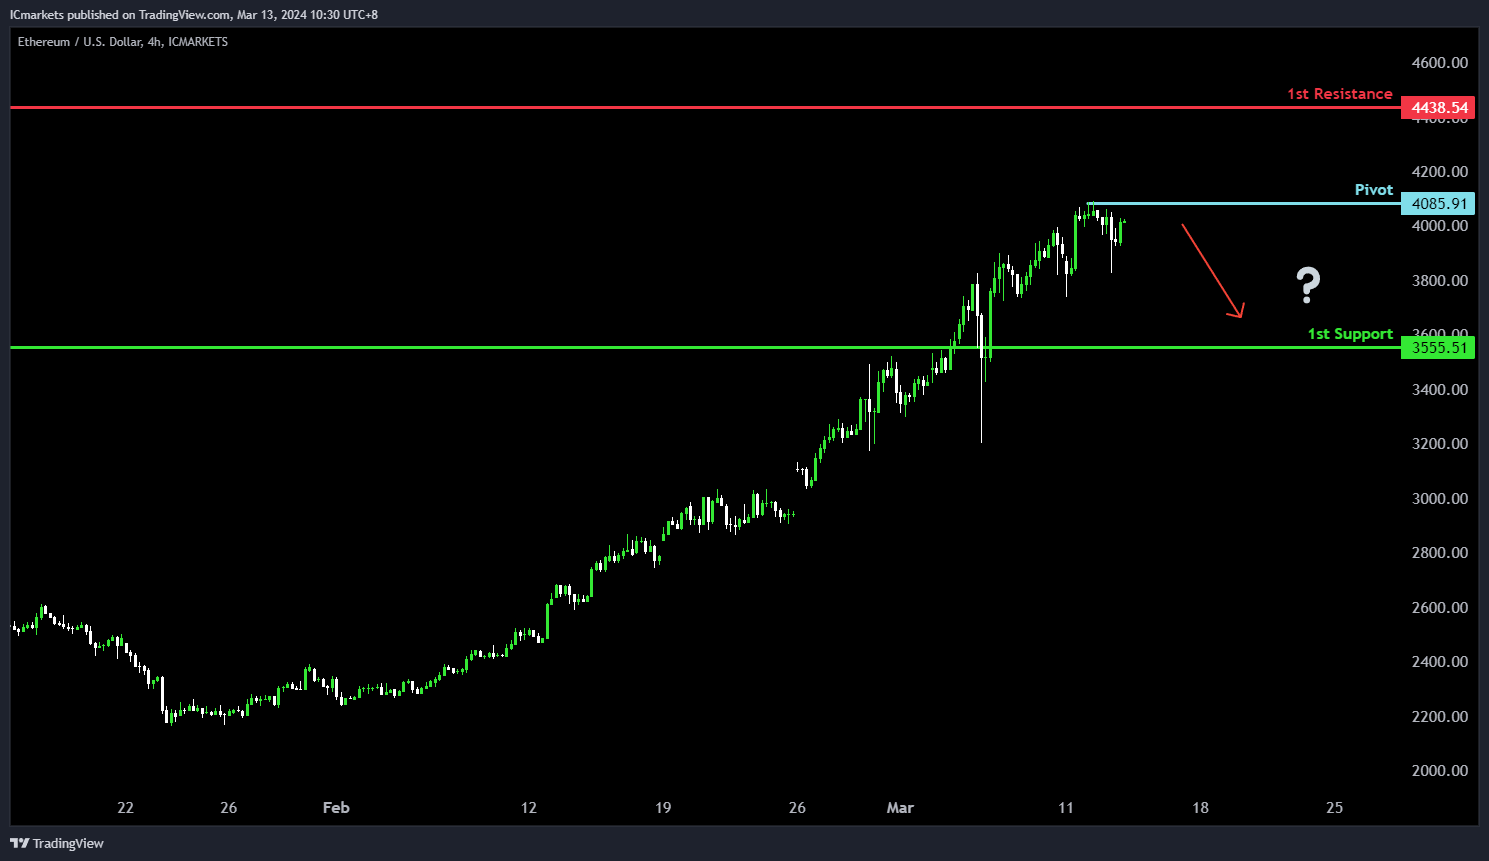
ETH/USD:
The ETH/USD chart currently exhibits a bullish overall momentum, suggesting a continuation of the upward trend. However, there’s a potential short-term bearish scenario that could unfold, as indicated by the factors contributing to the momentum.
The pivot level at 4085.91 serves as a swing high resistance, indicating a significant historical barrier to further upward movement. In the short term, the price could potentially rise towards this pivot level before reversing off it.
The 1st support at 3555.51 is identified as a pullback support, suggesting a level where buying interest may emerge if the price retraces from the pivot level.
On the resistance side, the 1st resistance level at 4438.54 is also characterized as a swing high resistance, reinforcing its significance as a barrier to further bullish movement.
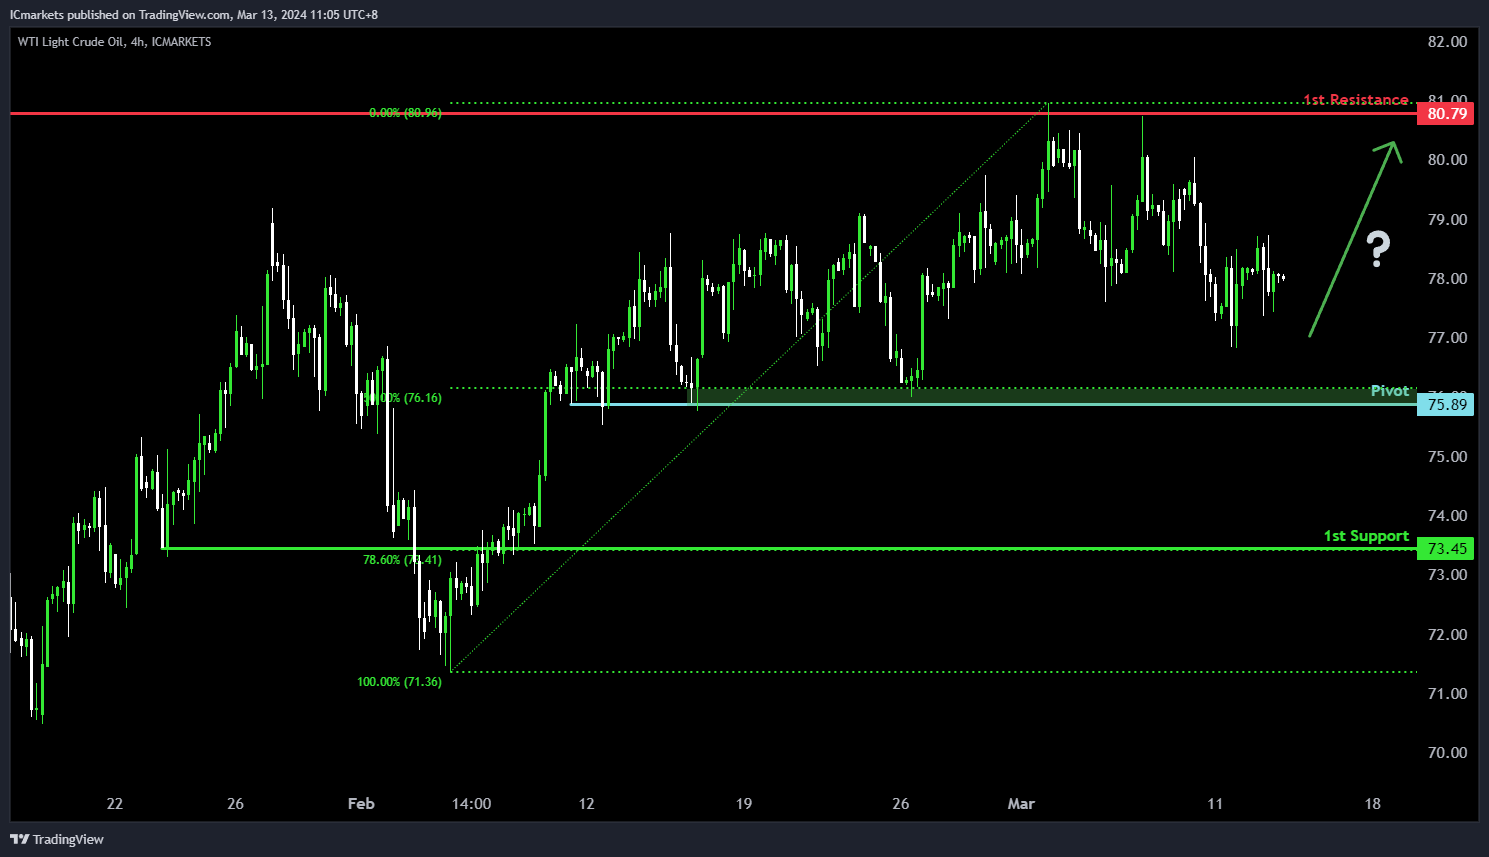
WTI/USD:
The WTI (West Texas Intermediate) chart currently demonstrates a neutral bias. In this context, there is a potential scenario for price to fluctuate between the pivot and the 1st resistance.
The pivot level at 75.89 is identified as a pullback support that aligns close to the 50.00% Fibonacci Retracement level where price could potentially reverse from to climb higher. Higher up, the 1st resistance level at 80.79 is noted as an overlap resistance, further reinforcing its significance as a potential barrier to further bullish movement.
To the downside, the 1st support level at 73.45 is marked as an overlap support that aligns with the 78.60% Fibonacci Retracement level, reinforcing its significance as a key support level.
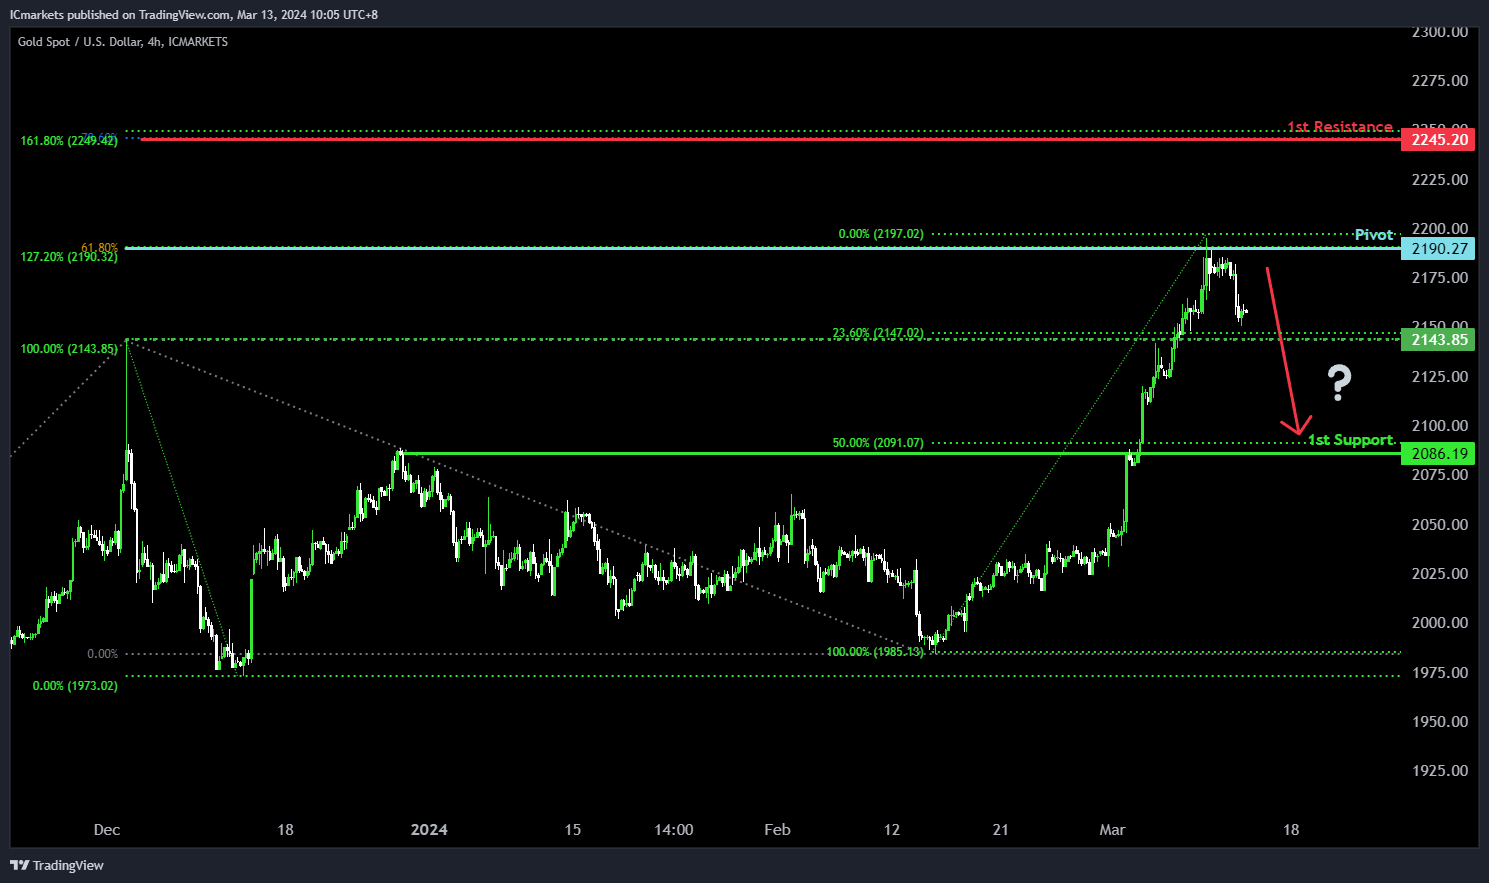
XAU/USD (GOLD):
The XAU/USD chart suggests the potential direction is bearish despite the overall bullish momentum. There’s a likelihood of a bearish continuation towards the 1st support level. The pivot at 2190.27 acts as a significant swing high resistance, supported by the 61.80% Fibonacci Projection and the 127.20% Fibonacci Extension, indicating Fibonacci confluence.
On the support side, the 1st support at 2084.19 serves as a pullback support, potentially attracting buying interest and halting the downward movement. Meanwhile, the 1st resistance at 2245.20 forms a robust barrier, reinforced by the 78.60% Fibonacci Projection and the 161.80% Fibonacci Extension, suggesting a strong resistance zone where selling pressure could intensify.
Additionally, the intermediate support at 2143.85 further reinforces the pullback support zone.
The accuracy, completeness and timeliness of the information contained on this site cannot be guaranteed. IC Markets does not warranty, guarantee or make any representations, or assume any liability regarding financial results based on the use of the information in the site.
News, views, opinions, recommendations and other information obtained from sources outside of www.icmarkets.com, used in this site are believed to be reliable, but we cannot guarantee their accuracy or completeness. All such information is subject to change at any time without notice. IC Markets assumes no responsibility for the content of any linked site.
The fact that such links may exist does not indicate approval or endorsement of any material contained on any linked site. IC Markets is not liable for any harm caused by the transmission, through accessing the services or information on this site, of a computer virus, or other computer code or programming device that might be used to access, delete, damage, disable, disrupt or otherwise impede in any manner, the operation of the site or of any user’s software, hardware, data or property.


