
EUR/USD:
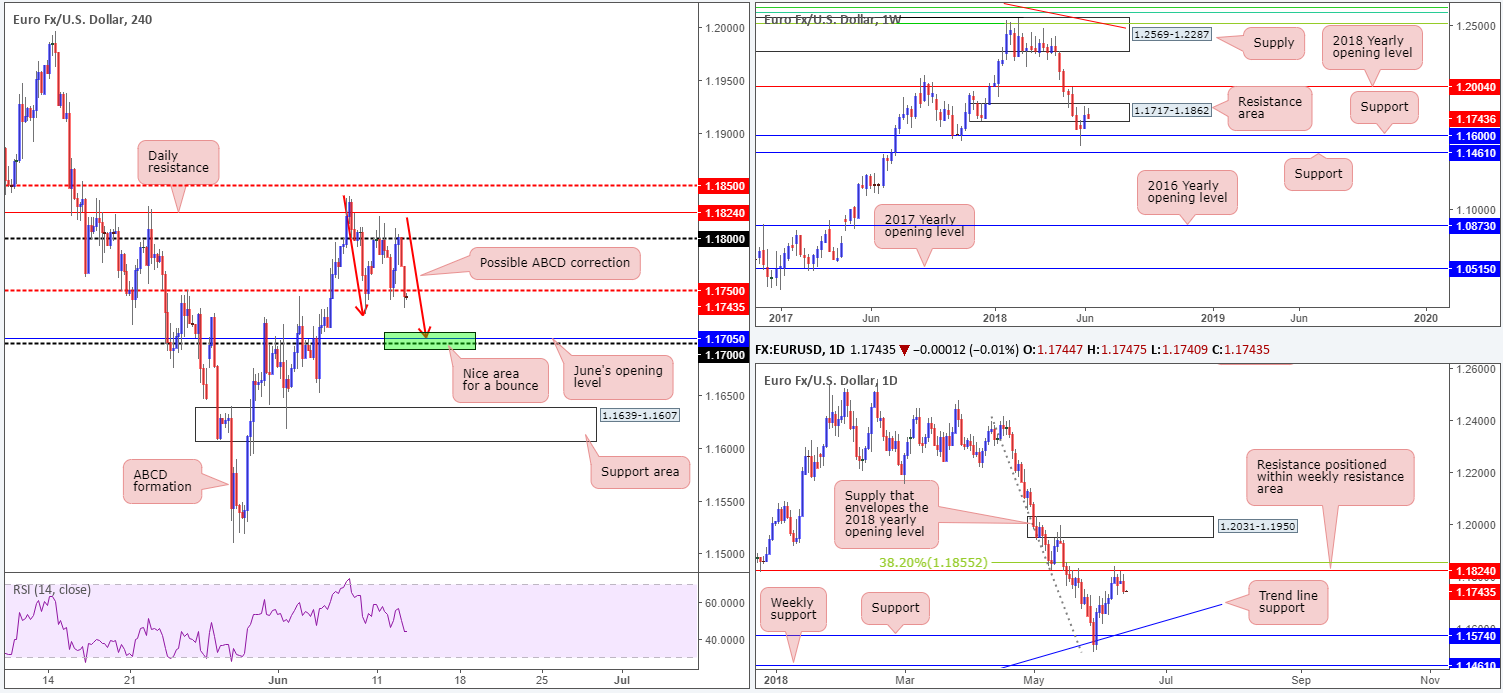
EUR/USD bulls, as you can see, failed to sustain gains beyond the 1.18 handle on the H4 timeframe, consequently ending Tuesday’s segment marginally closing beyond H4 mid-level support priced in at 1.1750.
Demand for the USD on the back of the Trump/Kim summit faded relatively quickly in early trade. Later on we witnessed US CPI headline hit a six-year high at 2.8%, beating expectations of 2.7%. The monthly figure was in line at 0.2%. The monthly core CPI ticked higher in May to 0.2%, slightly above the 0.1% forecast. Data, however, did little to lift the greenback as CPI metrics were close to consensus. In afternoon trade, nevertheless, a WSJ piece suggested Powell was considering a post-meeting press conference following every rate decision. This put a bid into the USD, which we believe was the main catalyst behind the drop from the 1.18 handle.
Higher-timeframe technical structure shows weekly price remains trading within the walls of a weekly resistance area seen at 1.1717-1.1862. Also of particular interest is daily resistance seen at 1.1824, which happens to be sited within the aforementioned weekly area.
Areas of consideration:
Given the overhead resistance seen on both weekly and daily structure right now, there’s a good chance we’ll witness a test of the 1.17 region on the H4 scale. Technically speaking, this is likely to be an area of interest for intraday longs given its connection with June’s opening level at 1.1705, and (possible) H4 ABCD (see red arrows) approach.
Well done to those who managed to pin down a sell from 1.18 as this was a noted line to watch in Tuesday’s report.
In terms of economic data today, eyes will be on the FOMC rate decision and press conference with Chairman Powell. Consensus expects a 25bps hike to 1.75%-2.00%.
Today’s data points: US PPI and core PPI m/m; FOMC rate decision, FOMC economic projections and press conference.
GBP/USD:
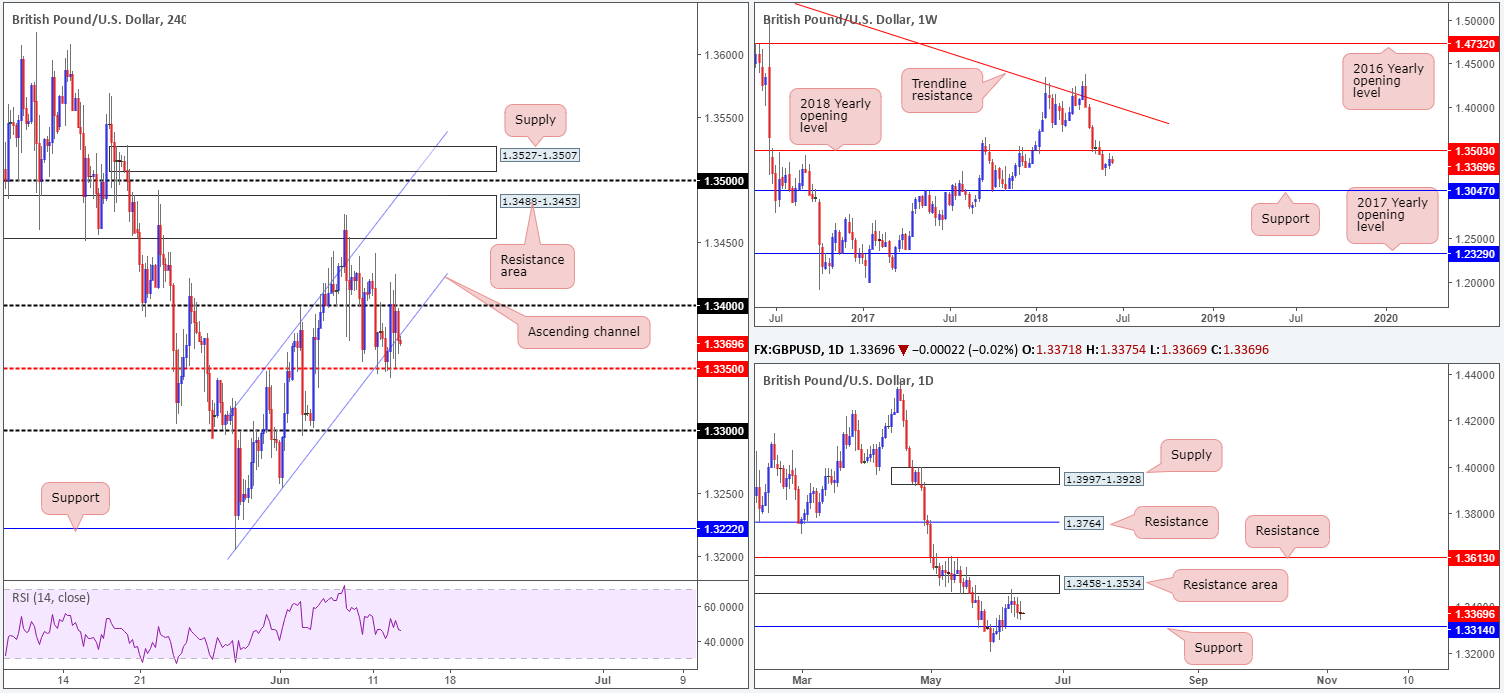
The GBP/USD experienced a considerable amount of choppy action as the vote on Lords amendments got underway on Tuesday.
In terms of the technical picture, nonetheless, we can see that weekly price remains hovering just south of the 2018 yearly opening level at 1.3503. This is a key level, traders. A closer look at price action on the daily timeframe, shows us that the sellers extended losses from the daily resistance area coming in at 1.3458-1.3534 (encapsulates the noted 2018 yearly opening level within), and appears to be eyeing daily support marked at 1.3314. A look at the H4 candles, however, reveals that price is sandwiched between the 1.34 handle and mid-level support marked at 1.3350, which unties closely with a channel support taken from the low 1.3204.
Areas of consideration:
In view of the series of higher highs and higher lows on the H4 scale from lows of 1.3204, further buying towards the H4 resistance area at 1.3488-1.3453, and quite possibly the 1.35 handle/nearby H4 supply at 1.3527-1.3507, could be on the cards.
The H4 supply is also of particular interest as a potential sell zone. Positioned strategically above the 1.35 handle, the zone has ‘fakeout 1.35 to me’ written all over it. Also note that the H4 supply is positioned within the walls of the current daily resistance area and the 1.35 handle represents the 2018 yearly opening level mentioned above at 1.3503 (weekly timeframe). An ideal sell signal from here, therefore, would be a H4 bearish pin-bar formation that pierces through 1.35 and connects with the aforementioned H4 supply.
Today’s data points: UK inflation figures; US PPI and core PPI m/m; FOMC rate decision, FOMC economic projections and press conference.
AUD/USD:
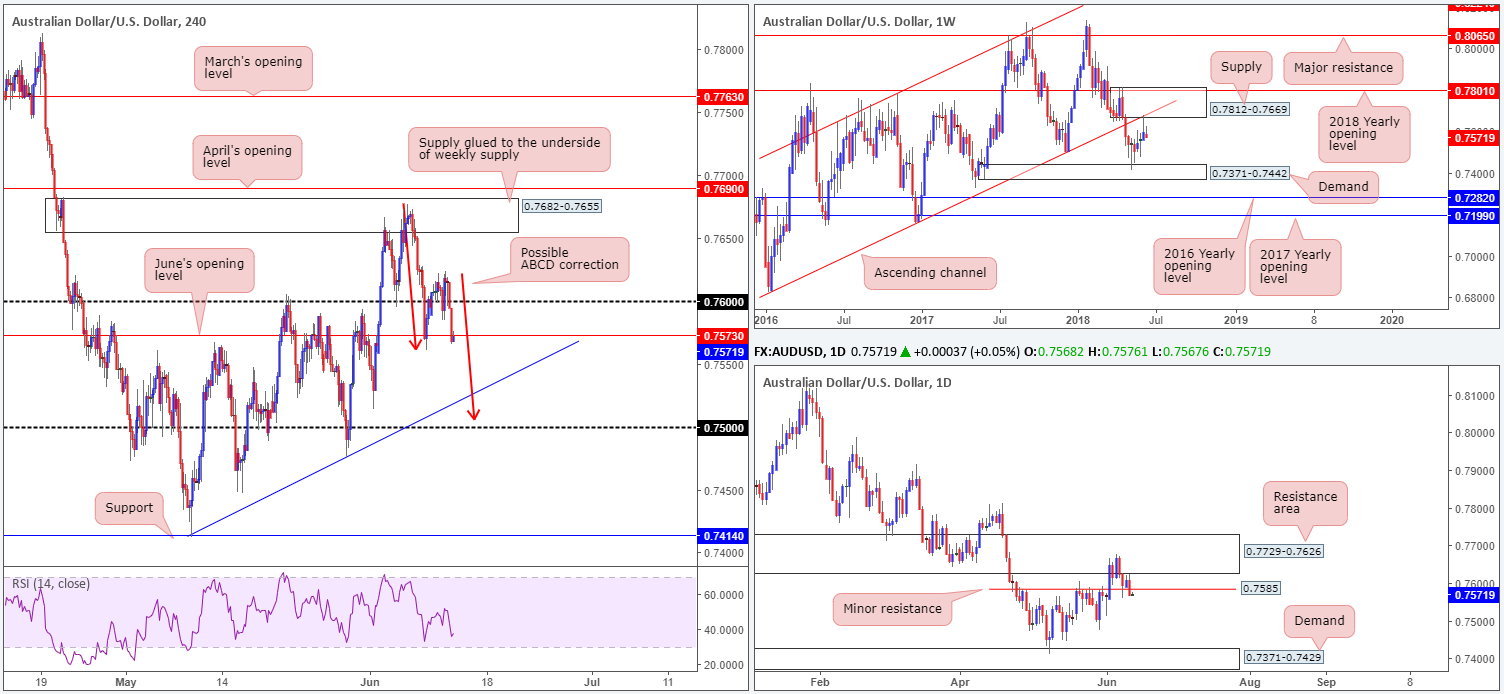
Influenced by a healthy USD amid US trade on Tuesday, the commodity-linked currency declined in value. Shaped by two full-bodied H4 bearish candles, the pair reclaimed the 0.76 handle and marginally closed below June’s opening level priced in at 0.7573. Assuming the sellers remain in the driving seat sub 0.7573 today, this could eventually lead to a test of H4 trend line support taken from the low 0.7412, followed closely by the 0.75 handle. Also notable here is the potential H4 ABCD correction (red arrows) that completes around the 0.75 neighborhood.
As highlighted in Monday’s weekly report, price action on the weekly timeframe put in a somewhat prominent bearish pin-bar formation off the lower edge of a weekly supply at 0.7812-0.7669 and its intersecting weekly channel support-turned resistance (extended from the low 0.6827) last week. Technically speaking, this will likely attract candlestick enthusiasts into the market, looking to target nearby weekly demand priced in at 0.7371-0.7442.
Movement on the daily timeframe printed a beautiful bearish engulfing candle in recent trade, which, as you can see, engulfed minor daily support at 0.7585 (now acting resistance). In consequence to this, the May 30 low at 0.7476 is in the firing range, shadowed closely daily demand at 0.7371-0.7429 (sited within the lower limit of the said weekly demand).
Areas of consideration:
On account of the above reading, the team believes that the sellers have the upper hand at the moment. Ultimately, though, before committing to shorts, we would recommend waiting for more of a decisive H4 close beyond June’s opening level mentioned above at 0.7573. This – coupled with a retest of this number as resistance – would, in our technical opinion, be enough to suggest selling this market, targeting noted H4 trend line support and 0.75 handle. Should this move take place, do remember that 0.75 is also likely to be of interest to buyers given the ABCD approach.
Today’s data points: RBA Gov. Lowe speaks; US PPI and core PPI m/m; FOMC rate decision, FOMC economic projections and press conference.
USD/JPY:
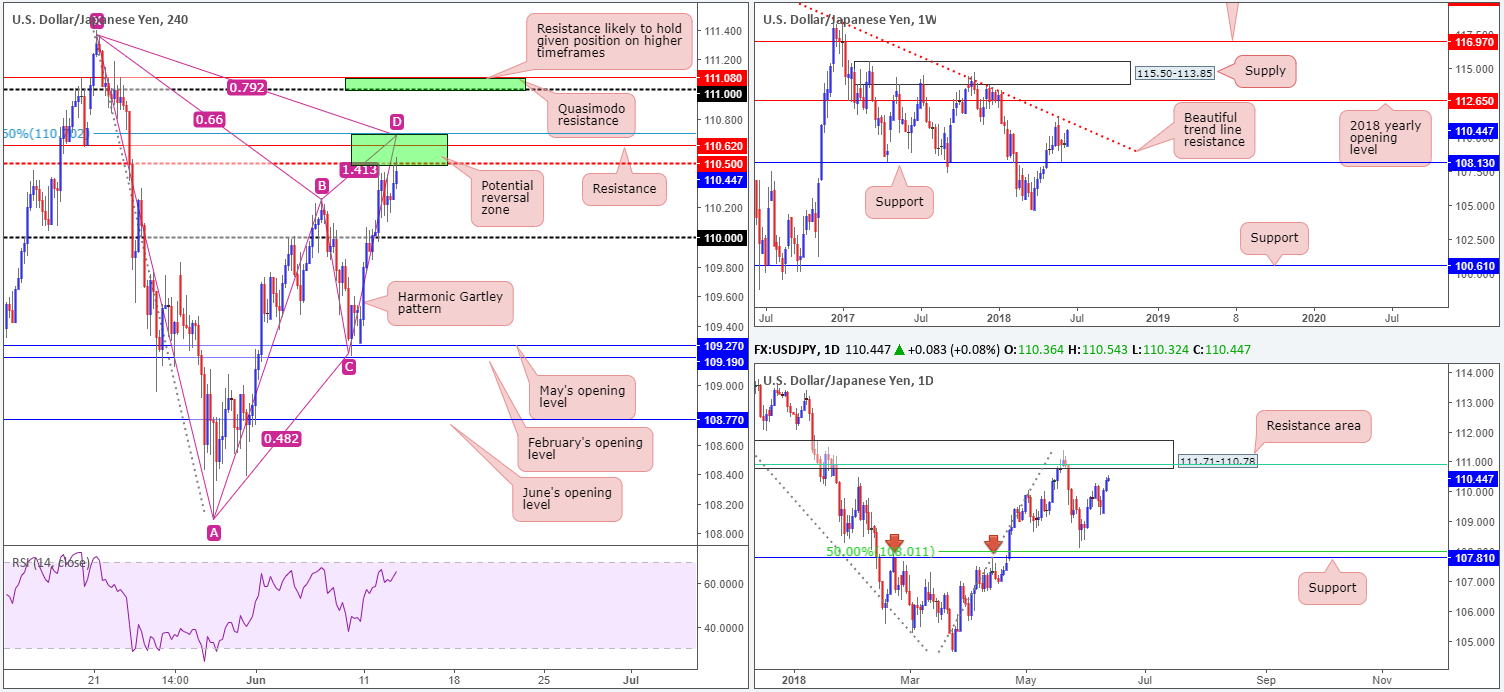
In recent hours, USD/JPY bulls went on the offensive, bringing the H4 candles towards mid-level resistance plotted at 110.50. From a technical perspective, this is a particularly important level. Not only is it positioned nearby a H4 resistance level at 110.62, it also forms part of a H4 harmonic Gartley completion point: 78.6% H4 Fib resistance at 110.70 (lower green zone).
While a large portion of the technical community will be eyeing this pattern completion point, higher-timeframe structure indicates that price action may want to probe higher before turning south. Note that weekly price shows room to punch towards a weekly trend line resistance taken from the high 123.67, as does daily price to a resistance area at 111.71-110.78 that converges not only with the noted weekly trend line, but also a 61.8% daily Fib resistance value at 110.91 (green line).
Areas of consideration:
The H4 harmonic Gartley reversal zone is certainly an area worthy of watching today! The next support target from this region can be found around the 110 neighborhood. Should the area give way (as higher-timeframe structure suggests), however, focus will then be on the 111 handle and nearby H4 Quasimodo resistance at 111.08 (upper green zone). Both levels are seen closely interacting with noted weekly trend line resistance, and are also positioned within the walls of the current daily resistance area.
Irrespective of where one enters short, stop-loss orders are best positioned above the X point of the Gartley harmonic formation (111.40).
Today’s data points: US PPI and core PPI m/m; FOMC rate decision, FOMC economic projections and press conference.
USD/CAD:
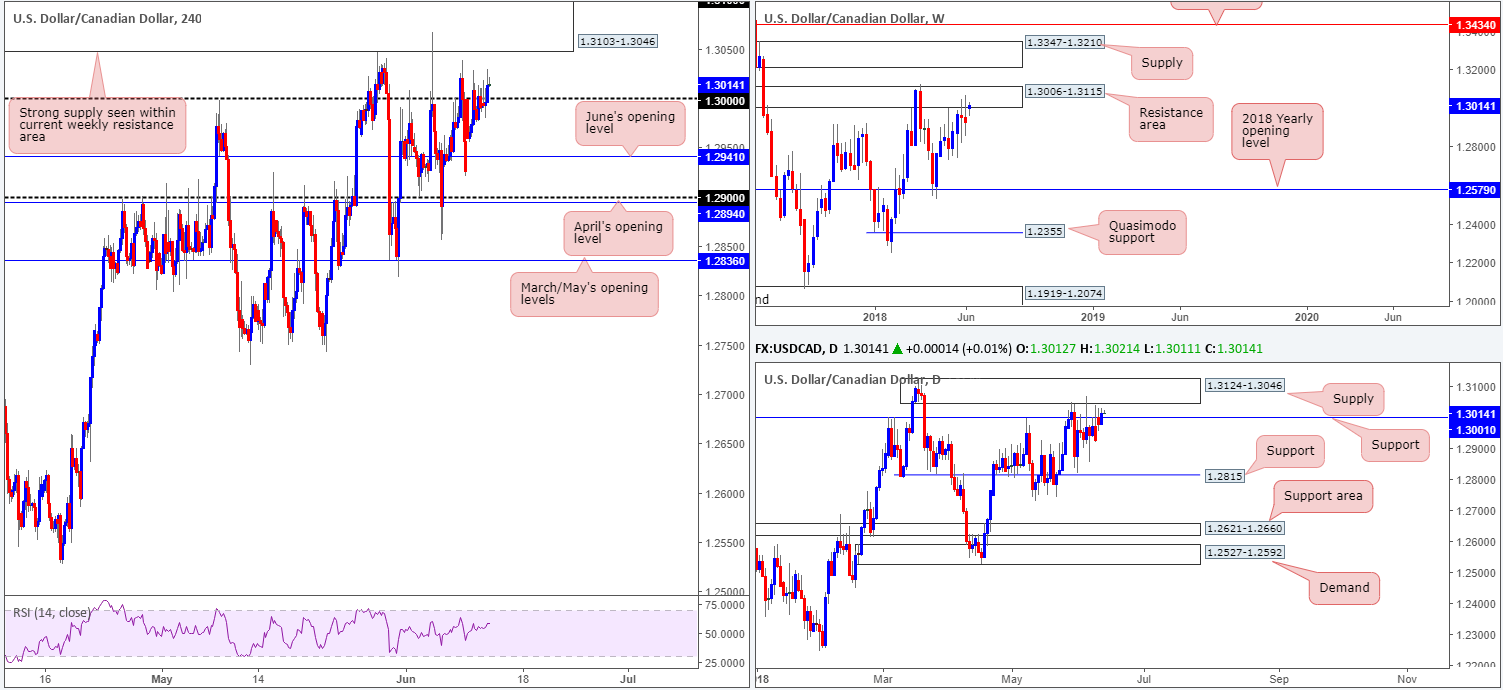
The USD/CAD continued to trade horizontally on Tuesday, more or less trading either side of the key figure 1.30. That was until the WSJ reported that the Fed was considering a press conference after every meeting, which lent strength to the buck and sent the pair marginally above 1.30 into the closing bell. The next port of call above this number on the H4 scale can be seen at 1.3103-1.3046: a H4 supply zone that is seen positioned within the walls of a weekly resistance area at 1.3006-1.3115 and a daily supply zone at 1.3124-1.3046.
Areas of consideration:
Having noted that both weekly and daily price are currently trading at or nearby resistance structure, a selloff could be on the cards. The H4 supply mentioned above at 1.3103-1.3046 is, technically speaking, prime for a short.
As the first area of trouble from this region is seen nearby at 1.30 (also represents daily support), traders will likely be looking for a H4 close below this number before reducing risk to breakeven. Remember, we are selling from higher-timeframe areas here, so downside could stretch beyond H4/daily targets!
Today’s data points: US PPI and core PPI m/m; FOMC rate decision, FOMC economic projections and press conference.
USD/CHF:
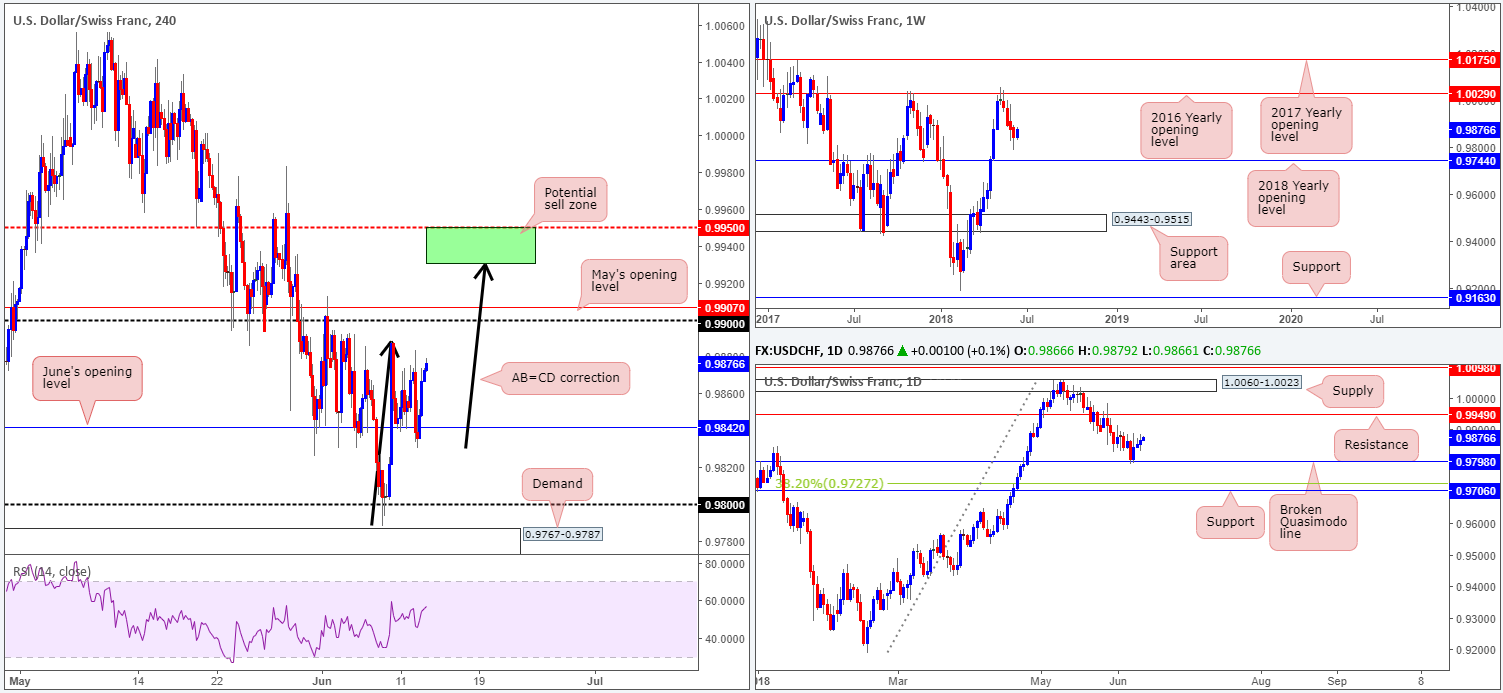
The US dollar is currently seen trading with a reasonably strong upside bias against it Swiss counterpart ahead of today’s FOMC rate decision and meeting. Backed by somewhat upbeat US data and the WSJ reporting that the Fed was considering a press conference after every meeting, the H4 candles responded positively off of June’s opening level on the H4 timeframe at 0.9824. Continued buying from this point will likely see the market work towards a test of the 0.99 handle, which happens to be shadowed closely by May’s opening level coming in at 0.9907. Also worth noting on this scale is the potential AB=CD correction (black arrows) to the upside terminating at around the 0.9930 mark.
The H4 AB=CD formation actually complements the daily timeframe, converging closely with daily resistance plotted at 0.9949. Despite this upside bias, traders will still want to keep in mind where the unit is currently trading on the weekly timeframe, as price appears poised to stretch lower and connect with the 2018 yearly opening level at 0.9744.
Areas of consideration:
Well done to those who managed to jump in long off 0.9842 yesterday, as this was a noted level to watch in Tuesday’s briefing. All eyes should now be on the 0.99 handle as the initial take-profit target.
Areas of interest for sellers today/tomorrow will likely be the 0.99 handle given its connection with May’s opening level. Also, sellers will likely be noting the area marked in green on the H4 timeframe between 0.9950 (essentially representing daily resistance at 0.9949) and the H4 AB=CD correction (black arrows) terminating at around the 0.9930 mark.
Today’s data points: US PPI and core PPI m/m; FOMC rate decision, FOMC economic projections and press conference; CHF PPI m/m.
Dow Jones Industrial Average:
US equities extended Monday’s tight range on Tuesday, as traders seemed uninspired by recent events in Singapore. Focus now shifts from the Trump/Kim summit to today’s FOMC rate decision and press conference with Chairman Powell.
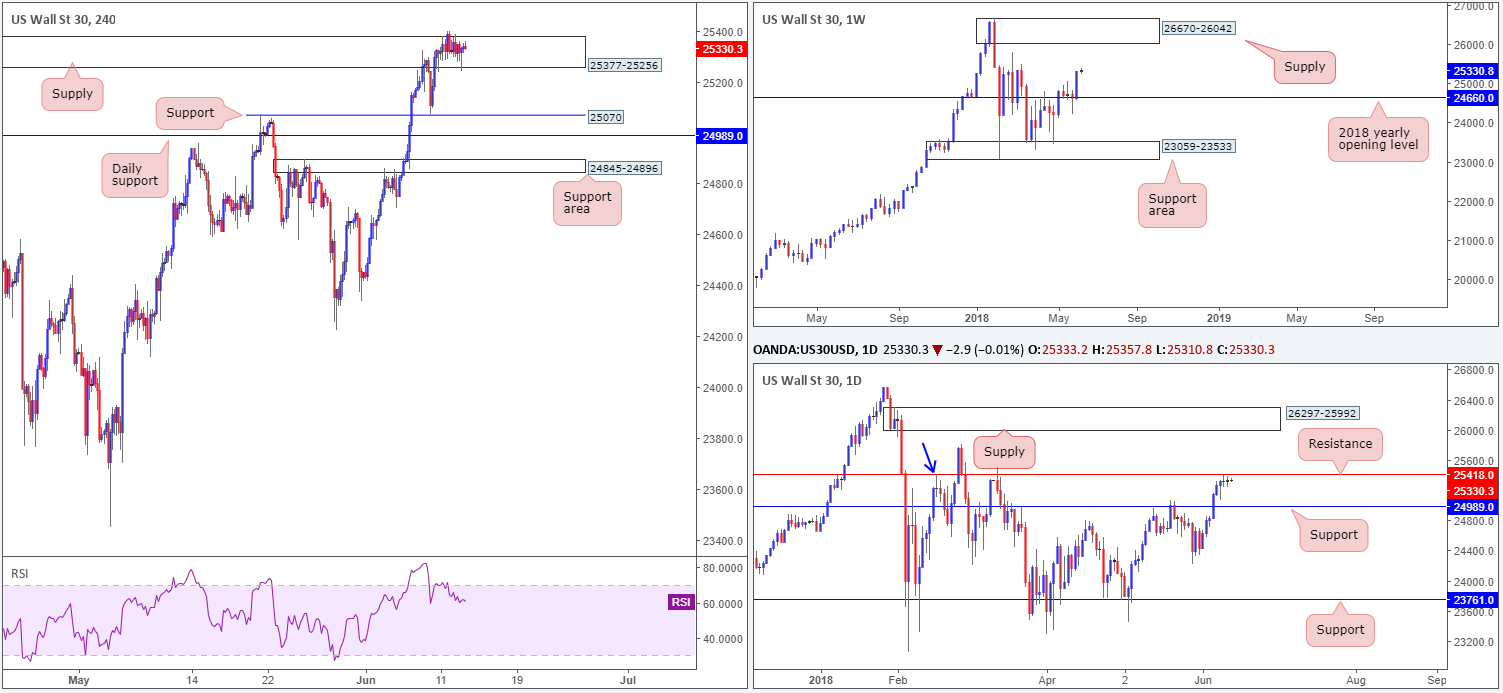
The H4 candles, as you can see, continue to graze the top limit of a H4 supply zone at 25377-25256. Stop-loss orders above the current H4 supply have likely been triggered as a result of Monday’s push to highs of 25398, potentially clearing the pathway north for a test of daily resistance seen nearby at 25418. Do note that this level also represents a Quasimodo resistance taken from the high 25415 (blue arrow). While both H4 and daily structure display possible ceilings, weekly movement shows little resistance ahead until we reach weekly supply drawn from 26670-26042.
Areas of consideration:
While we would agree that the buyers were in fine form last week, we’re still expecting the sellers to make an appearance from the daily resistance level mentioned above at 25418.
For those considering a trade short from the daily level, we strongly recommend waiting and seeing if H4 price can pencil in a full or near-full-bodied bearish candle before pulling the trigger. This is simply because by entering short from here, you may encounter buying pressure from weekly flow!
Today’s data points: US PPI and core PPI m/m; FOMC rate decision, FOMC economic projections and press conference.
XAU/USD (Gold)
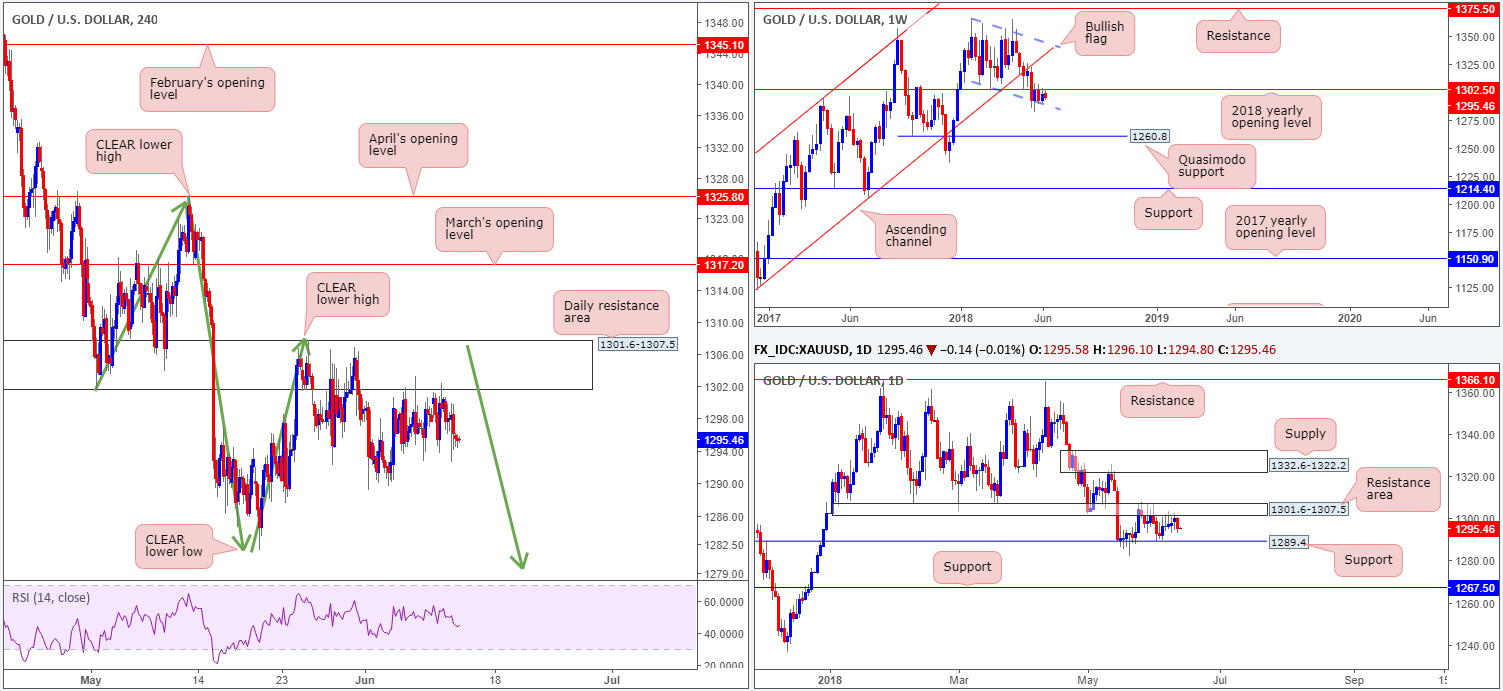
As demonstrated on the H4 timeframe, the daily resistance area at 1301.6-1307.5 continues to cap upside in this market, supporting a week-long H4 consolidation between 1301.0/1294.0. Despite this, the team remains supportive of a lower low taking place on the H4 scale (a break of the swing low 1285.8). As mentioned in several reports prior, this expectation will only be discounted on a H4 close above the clear lower high seen on the H4 timeframe at 1307.7.
Turning the focus over to the bigger picture, the price of gold remains tightly confined between the 2018 yearly opening level on the weekly timeframe at 1302.5 and the lower edge of a weekly bullish flag formation taken from the low 1346.1. A break lower may set the stage for a test of 1260.8: a weekly Quasimodo support, whereas a move above 1302.5 may see weekly price head for the opposite end of the current weekly flag extended from the high 1366.0.
Moving down to the daily timeframe, we are able to see that price action remains sandwiched between the aforementioned daily resistance area and a daily support level drawn in from 1289.4. Beyond this area, surrounding structures are seen at daily supply penciled in from 1332.6-1322.2, and daily support at 1267.5.
Areas of consideration:
As the expectation is for a lower low to form on the H4 timeframe, we still feel shorts at current price are worthy of consideration, with stop-loss orders placed above the clear lower high on the H4 timeframe at 1307.7. Reducing risk to breakeven and taking partial profits off the table on a test of lows at 1281.8 is recommended.
The use of the site is agreement that the site is for informational and educational purposes only and does not constitute advice in any form in the furtherance of any trade or trading decisions.
The accuracy, completeness and timeliness of the information contained on this site cannot be guaranteed. IC Markets does not warranty, guarantee or make any representations, or assume any liability with regard to financial results based on the use of the information in the site.
News, views, opinions, recommendations and other information obtained from sources outside of www.icmarkets.com.au, used in this site are believed to be reliable, but we cannot guarantee their accuracy or completeness. All such information is subject to change at any time without notice. IC Markets assumes no responsibility for the content of any linked site. The fact that such links may exist does not indicate approval or endorsement of any material contained on any linked site.
IC Markets is not liable for any harm caused by the transmission, through accessing the services or information on this site, of a computer virus, or other computer code or programming device that might be used to access, delete, damage, disable, disrupt or otherwise impede in any manner, the operation of the site or of any user’s software, hardware, data or property.


