
Key risk events today:
RBNZ Official Cash Rate, Monetary Policy Statement, Rate Statement and Press Conference; UK Prelim GDP q/q; UK GDP m/m; US CPI m/m and Core CPI m/m; Crude Oil Inventories.
(Previous analysis as well as outside sources – italics).
EUR/USD:
For those who read Tuesday’s technical briefing you may recall the following (italics):
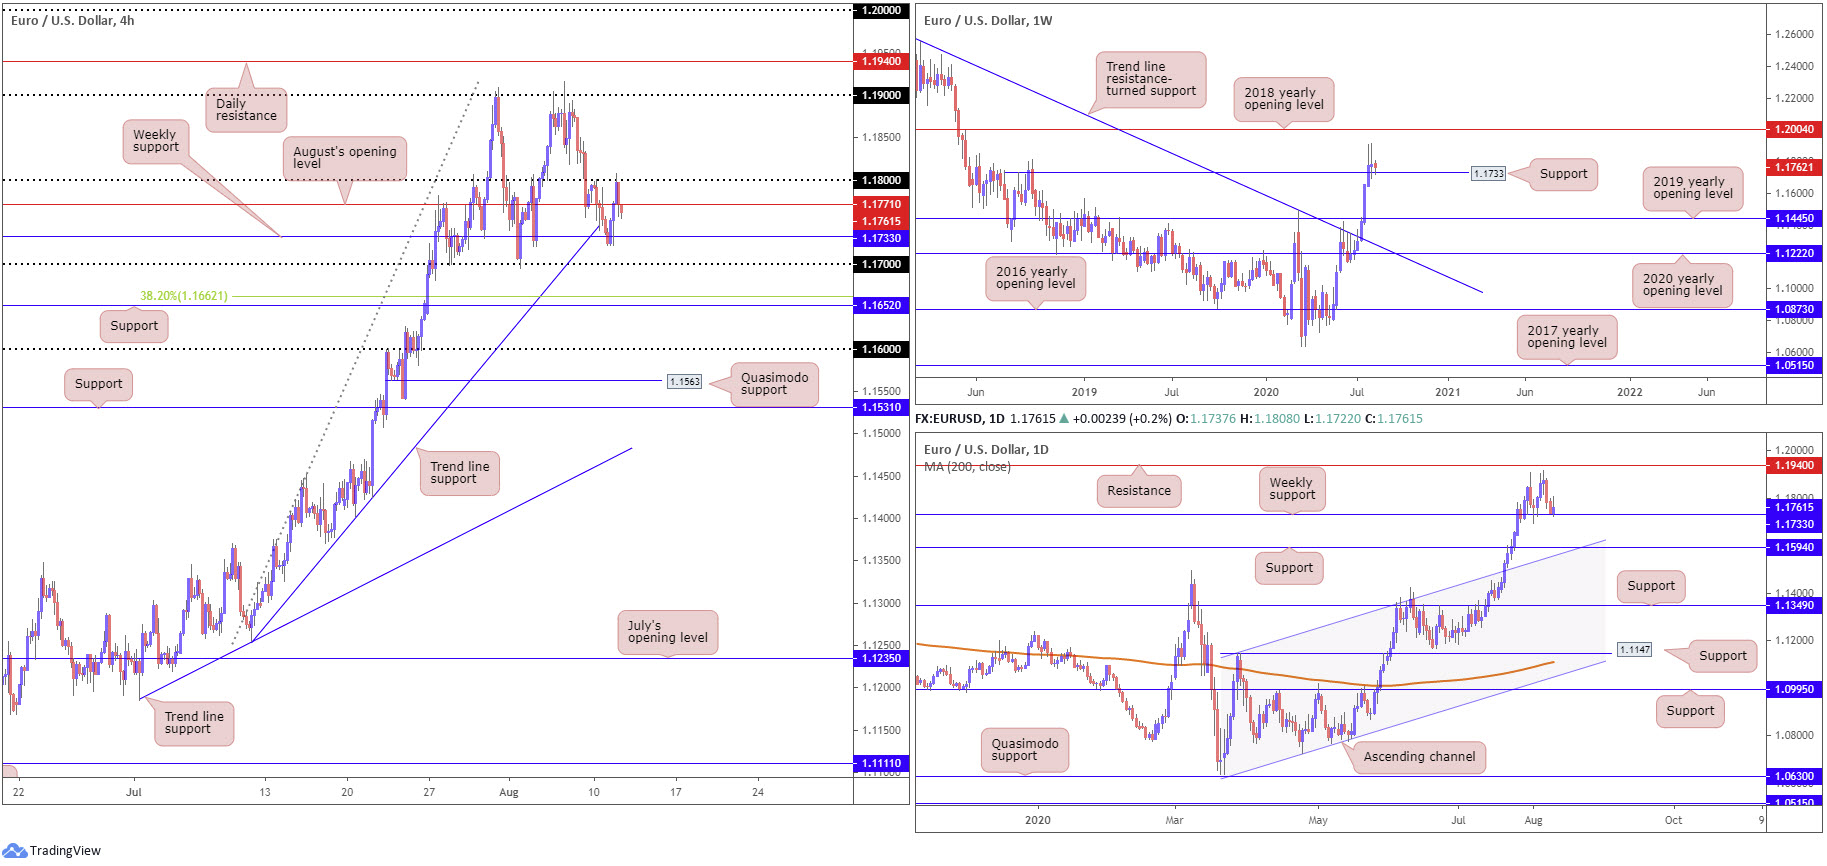
1.1733 weekly support is likely a watched level, particularly for buyers at the point it converges with H4 trend line support, drawn from the low 1.1254. A reaction from this point, one that moves price above August’s opening level at 1.1771 and 1.18, could strive to reach at least 1.19, with the possibility of stirring daily resistance at 1.1940 and even weekly resistance at 1.2004.
Tuesday, as anticipated, responded to 1.1733 weekly support, with the help of H4 trend line support, etched from the low 1.1254. From here we ran through August’s opening level at 1.1771 and shook hands with the 1.18 handle. Unfortunately, given the DXY traded considerably off worst levels, we failed to make it past 1.18 and pulled back under August’s opening level at 1.1771.
Price action based on the weekly timeframe shows we recently struck a fresh 27-month peak at 1.1916. North of 1.1733, the 2018 yearly opening level at 1.2004 is seen as the next available resistance, whereas a dip to deeper water could have the pair shake hands with the 2019 yearly opening level at 1.1445.
A closer reading of price action on the daily timeframe also shows the weekly level at 1.1733 as a base for support. Resistance on the daily chart, however, can be seen parked at 1.1940, with a break largely exposing weekly resistance mentioned above at 1.2004 (2018 yearly opening level). Beyond 1.1733 (on the daily chart) could draw attention to daily support at 1.1594, a level closely connected with channel resistance-turned support, taken from the high 1.1147.
Areas of consideration:
The break of weekly trend line resistance (July 13), taken from the high 1.2555, and violation of the 1.1495 March 9 high, reflects a long-term (potential) technical trend change.
Despite the pullback from 1.18, buyers still hold a strong hand in this fight, in light of the weekly timeframe’s technical position. Therefore, either an additional 1.1733 retest is likely in store, or a H4 close may take shape north of 1.18, both of which could be interpreted as a bullish signal, targeting at least 1.19, then daily resistance at 1.1940 and possibly weekly resistance at 1.2004.
GBP/USD:
It was another relatively tame session for GBP/USD Tuesday, as UK job’s data failed to stimulate much of a response.
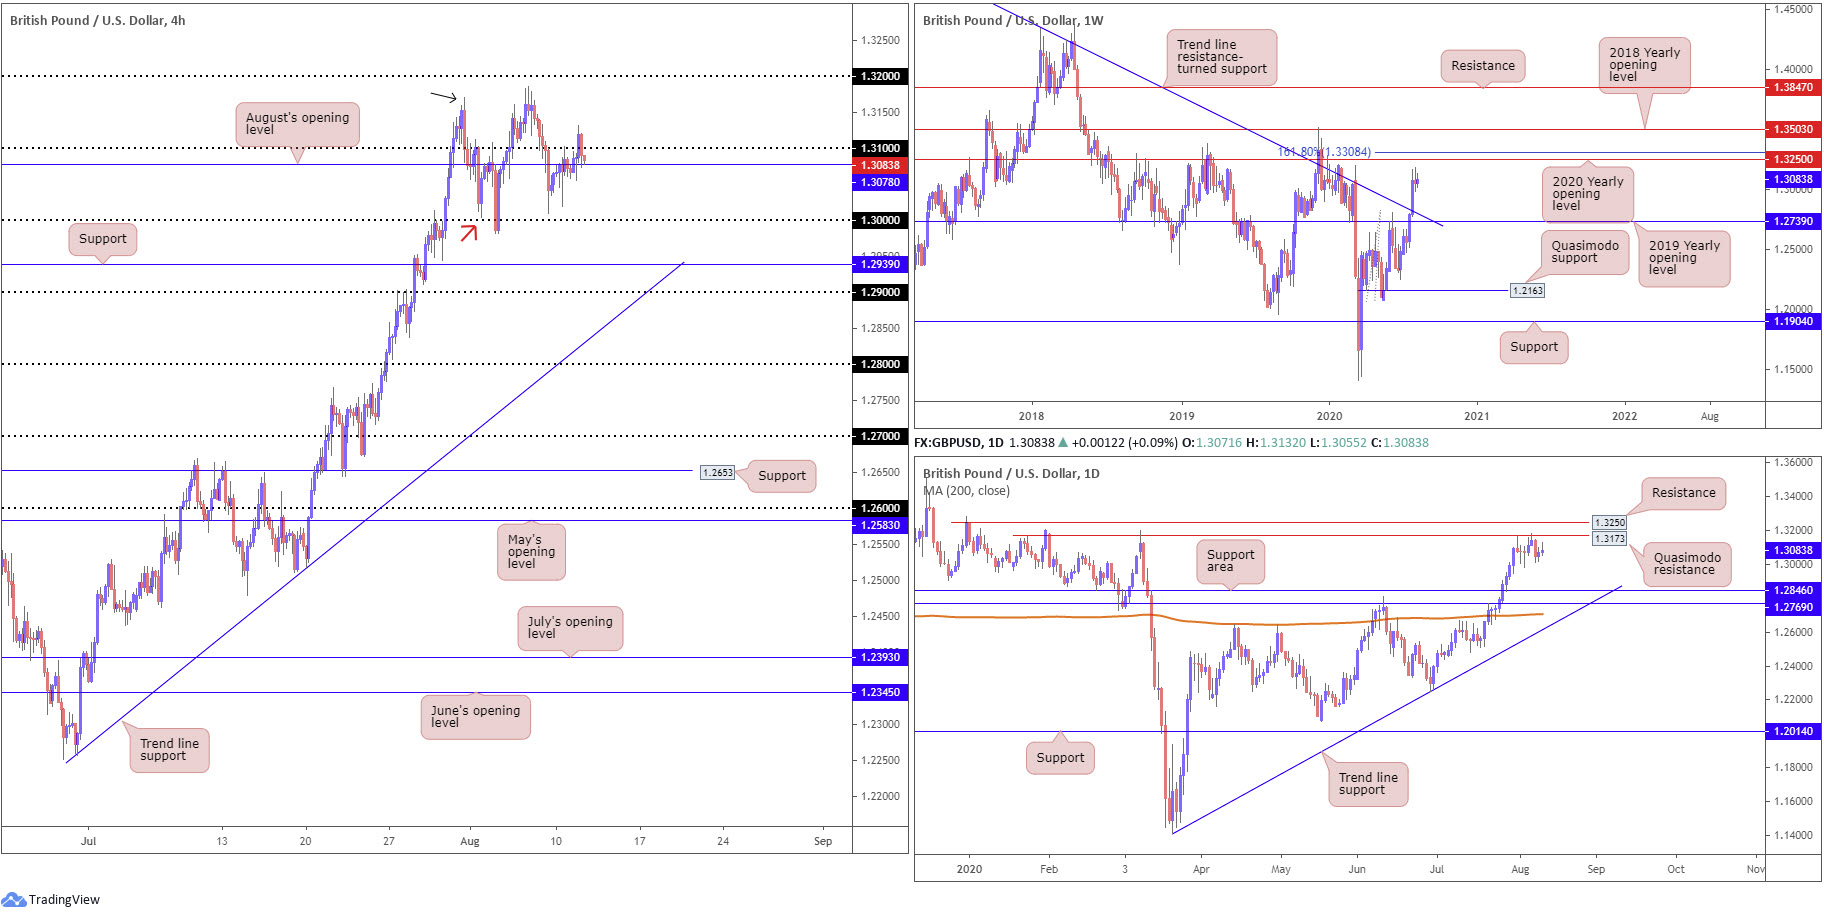
Buy-stop liquidity north of 1.31 was filled during London hours on the H4, as the unit tested peaks at 1.3132. In the shape of a two-candle fakeout, however, price is currently seen trading under the aforementioned round number and touching gloves with August’s opening level at 1.3078.
Turning lower and overrunning 1.3078 today swings the key figure 1.30 back into the frame, a level boasting a connection with a Quasimodo support left shoulder (red arrow – 1.3004). Beyond here, traders’ crosshairs are likely fixed on support listed at 1.2939 and then the 1.29 handle. Above 1.31, traders may be watching the left shoulder (black arrow) at 1.3170 to provide resistance, though most will be eyeing 1.32.
The recent trend line resistance break on the weekly timeframe (1.5930), despite the 1.3514 December 9 high (2019) still intact (a break of here also signals trend change to the upside), may have long-term traders consider bullish positions. After powering through the said trend line resistance, scope to reach higher terrain is visible on the weekly timeframe, despite last week trading somewhat subdued. Resistance can be seen by way of the 2020 yearly opening level at 1.3250, closely tailed by a 161.8% Fibonacci extension point at 1.3308. Leaving said resistances unchallenged and retreating south could call for a retest at the 2019 yearly opening level drawn from 1.2739 (dovetails closely with the recently broken trend line).
Daily Quasimodo resistance at 1.3173 entered the fold last week, a level situated south of 1.3250 daily resistance. Interestingly, the latter shares the same space with resistance on the weekly timeframe, the 2020 yearly opening level. An extension to the downside may have a support area between 1.2769/1.2846 nudge its way into focus, positioned ahead of the 200-day SMA (orange – 1.2706) and trend line support, taken from the low 1.1409.
Areas of consideration:
Owing to the lacklustre performance Tuesday, the outlook going forward remains unchanged.
Although weekly price indicates a shift to 1.3250ish, daily action remains capped by Quasimodo resistance at 1.3173, threatening moves as far south as 1.2769/1.2846.
Against the backdrop of higher timeframe activity, the 1.30 figure on the H4 timeframe presents robust support to keep a tab on, knowing the level joins with Quasimodo support at 1.3004. Consequently, buyers could make a stand from this region and attempt a recovery.
A more decisive breakout north of 1.31 will equally likely arouse the interest of buyers, particularly those favouring breakout strategies. Upside targets fall in at daily resistance from 1.3173, followed by 1.32 on the H4.
AUD/USD:
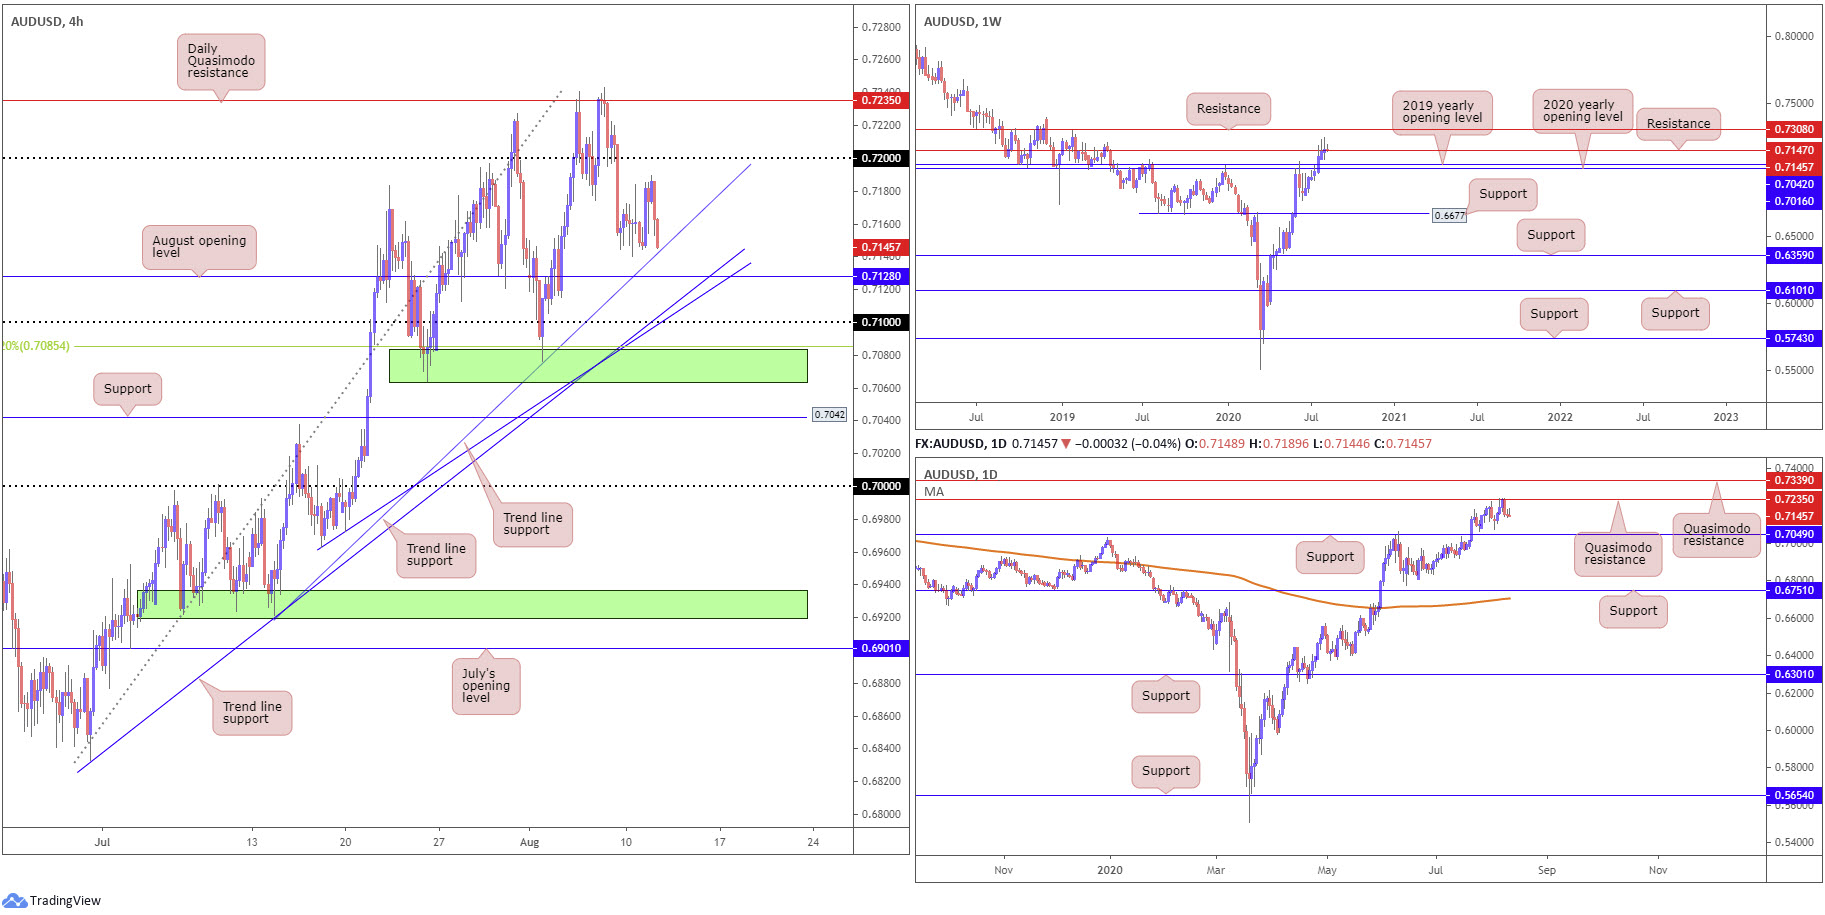
Tuesday concluded off best levels, shaped in the form of a daily gravestone doji candlestick pattern (this formation likely has no meaning given its position in regards to structure). H4, despite an earnest attempt to regain a bullish position, tumbled to opening values in recent hours, positioning a number of trend line supports in range (0.6832/0.6921/0.6963), as well as support at 0.7128 and the 0.71 handle. A neighbouring support area (upper green) can also be seen between 0.7063-0.7083, merging closely with a 38.2% Fibonacci retracement ratio at 0.7085.
Buyers and sellers continue to battle for position around weekly resistance at 0.7147, consequently ending recent trade considerably off best levels. As a result, upside momentum has been diminishing in recent weeks, underscoring the possibility of a retreat to the 2020 and 2019 yearly opening levels at 0.7016 and 0.7042, respectively. Conversely, assuming 0.7147 snaps, resistance at 0.7308 is likely to make an appearance this week.
Quasimodo resistance at 0.7235 on the daily timeframe, as you can see, impacted price movement Friday, snapping a three-day bullish phase. This, despite early trade this week putting up little to get excited about, swings support back into the frame at 0.7049. Though given the current uptrend (present since March), prudent traders will also acknowledge the likelihood of reaching higher and perhaps testing Quasimodo resistance at 0.7339.
Areas of consideration:
Waning momentum seen on the weekly timeframe, together with Friday sinking from Quasimodo resistance at 0.7235 on the daily timeframe, suggests a test of the three H4 trend line supports highlighted above in bold and round number 0.71. It is also possible we draw in the H4 support area noted at 0.7063-0.7083 (and 38.2% Fibonacci support at 0.7085).
It will be at the aforementioned H4 supports traders expect dip-buyers to make a show. Failure to do so, we are then possibly headed for daily support at 0.7049, followed by H4 support at 0.7042 (merges with the 2019 yearly opening level on the weekly timeframe).
USD/JPY:
Recent hours realised a healthy USD/JPY advance as yield on the 10-year Treasury note climbed more than 12%.
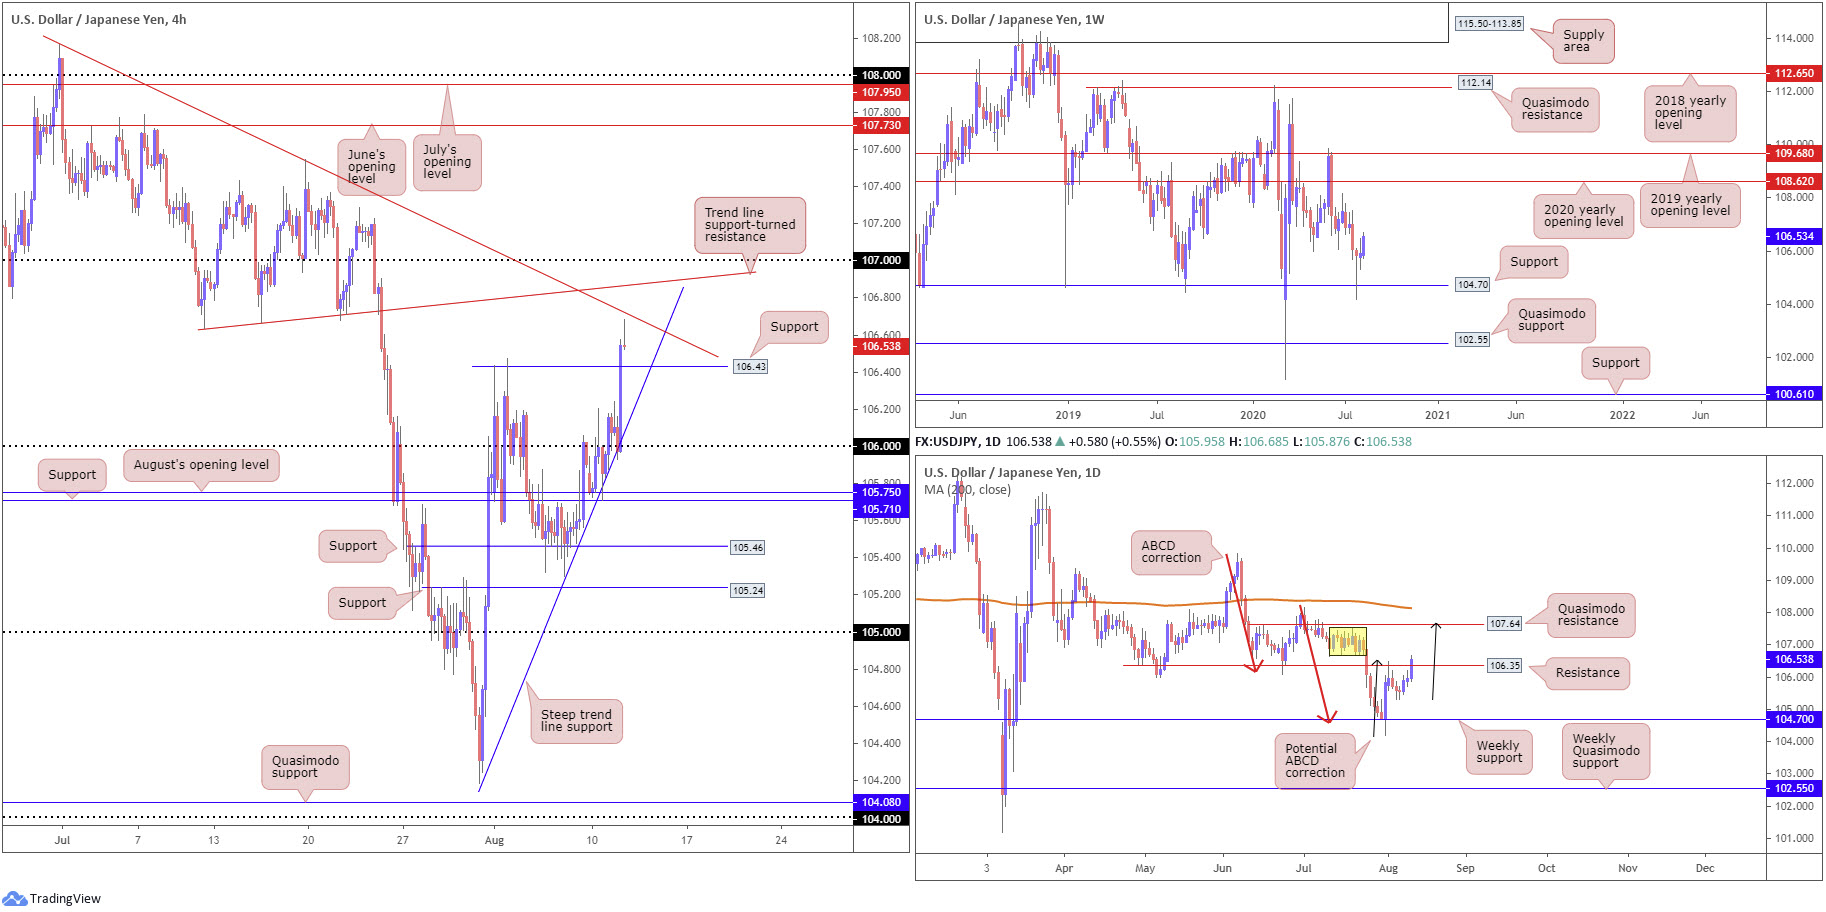
Following a fleeting retest at 106 on the H4 timeframe, price action, in one fell swoop, run through Quasimodo resistance at 106.43 (now an observed support), consequently placing trend line resistance, extended from the high 108.16, in view, followed by another trend line support-turned resistance, taken from the low 106.63, and then the 107 handle.
Longer-term traders appear to finally be responding to the recent hammer pattern on the weekly timeframe, established off support at 104.70. By and of itself, this is a strong bullish signal, with obvious upside targets resting as far north as the 2020 yearly opening level from 108.62 and the 2019 yearly opening level at 109.68.
The daily timeframe shows price action eagerly made its way above resistance at 106.35 (a prior Quasimodo support) yesterday. Ousting 106.35 was high probability (as pointed out in recent analysis), not only because of where the unit trades from on the weekly timeframe, but also due to the lacklustre (bearish) response from 106.35. Above the latter, we now have supply to contend with at 107.54-106.67 (yellow), as well as Quasimodo resistance coming in at 107.64. Also worth acknowledging is the prospect of establishing an ABCD bearish correction (black arrows) that conveniently terminates around 107.64.
Areas of consideration:
Governed by the weekly timeframe rebounding from support at 104.70 and establishing a bullish candlestick signal, longer-term analysis suggests the possibility of additional gains materialising north of resistance at 106.35 on the daily timeframe.
In recent analysis, research pointed out two possible bullish scenarios:
- A retest at 105.71, a move which may interest dip-buyers.
- A breakout above 106, consequently attracting breakout strategies.
As evident from the H4 chart this morning, both setups recently came into force.
Going forward, a retest at 106.43 support could be seen (prior H4 Quasimodo resistance). This, having noted higher timeframes shining the spotlight north, could lure dip-buyers from 106.43, targeting H4 trend line resistances nearby (106.63/108.16).
USD/CAD:
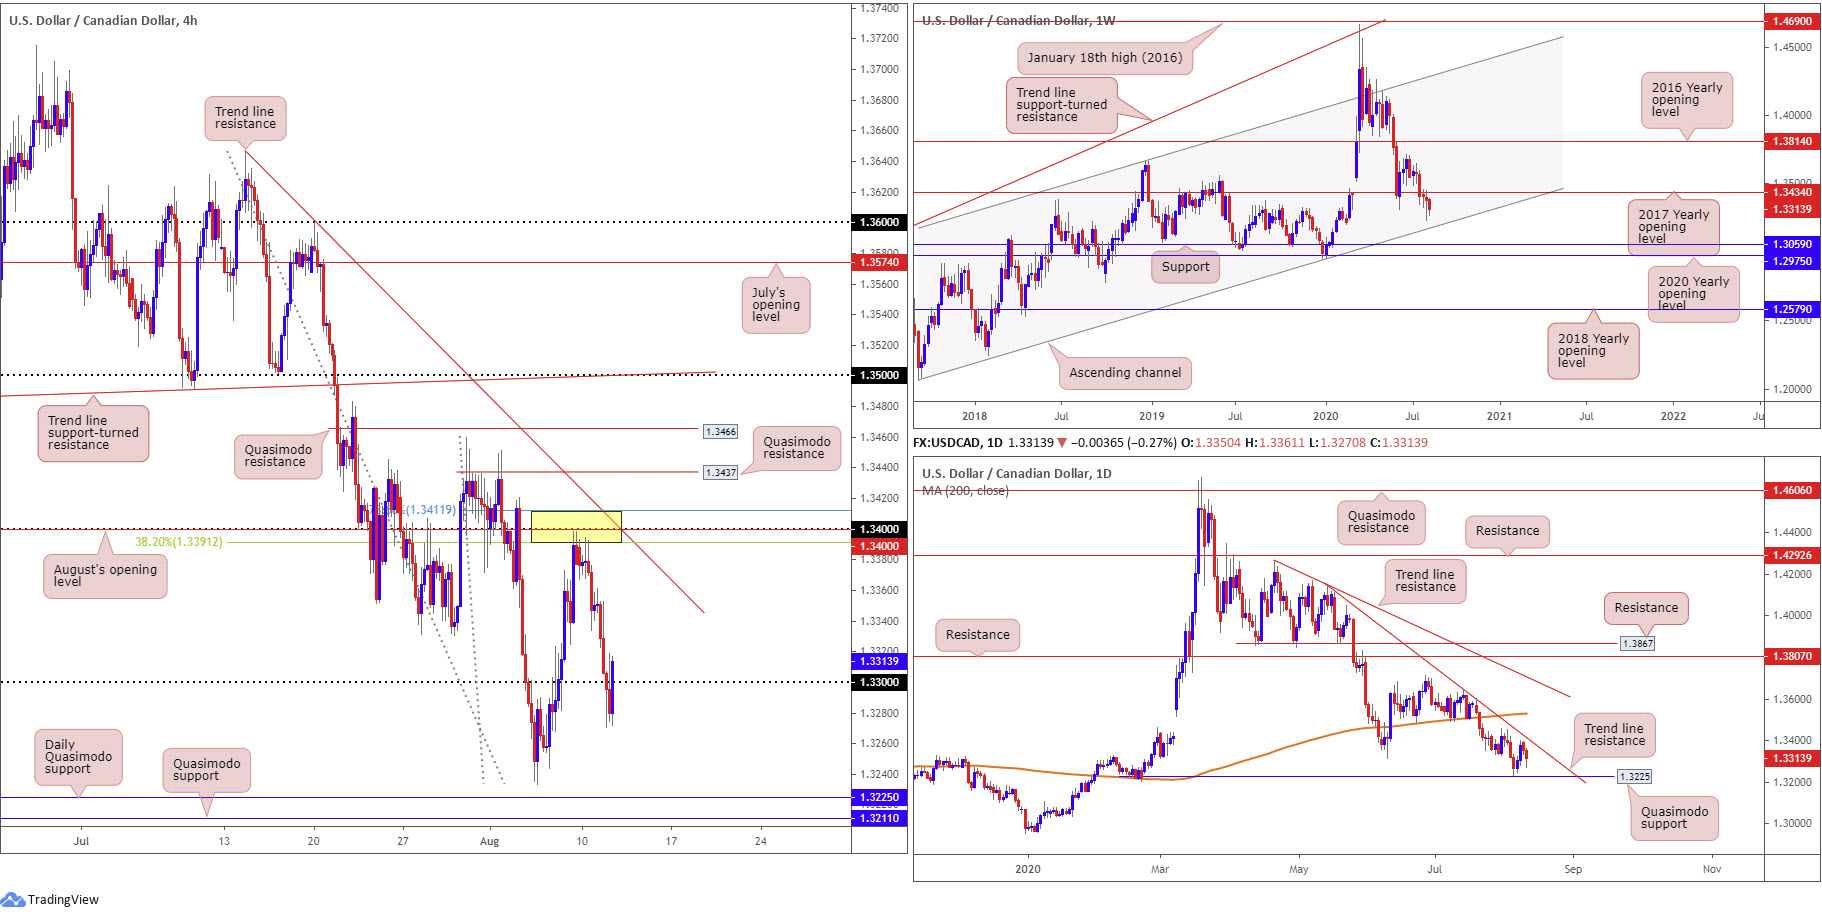
Given recent analysis pointing to the possibility of a retreat forming from 1.3412/1.3391 (see below – italics), we have since plunged more than 100 pips.
USD/CAD extended north of the 1.33 handle and bumped heads with an interesting area of resistance (yellow) between 1.3412/1.3391, made up of a 78.6% Fibonacci retracement ratio at 1.3412, the 1.34 handle and the 38.2% Fibonacci retracement ratio at 1.3391. A bearish response from the H4 resistance area at 1.3412/1.3391 is a possibility early week, owing to the confluence the zone brings to the table.
Price action on the H4 timeframe, as you can see, nosedived through 1.33 and filled sell-stop liquidity Tuesday. Recent moves, however, did make a comeback and reclaimed 1.33+ status as WTI prices closed off best levels.
July 22 witnessed a break of the 2017 yearly opening level at 1.3434 on the weekly timeframe, signalling channel support, taken from the low 1.2061, could enter the fight.
Heading into the second half of last week, daily price also turned ahead of Quasimodo support at 1.3225 and extended recovery gains into the close. Should we take the pair above the 2017 yearly opening level at 1.3434, and cross above daily trend line resistance, taken from the high 1.4140, the 200-day SMA (orange – 1.3529) could surface as potential resistance.
Areas of consideration:
Current short positions out of 1.3412/1.3391 have likely reduced risk to breakeven, with the majority taking partial profits at 1.33. Yet, in view of the higher timeframe position, further declines could be on the cards to daily Quasimodo support at 1.3225.
USD/CHF:
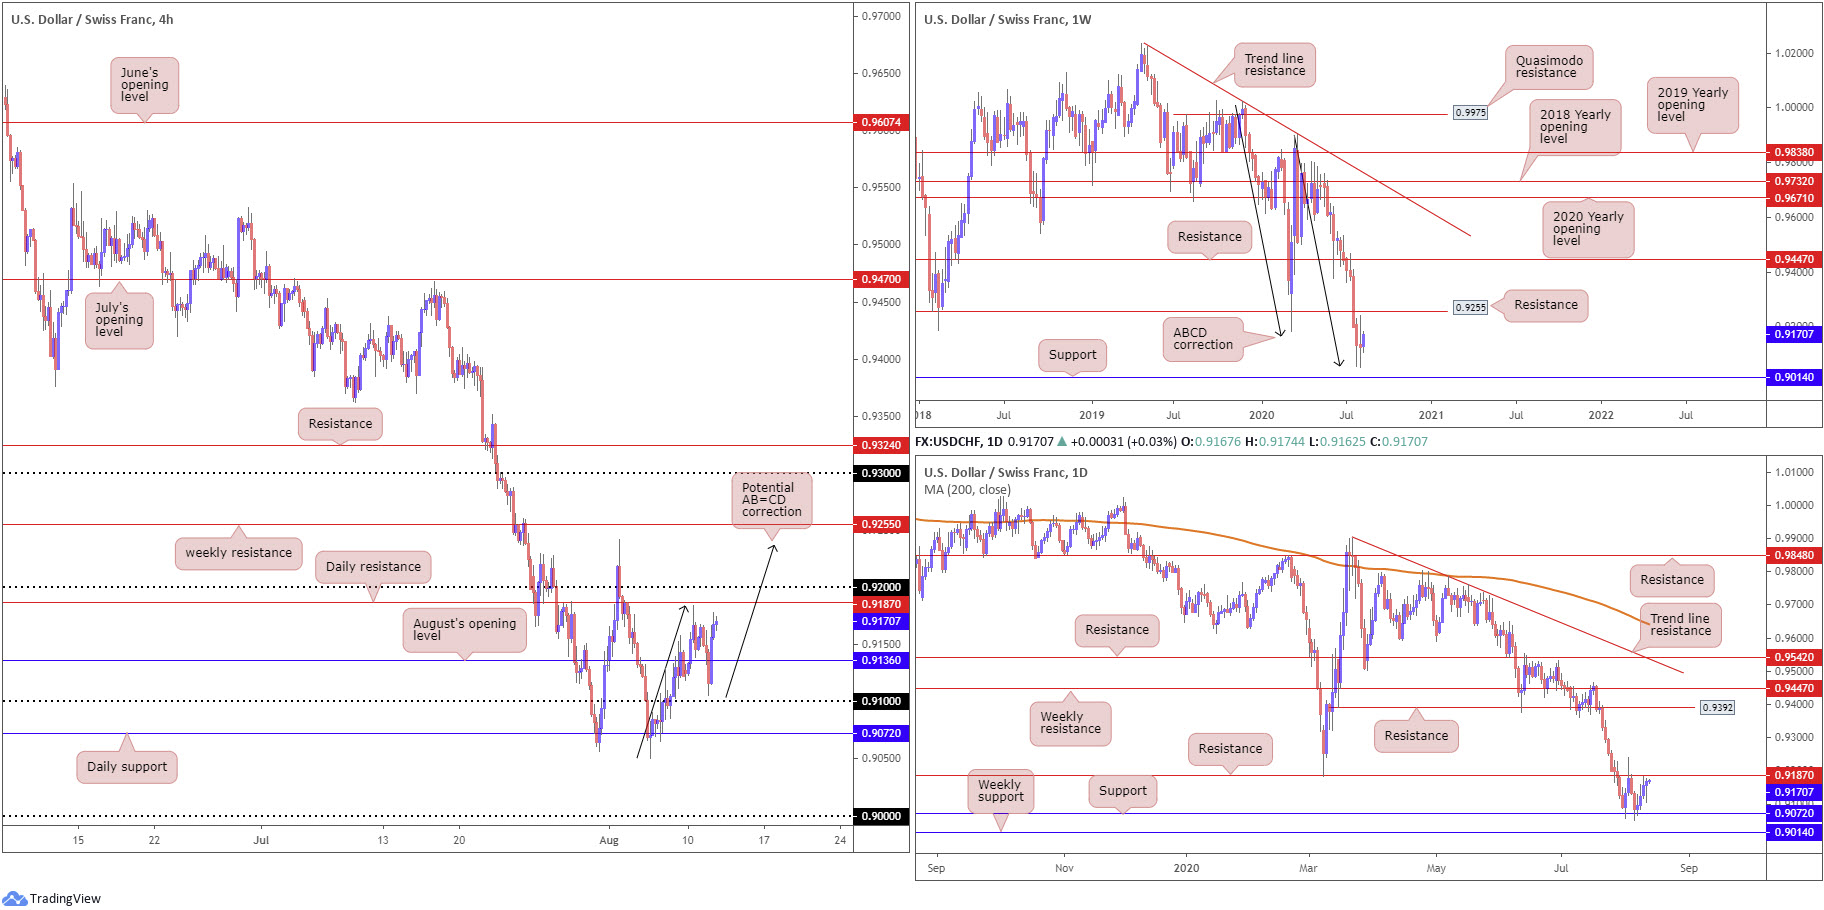
Leaving 0.91 unchallenged on the H4 timeframe, the US dollar entered an offensive phase against the Swiss franc Tuesday, lifting USD/CHF to within striking distance of daily resistance at 0.9187.
Recording a fourth successive advance yesterday, further buying, moves that form north of daily resistance and the 0.92 handle on the H4 timeframe, could have the H4 candles shake hands with a potential AB=CD (black arrows) correction at 0.9237, followed by weekly resistance at 0.9255.
Looking closer at the technical landscape on the weekly timeframe, we can see we recently come off a seven-week decline. Buyers and sellers, however, wrapped up last week’s action hesitantly, forming a long-legged doji candlestick pattern at an ABCD completion point (black arrows) around 0.9051. The doji suggests forces of supply and demand are possibly nearing equilibrium. Therefore, given we’re testing ABCD support, along with additional support present nearby at 0.9014, traders may interpret the recent indecision as a potential change of direction.
Areas of consideration:
While the underlying trend points southbound, weekly price recently crossing swords with an ABCD correction at 0.9051, in the shape of a long-legged doji candlestick pattern, implies additional recovery gains may surface.
Yet, many technically-minded traders will want to observe daily resistance at 0.9187 and the 0.92 handle (H4) taken out before considering bullish strategies, targeting the structures highlighted above in bold.
Dow Jones Industrial Average:
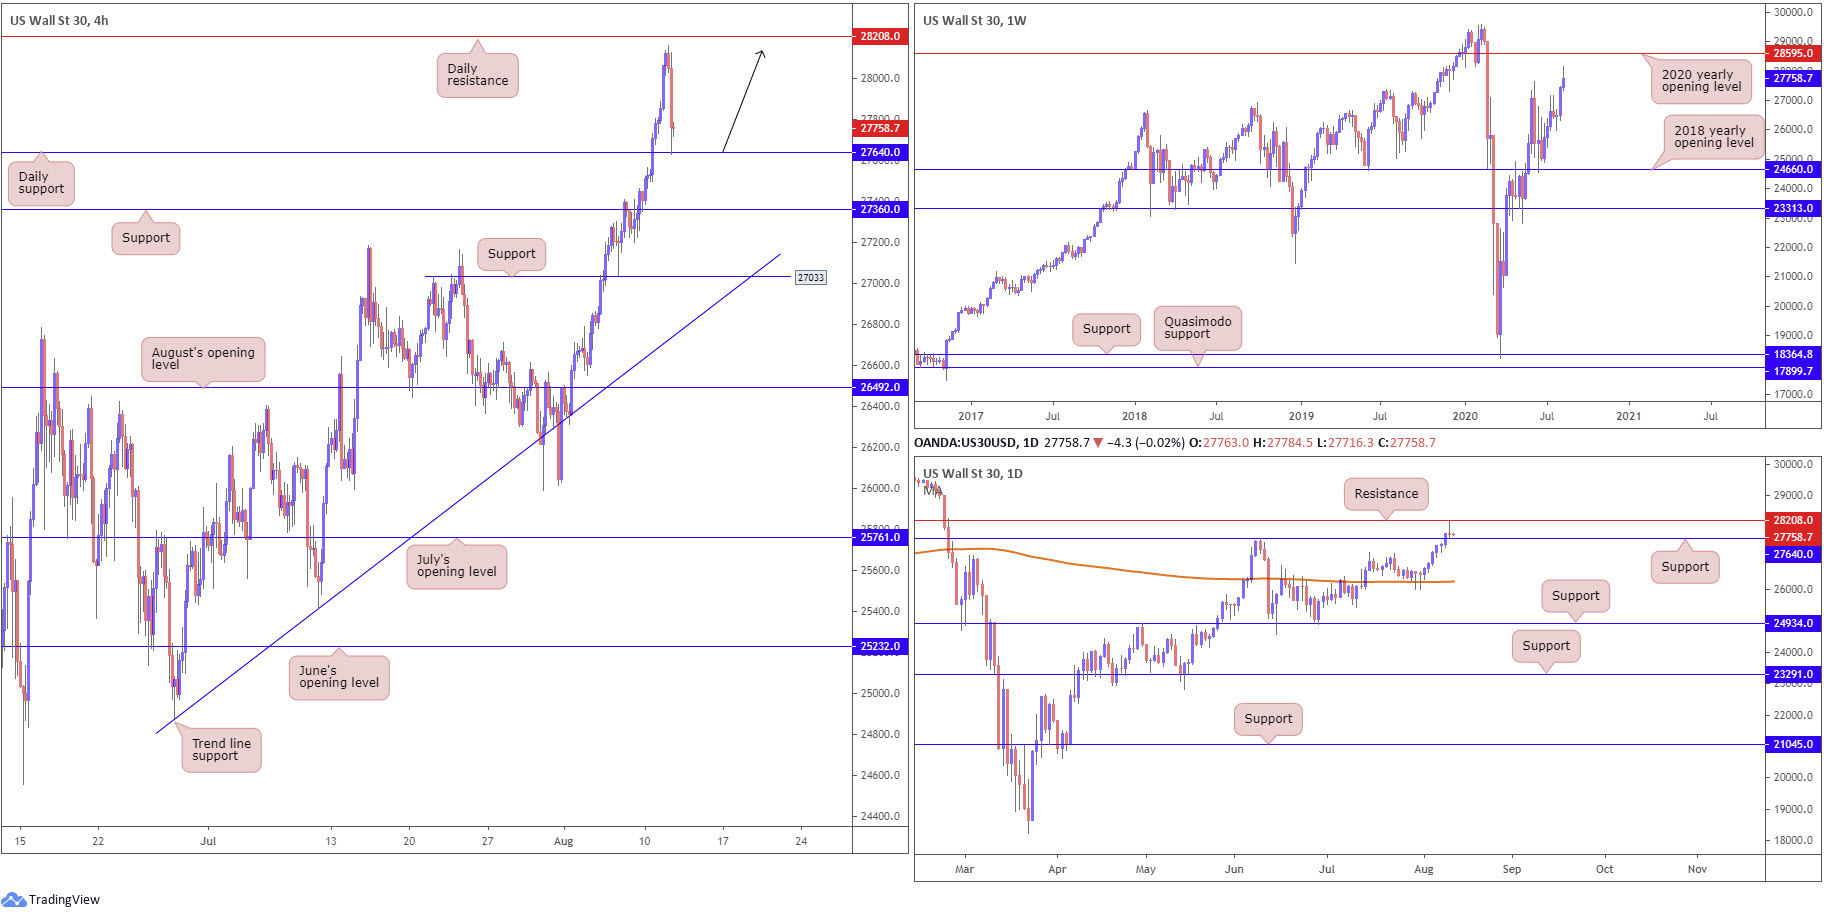
Major US benchmarks slipped lower on Tuesday, weighed by losses in technology stocks. The Dow Jones Industrial Average dropped 104.53 points, or 0.38%; the S&P 500 declined 26.78 points, or 0.80%, while the tech-heavy Nasdaq 100 concluded lower by 209.09 points, or 1.89%.
Technically, from the weekly timeframe, we recently secured ground above the 27638 high, following a mid-June retest at the 2018 yearly opening level from 24660. As we head into Wednesday, the unit is now poised to run to the 2020 yearly opening level at 28595. After retesting the 200-day SMA (orange – 26258) on the daily timeframe, in the form of back-to-back hammer candle patterns, recent trading crossed resistance at 27640 (now a serving support) and came within touching distance of connecting with resistance at 28208.
With H4 action clearly seen retesting daily support at 27640, this could be enough to entice buying, with daily resistance at 28208 set as an initial target.
Areas of consideration:
Concerning buyers coming in from daily support, conservative traders will likely want to see at least a H4 bullish candlestick emerge before committing. In terms of upside targets, beyond daily resistance (28208) we could see weekly resistance make an appearance at 28595.
XAU/USD (GOLD):
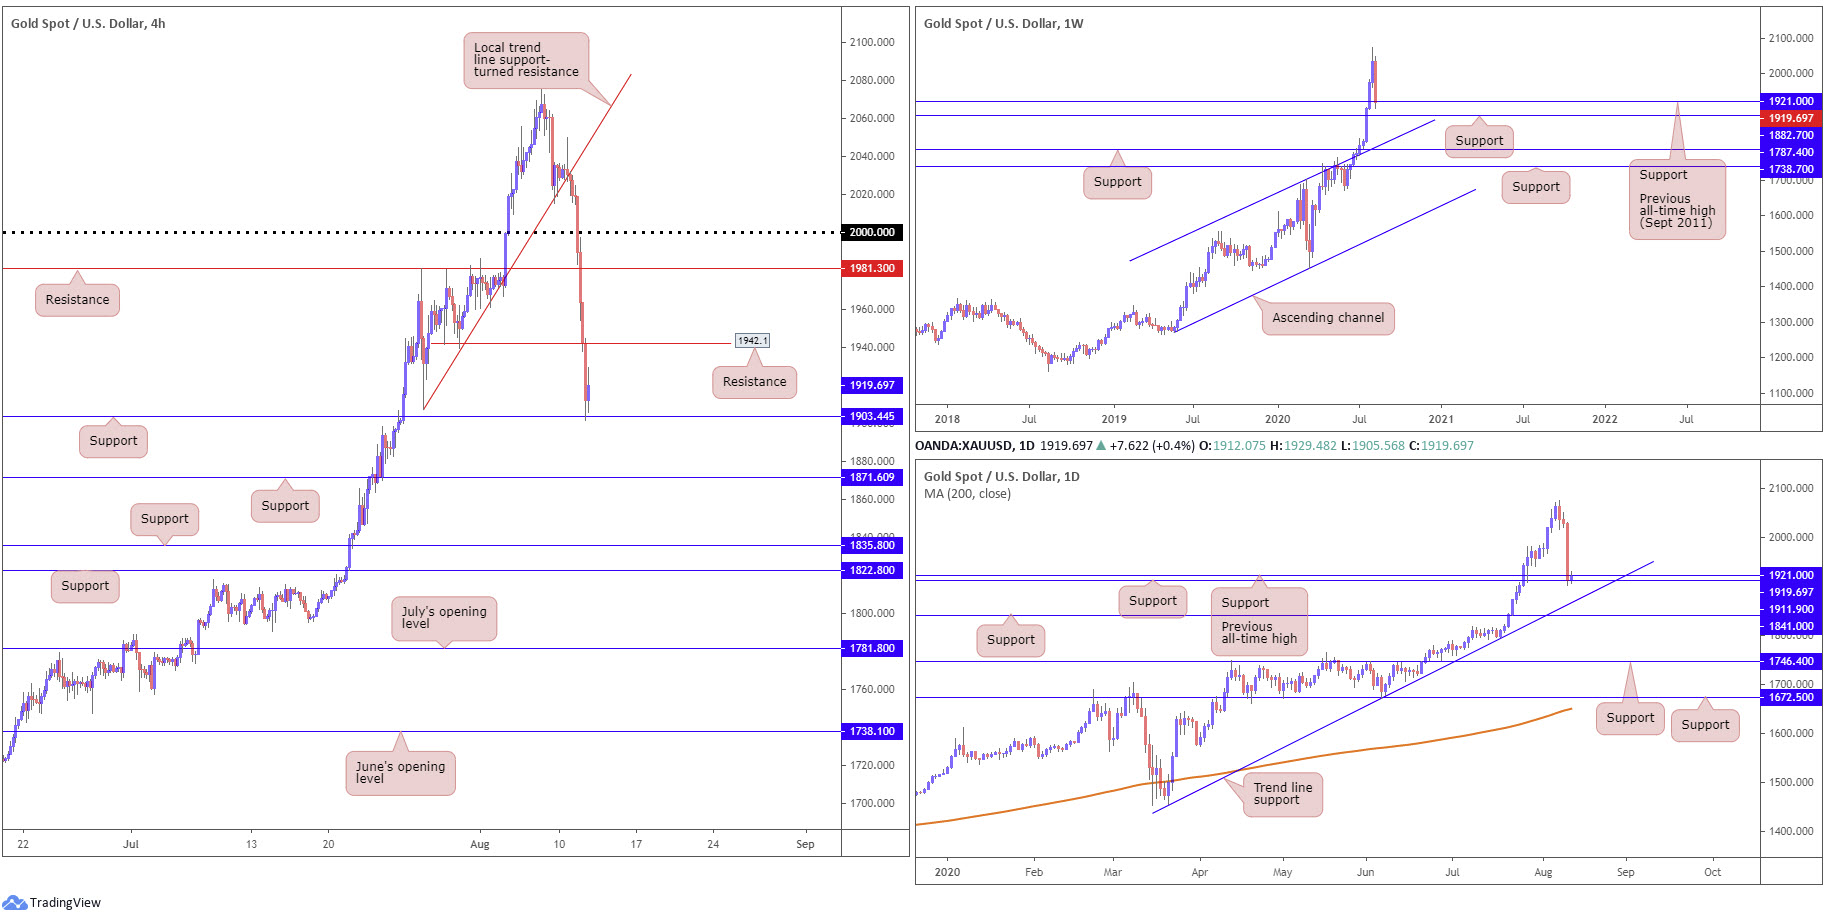
Gold plummeted Tuesday amid decreasing demand for safe-haven assets following positive vaccine news. Ending the day down more than 5.5%, we can see higher timeframe technical action retesting $1,921.00, the previous all-time high (September 2011), as well as daily support coming in at $1,911.90. Joining these levels, we can also see H4 price movement retesting support at $1,903.44. A decisive reaction from the latter could draw in H4 resistance at $1,942.10, a prior Quasimodo support level.
Areas of consideration:
While many stop-loss orders have likely been filled due to the recent plunge, buyers still potentially have a hand in this fight. Not only has the trend in this market faced north since 2016, higher timeframe supports are in motion. As a result, a H4 bullish candlestick signal developing off the H4 support at $1,903.44 today could appeal, targeting $1,942.10 as an initial port of call.
The accuracy, completeness and timeliness of the information contained on this site cannot be guaranteed. IC Markets does not warranty, guarantee or make any representations, or assume any liability regarding financial results based on the use of the information in the site.
News, views, opinions, recommendations and other information obtained from sources outside of www.icmarkets.com.au, used in this site are believed to be reliable, but we cannot guarantee their accuracy or completeness. All such information is subject to change at any time without notice. IC Markets assumes no responsibility for the content of any linked site.
The fact that such links may exist does not indicate approval or endorsement of any material contained on any linked site. IC Markets is not liable for any harm caused by the transmission, through accessing the services or information on this site, of a computer virus, or other computer code or programming device that might be used to access, delete, damage, disable, disrupt or otherwise impede in any manner, the operation of the site or of any user’s software, hardware, data or property.


