
Key risk events today:
UK GDP m/m; UK Manufacturing Production m/m; UK Annual Budget Release; US CPI m/m and Core CPI m/m; Crude Oil Inventories.
(Previous analysis as well as outside sources – italics).
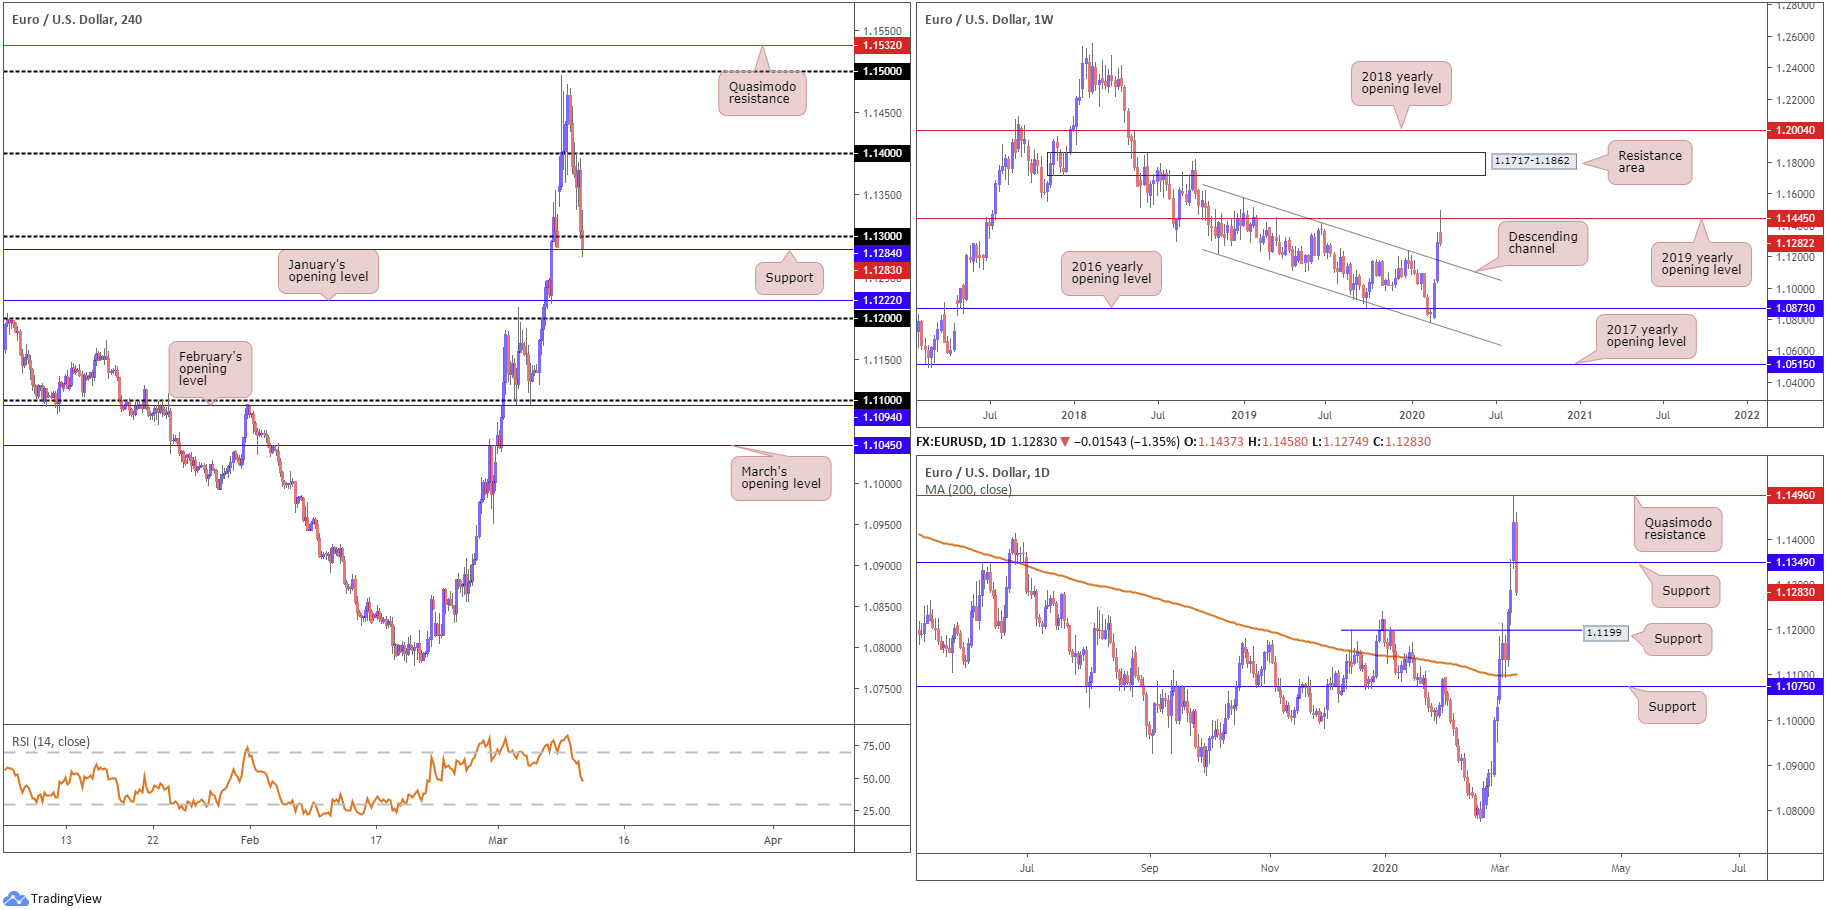
EUR/USD:
Sentiment somewhat steadied Tuesday, prompting a rebound in US Treasury yields and the US dollar index. The DXY reclaimed 96.00 to the upside and is poised to shake hands with 96.50.
EUR/USD, leaving 1.15 unchallenged, dropped through 1.14 in the early hours of trade and retested the latter during London Tuesday. 1.13 made an appearance, and attempted to serve as support, though gave way in recent hours to cross swords with support plotted at 1.1284. The relative strength index (RSI) also crossed 50.00, suggesting further downside could be in store.
The story on the bigger picture has the pair fading the 2019 yearly opening level from 1.1445 on the weekly timeframe – a noted port of resistance, boasting incredibly strong history. This followed last week’s action slicing through long-term weekly channel resistance, extended from the high 1.1569, which may serve as support going forward. With respect to the primary trend, the breakout above the mentioned channel resistance may see the beginning of a long-term trend change take place.
Daily flow came within a point of testing Quasimodo resistance at 1.1496 on Monday, with Tuesday tumbling through support at 1.1349, shaped by way of a near-full-bodied bearish candle. Support is seen reasonably close by at 1.1199, a prior Quasimodo resistance, with a break likely pointing the finger to the 200-day SMA (orange – 1.1101).
Areas of consideration:
Beyond H4 support at 1.1284, traders’ crosshairs are likely fixed on January’s opening level at 1.1222, shadowed closely by 1.12, and then daily support highlighted above at 1.1199. In light of the recent crossing below support at 1.1349 on the daily scale and weekly action fading major resistance, bearish themes south of 1.13 could be an option today. Conservative traders, of course, may wait and see if a retest at 1.13 occurs before committing, strengthening the odds of a favourable trade.
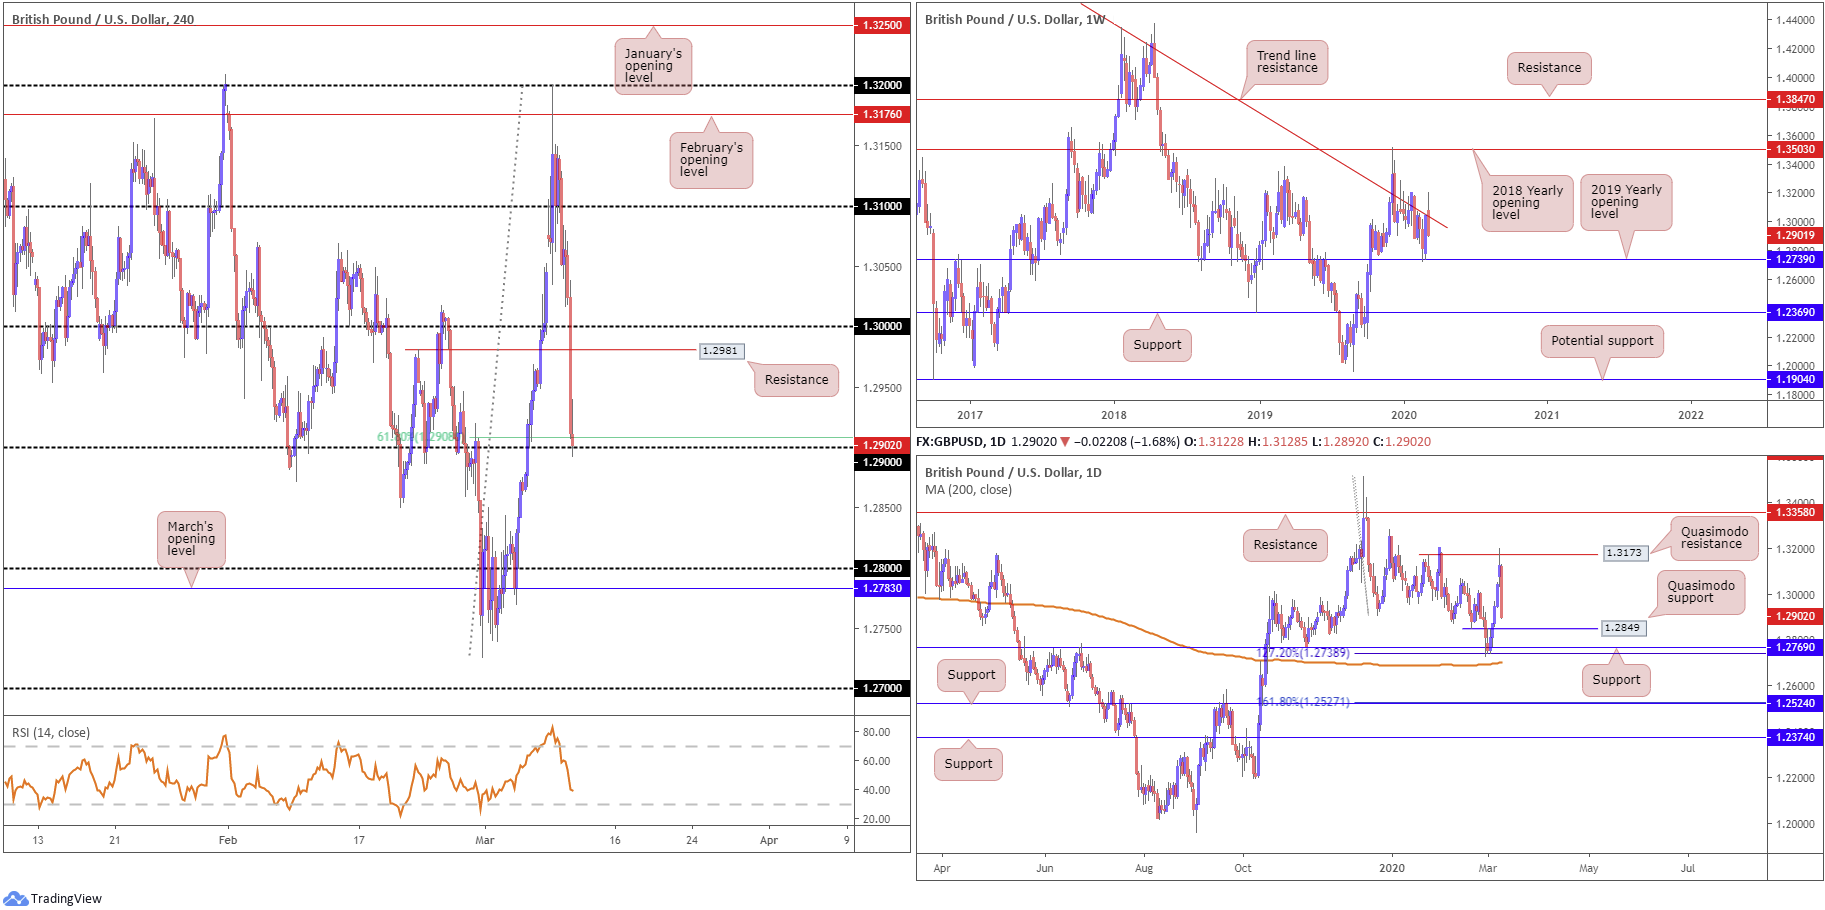
GBP/USD:
Cable extended its withdrawal from 1.32 peaks Tuesday, losing more than 200 points, or 1.60%. Persistent jitters over the prospect of a hard Brexit, and a recovery in the US dollar index, saw a number of key technical supports give way on the H4 scale, including the widely watched 1.30. As evident from the chart, 1.29 recently made its debut as support, reinforced by a 61.8% Fibonacci retracement ratio at 1.2908.
A breach of 1.29 today displays limited support on the H4 timeframe until greeting 1.28, shadowed closely by March’s opening level at 1.2783. Note we also broke through the relative strength index (RSI) 50.00 value. Potentially halting downside south of 1.29, though, is daily Quasimodo support at 1.2849; however, with weekly price nudging below long-standing trend line resistance, pencilled in from the high 1.5930, lower levels may still be favoured. Beneath the aforementioned daily Quasimodo support we can see room to approach support at 1.2769, a 127.2% Fibonacci extension point at 1.2738 and the 200-day SMA (orange – 1.2703), therefore signalling the possibility of moves below 1.28.
Areas of consideration:
Buying off 1.29 is likely brief, despite boasting additional support from the 61.8% Fibonacci retracement. As such. A H4 close below 1.29 is likely to entice sellers. Whether traders enter on the breakout candle or a retest at the latter, the initial take-profit target is set at 1.2849.
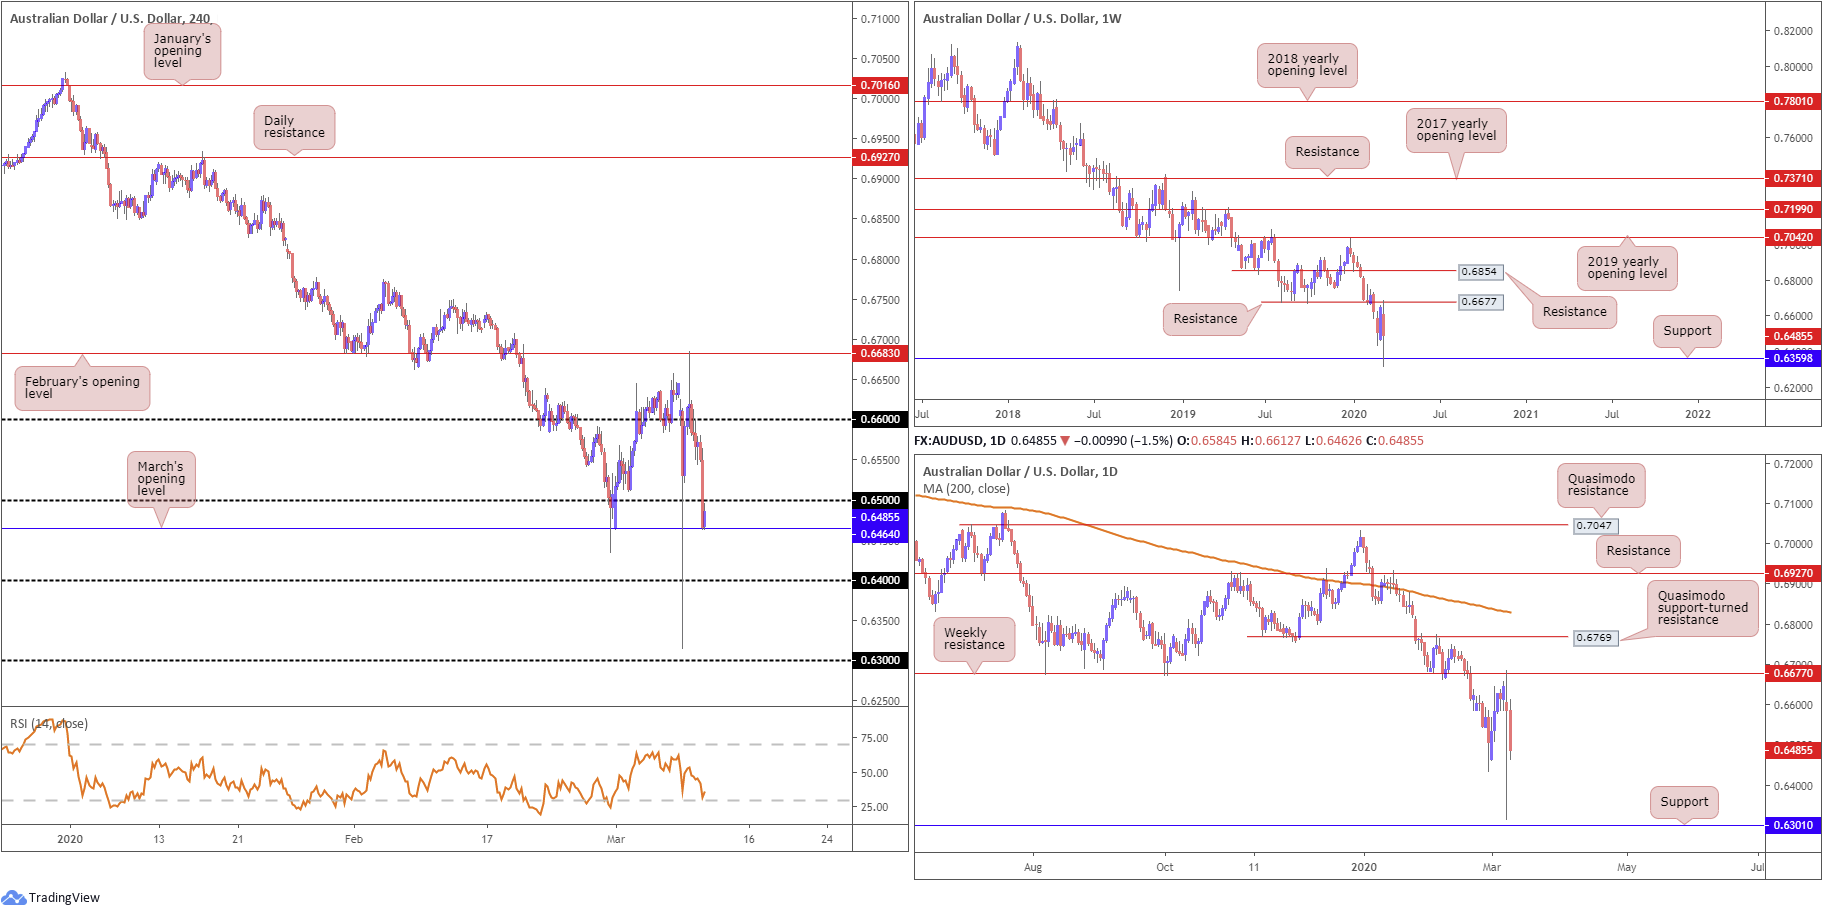
AUD/USD:
The Australian dollar concluded lower against the buck Tuesday, shedding more than 90 points, or 1.50%.
Technical headlines saw H4 knock on the door of 0.65, though in early Asia is seen nursing losses off March’s opening level at 0.6464. South of this band, room to explore lower ground to 0.64 is visible, as the possibility of 0.65 capping upside today is certainly there. This is largely due to both weekly and daily timeframes suggesting lower levels after fading weekly resistance parked at 0.6677.
It may also interest some traders to note the relative strength index (RSI) is seen loitering a few points ahead of oversold waters.
Areas of consideration:
According to the primary trend and higher-timeframe structure, the outlook is not bright for AUD/USD.
As a result, a H4 close below 0.6464 may be on the radar for some traders this morning, with the possibility of an extension to 0.64 and maybe beyond. Breakout traders may feel the evidence provided justifies a sell on the breakout candle’s close; others, however, could favour a retest motion off 0.6464 before committing to a position. This, of course, is trader dependent.
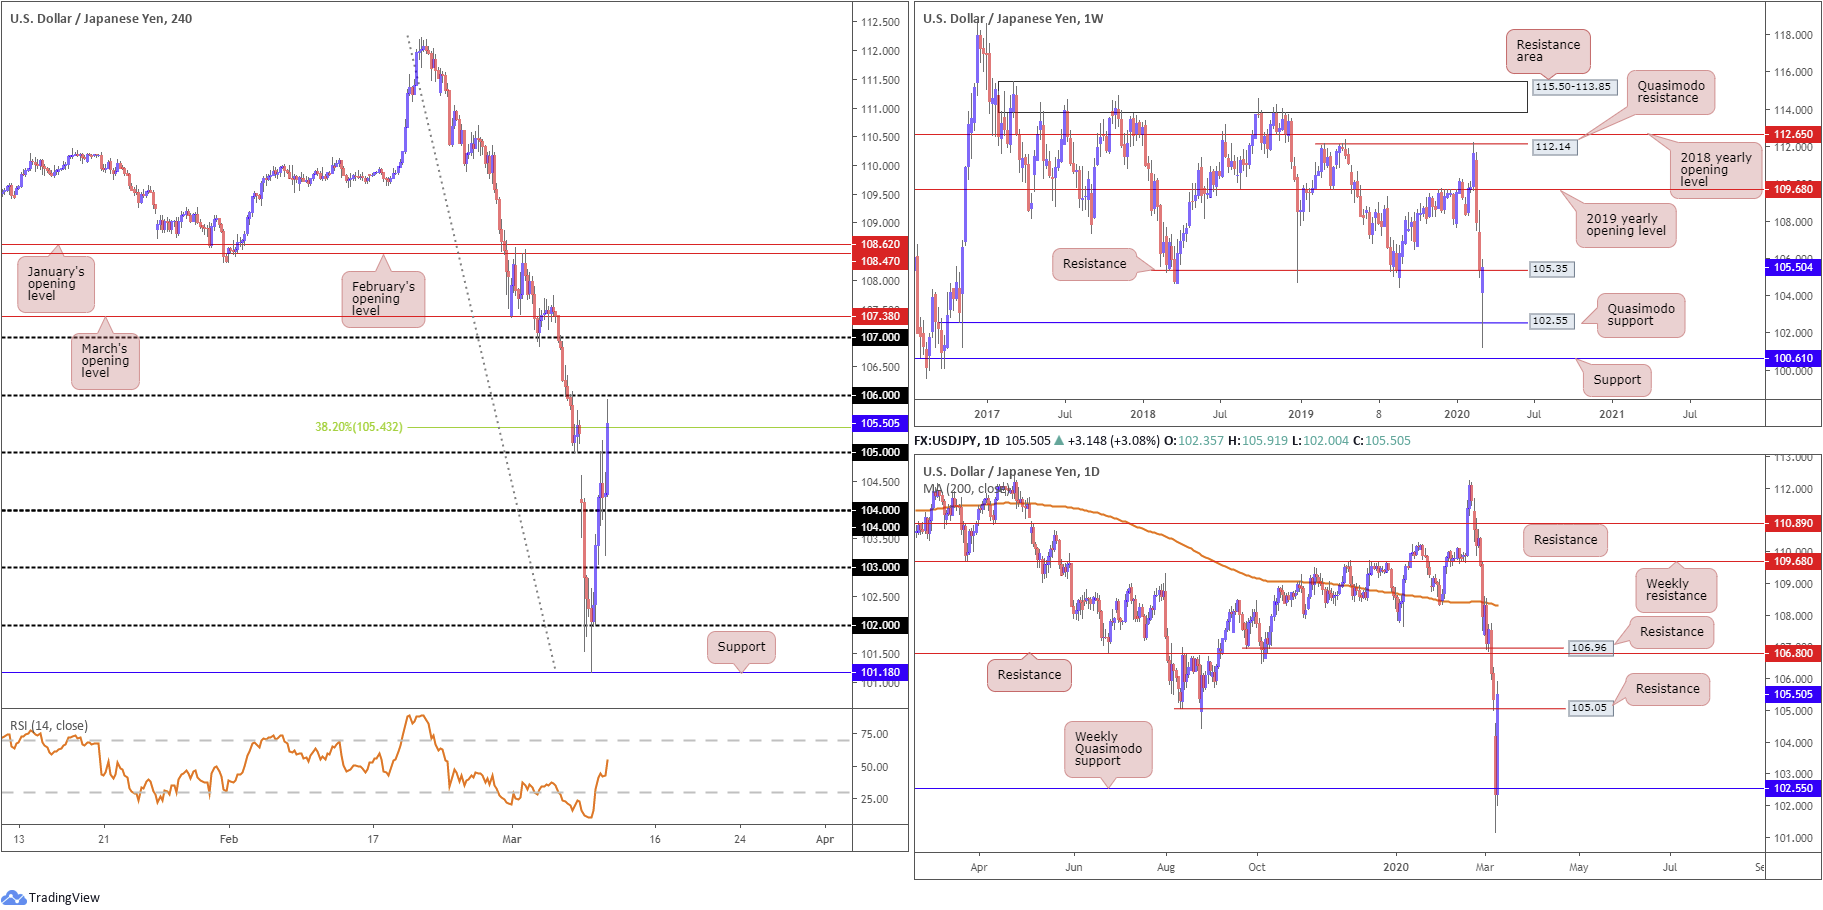
USD/JPY:
Markets improved Tuesday, a day after crude suffered a historic rout while the broader stock market recorded its worst day since the financial crisis. Demand for safe-haven assets diminished, with USD/JPY witnessing a stronger-than-expected recovery off multi-year lows.
Adding more than 295 points, or 2.85%, the pair conquered a number of big figures on the H4 timeframe, recently clocking highs at 105.91, a touch south of 106. The 38.2% Fibonacci retracement at 105.43 is attempting to hold price action, yet the unit remains sited above 105. The relative strength index (RSI), for those who follow momentum oscillators, will note the 50.00 value was taken yesterday.
Movement on the weekly timeframe faded Quasimodo support at 102.55, with resistance at 105.35 currently in motion. A break of this level sees minor swing lows potentially offering resistance, though key resistance resides off the 2019 yearly opening level at 109.68.
A closer reading of price action on the daily timeframe shows price elbowed its way north of 105.05 resistance, a prior Quasimodo support. Owing to this, the possibility of an extension higher could be on the cards, targeting resistance at 106.80 and 106.96, a Quasimodo support-turned resistance.
Areas of consideration:
Weekly price recently grasping familiar resistance at 105.35 will likely encourage selling. A H4 close below 105 may help confirm seller intent off the weekly base, consequently shining the spotlight on 104 as the next downside target for shorts.
Continued upside, on the other hand, may draw the H4 candles above 106, exposing 107 as the next possible resistance. Should this occur, traders may seek breakout opportunities north of 106, targeting daily resistance at 106.80/106.96, followed by 107 mentioned above on the H4 timeframe.
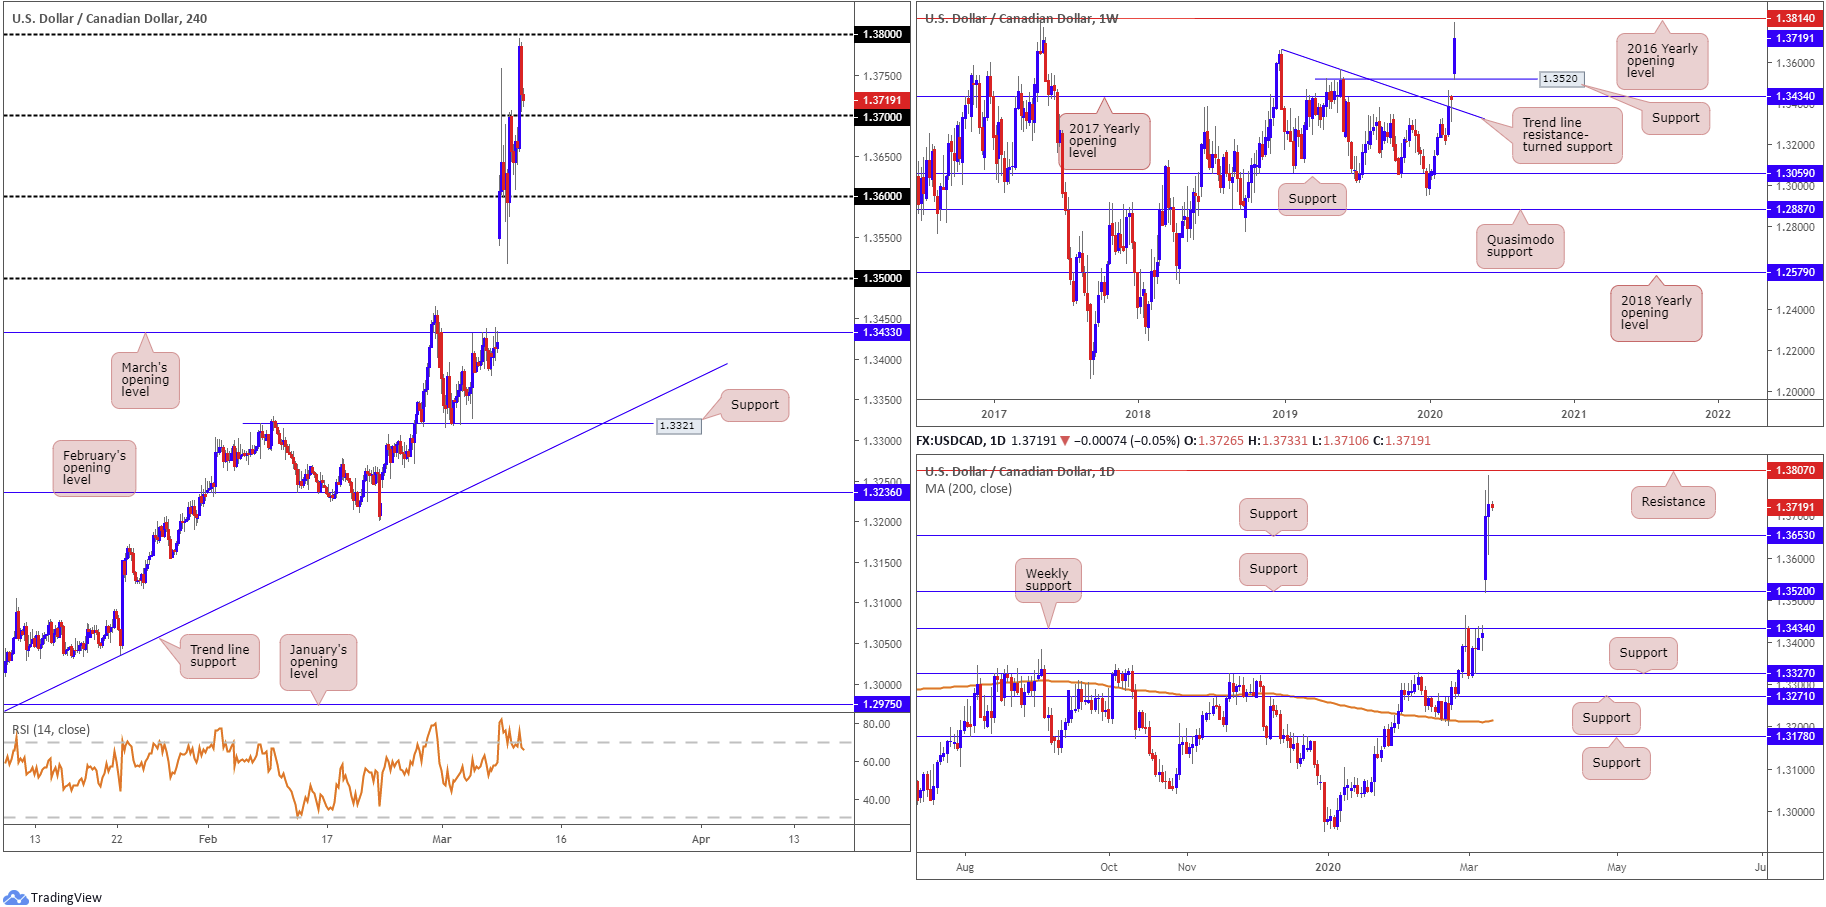
USD/CAD:
USD/CAD gained for a fourth successive session Tuesday, adding 0.20%. WTI gained 15%, a day after the market registered a 27% down move; the US dollar index, prompted by a recovery in US Treasury yields, also firmed Tuesday, reclaiming 96.00+ status and reaching 96.50.
The technical picture on the weekly timeframe for USD/CAD has price eyeing the 2016 yearly opening level at 1.3814 after thrashing Quasimodo resistance at 1.3520, now a serving support. Support on the daily timeframe at 1.3653 remains in play, withstanding a notable downside attempt during Tuesday’s session. Resistance at 1.3807 is visible as the next upside target on this scale.
A closer read on the H4 timeframe saw price action come within striking distance of 1.38, before chalking up a sharp v-shaped top, poised to retest 1.37 as possible support. While headspace beneath 1.37 appears reasonably free to 1.36, traders are urged to pencil in daily support highlighted above at 1.3653.
Areas of consideration:
In the event of a break south of 1.37, movement to daily support at 1.3653 is likely, with a breach here underlining 1.36. This may be of interest to short sellers.
Should we recover and cross paths with 1.38, a fakeout above the level is likely, with weekly resistance at 1.3814 and daily resistance at 1.3807 calling for attention. Note buy-stop liquidity north of 1.38 will likely entice sellers, and pitch the candles south of 1.38.
Both scenarios are considered countertrend, however.
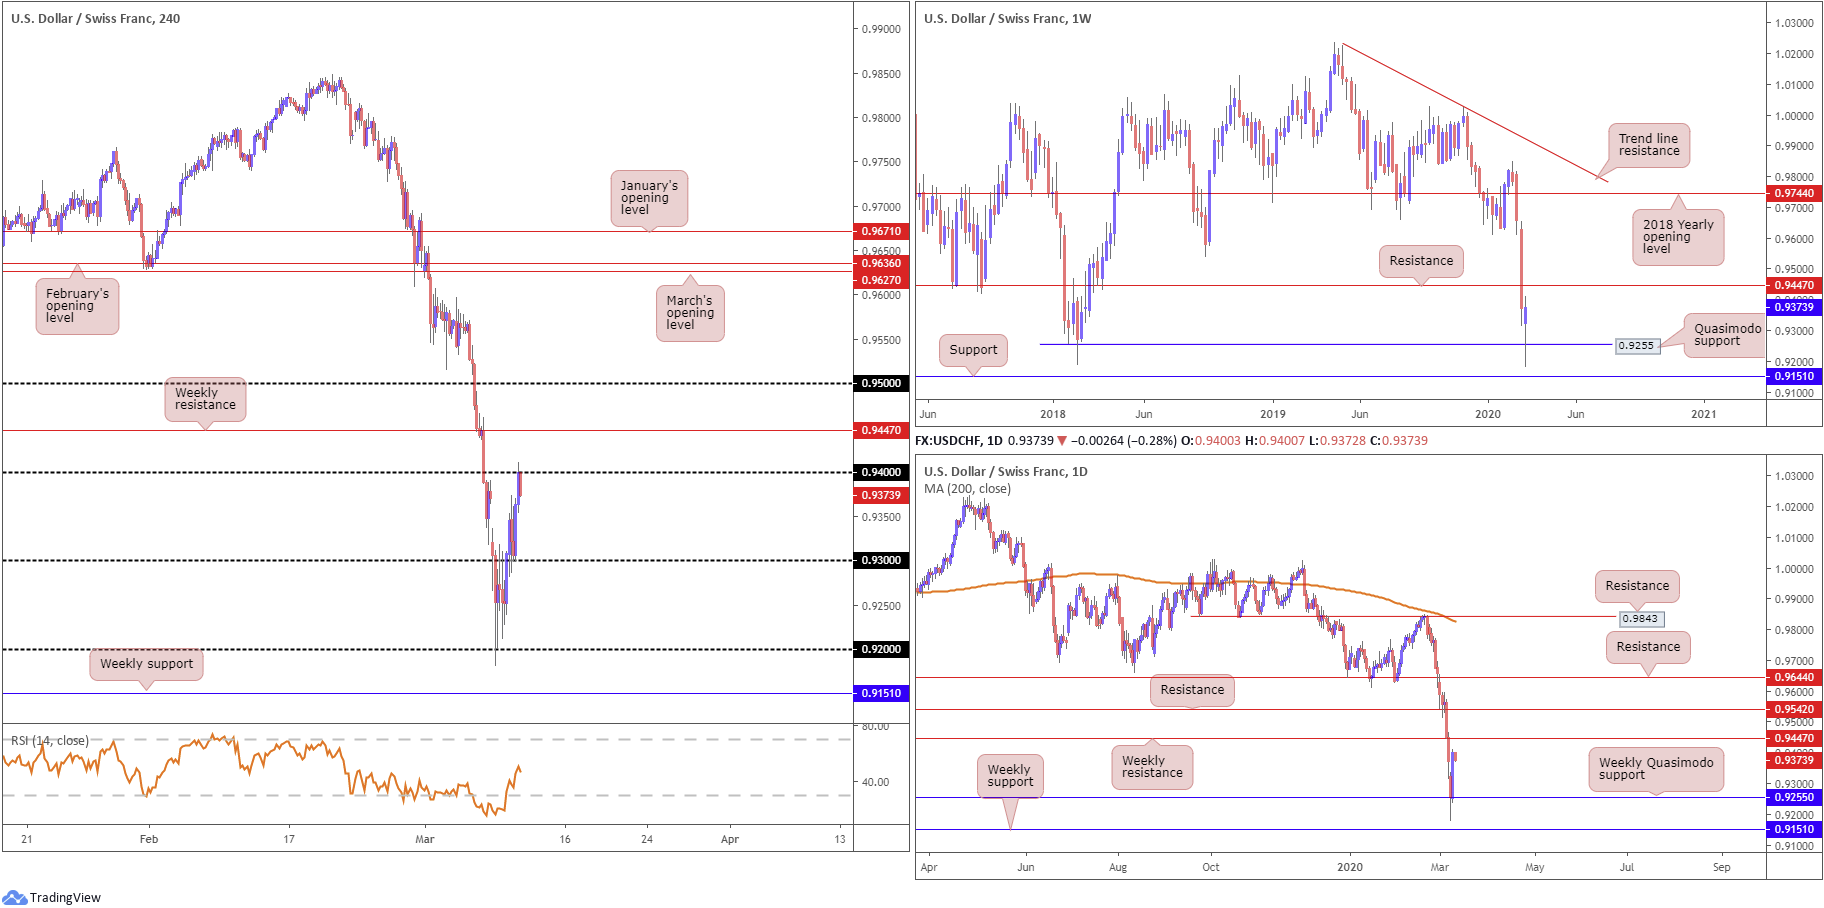
USD/CHF:
Risk sentiment improved Tuesday, with US stocks receiving a boost after President Trump announced he will seek financial relief for workers and businesses affected by the coronavirus outbreak. This fuelled a recovery in US Treasuries, boosting the US dollar index, and also saw traders ditch safe-haven assets, including the Swiss franc.
Quasimodo support on the weekly timeframe at 0.9255 capped downside, albeit after a brief spell to lows at 0.9182 (levels not seen since June 2015. Further recovery on this timeframe could extend as far north as resistance from 0.9447.
H4 action extended gains north of 0.92, running through 0.93 and retesting the latter as support Tuesday for an additional push to 0.94. A break of 0.94, as you can see, has weekly resistance at 0.9447. Note the relative strength index (RSI) failed to overthrow 50.00 after bottoming at 15.00.
Areas of consideration:
A whipsaw through 0.94, tripping buy-stop liquidity, to weekly resistance at 0.9447, could be in the offing today. While yesterday’s recovery attracted early buyers, upside lacks conviction until the weekly resistance mentioned above at 0.9447 is consumed. This level, therefore, may be an area fresh sellers join and current longs liquidate partial profits (essentially selling, too).
Conservative traders may want a H4 close back beneath 0.94 to form, after testing weekly resistance. Entry on the breakout candle is then an option, targeting 0.93 as the initial port of call.
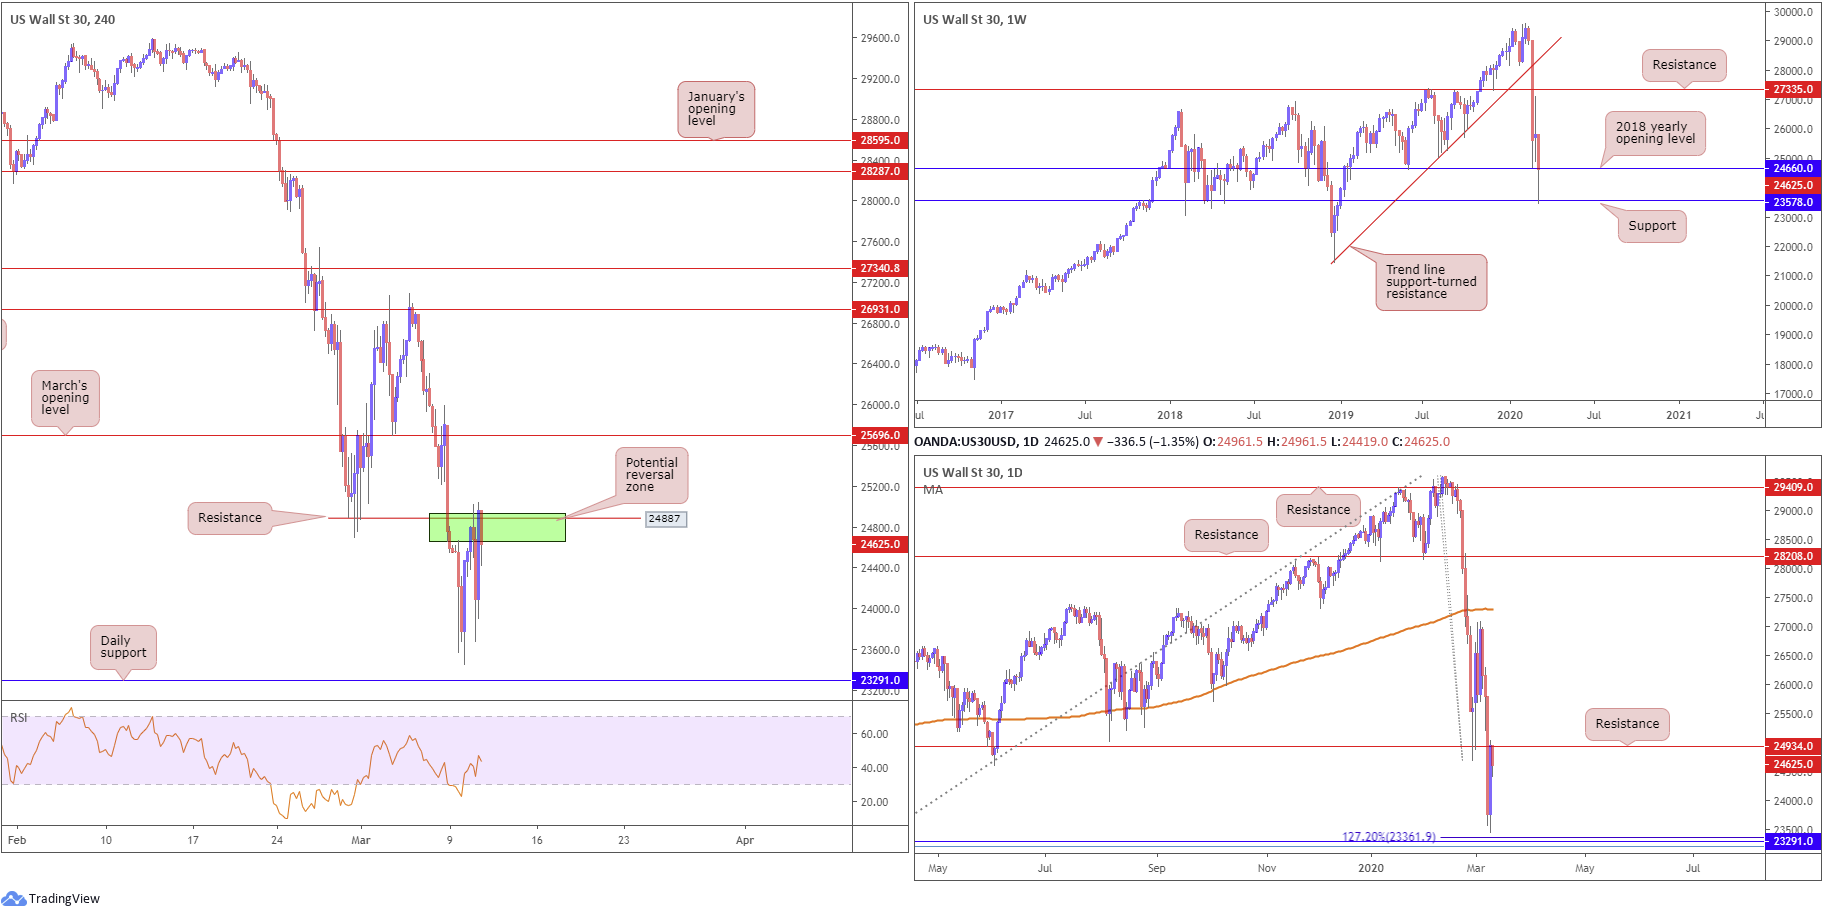
Dow Jones Industrial Average:
US equities finished Tuesday sharply higher, a day after major benchmarks wavered close to the first bear market in more than a decade. The recovery was largely fuelled by President Trump announcing he will seek financial relief for workers and businesses affected by the coronavirus outbreak. The Dow Jones Industrial Average gained 1167.14 points, or 4.89%; the S&P 500 also gained 135.67 points, or 4.94% and the tech-heavy Nasdaq 100 ended higher by 424.42 points, or 5.34%.
Technical developments has weekly price fading support at 23578, after slicing through the 2018 yearly opening level at 24660. Daily price, on the other hand, bottomed just north of support coming in at 23291, which boasts a 127.2% Fibonacci extension point at 23361 and a 78.6% Fibonacci retracement at 23205, and rallied to resistance at 24934.
Across the page on the H4 timeframe, daily support mentioned above at 23291 represents a key fixture on this scale, though resistance can be seen around 24887, a previous Quasimodo support level. It was noted in Tuesday’s technical briefing that:
24887 is likely watched resistance on the H4 timeframe, due to its convergence with daily resistance at 24934. What’s also notable is the 2018 yearly opening level at 24660 could serve as resistance.
Conservative traders interested in shorts between 24934/24660 (green H4 zone) will likely seek at least additional candle confirmation before pulling the trigger, due to recent volatility.
Areas of consideration:
24934/24660 failed to produce much in terms of bearish candlestick signals, still the area managed to hold yesterday and register lows of 23670.
Going forward, 24934/24660 remains a prime resistance zone, though once again traders are urged to wait and see if H4 price chalks up a bearish candlestick signal before pulling the trigger.
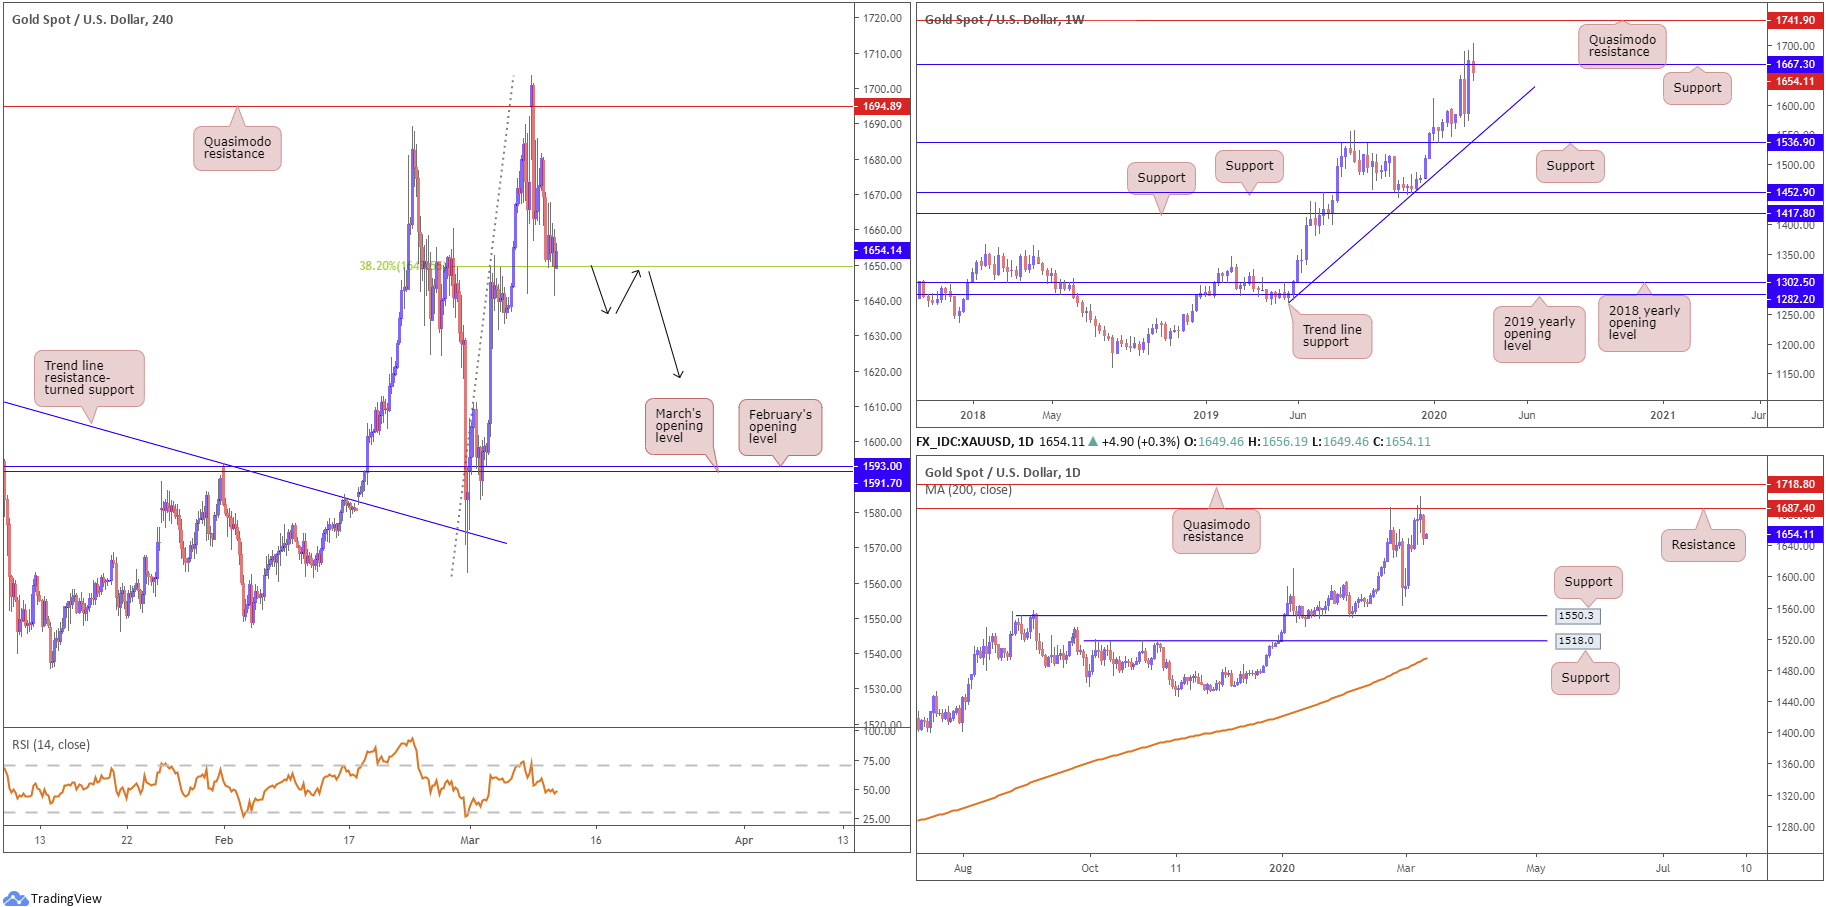
XAU/USD (GOLD):
Safe-haven assets took a hit Tuesday amid upbeat market sentiment, sending bullion to lows at 1641.7, down 1.82% on the day. Technically, H4 price has the unit fading a 38.2% Fibonacci retracement at 1649.9, after dipping lower from Quasimodo resistance at 1694.8. A rotation lower, one that overwhelms 1649.9, could lead to an approach forming to March and February’s opening levels at 1591.7 and 1593.0, respectively. With respect to the relative strength index (RSI) we’re seen trading slightly beneath 50.00 right now, suggesting the bears retain control.
Weekly price, after attempting to hold north of support at 1667.3, is seen dipping its toe in waters south of the said support, suggesting we could be heading for trend line support, taken from the low 1269.6. Resistance on the daily timeframe at 1687.4 remains in play. Continued downside from here has the 1563.1 February 28 low in sight, followed closely by support at 1550.3.
Areas of consideration:
Weekly support failing to offer much of a ‘floor’, as well as daily price navigating lower ground south of resistance at 1687.4, may see the current H4 support at 1649.9 (38.2% Fibonacci support) give way today and highlight bearish scenarios, such as a retest motion at 1649.9 following a break lower (black arrows), to 1590.0ish.
The accuracy, completeness and timeliness of the information contained on this site cannot be guaranteed. IC Markets does not warranty, guarantee or make any representations, or assume any liability regarding financial results based on the use of the information in the site.
News, views, opinions, recommendations and other information obtained from sources outside of www.icmarkets.com.au, used in this site are believed to be reliable, but we cannot guarantee their accuracy or completeness. All such information is subject to change at any time without notice. IC Markets assumes no responsibility for the content of any linked site.
The fact that such links may exist does not indicate approval or endorsement of any material contained on any linked site. IC Markets is not liable for any harm caused by the transmission, through accessing the services or information on this site, of a computer virus, or other computer code or programming device that might be used to access, delete, damage, disable, disrupt or otherwise impede in any manner, the operation of the site or of any user’s software, hardware, data or property.


