
EUR/USD:
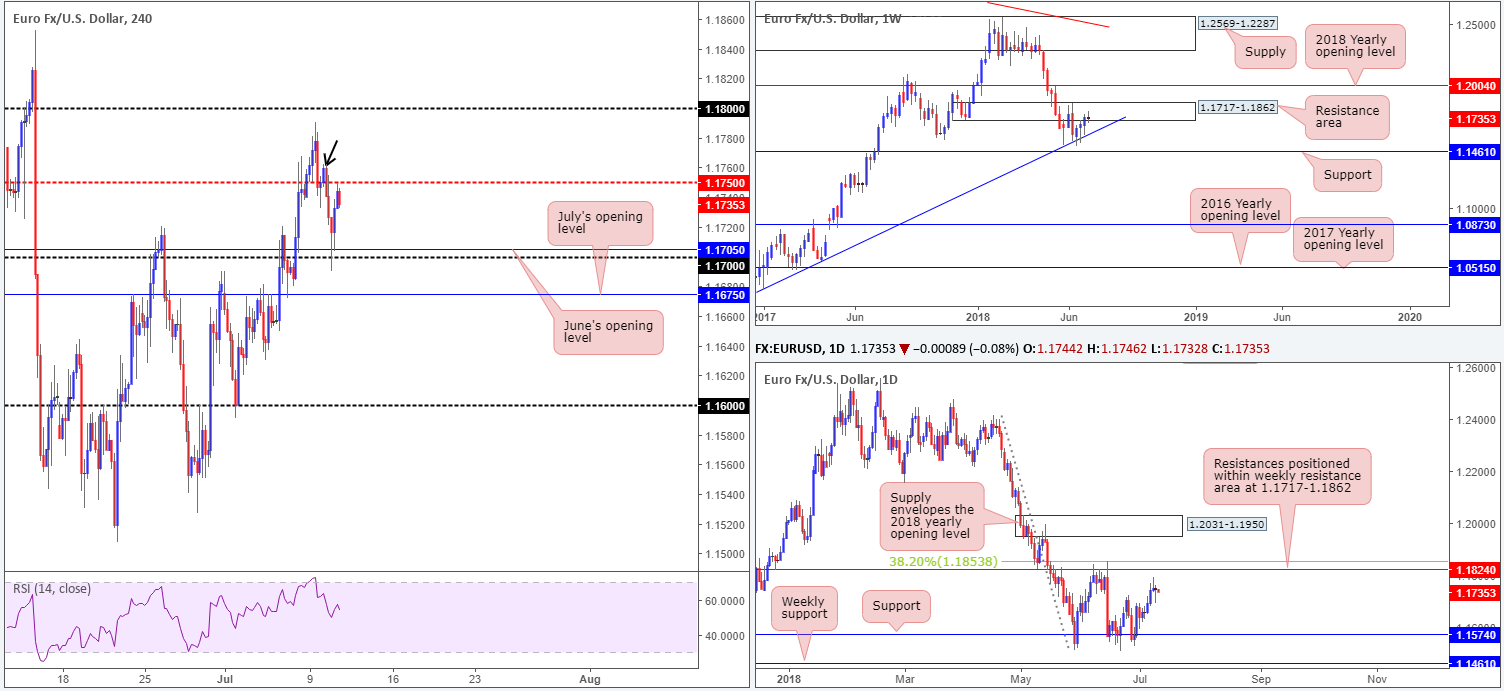
Kicking this market off with a look at the weekly timeframe this morning reveals the buyers and sellers remain battling for position within the walls of a resistance area parked at 1.1717-1.1862. A closer look at price action on the daily timeframe, though, shows a clear path north until resistance plotted at 1.1824 enters the fray, which is shadowed closely by a 38.2% Fib resistance at 1.1853. As marked on the chart, these barriers are situated within the aforementioned weekly resistance zone.
Across on the H4 scale, the candles shook hands with the 1.17 handle/June’s opening level at 1.1705 amid London’s morning session on Tuesday, and ended the day retesting the underside of 1.1750 (H4 mid-level resistance). The initial selloff came about on the back of a stronger dollar and disappointing German ZEW economic sentiment.
Areas of consideration:
At this time, we’re not seeing much to get excited about in this market. Higher-timeframe structure has somewhat conflicting themes: weekly price suggests lower movement, whereas daily action threatens to pop higher. On the H4 timeframe, the pair is sandwiched between 1.1750 (and H4 supply marked with a black arrow at 1.1762-1.1747) and the 1.17/1.1705 boundary (round number and June’s monthly opening level), thus offering little in terms of intraday direction right now.
In view of this, opting to remain on the sidelines today may be the best path to take today.
Today’s data points: ECB President Draghi speaks; US PPI m/m; FOMC members Bostic and Williams speak.
GBP/USD:
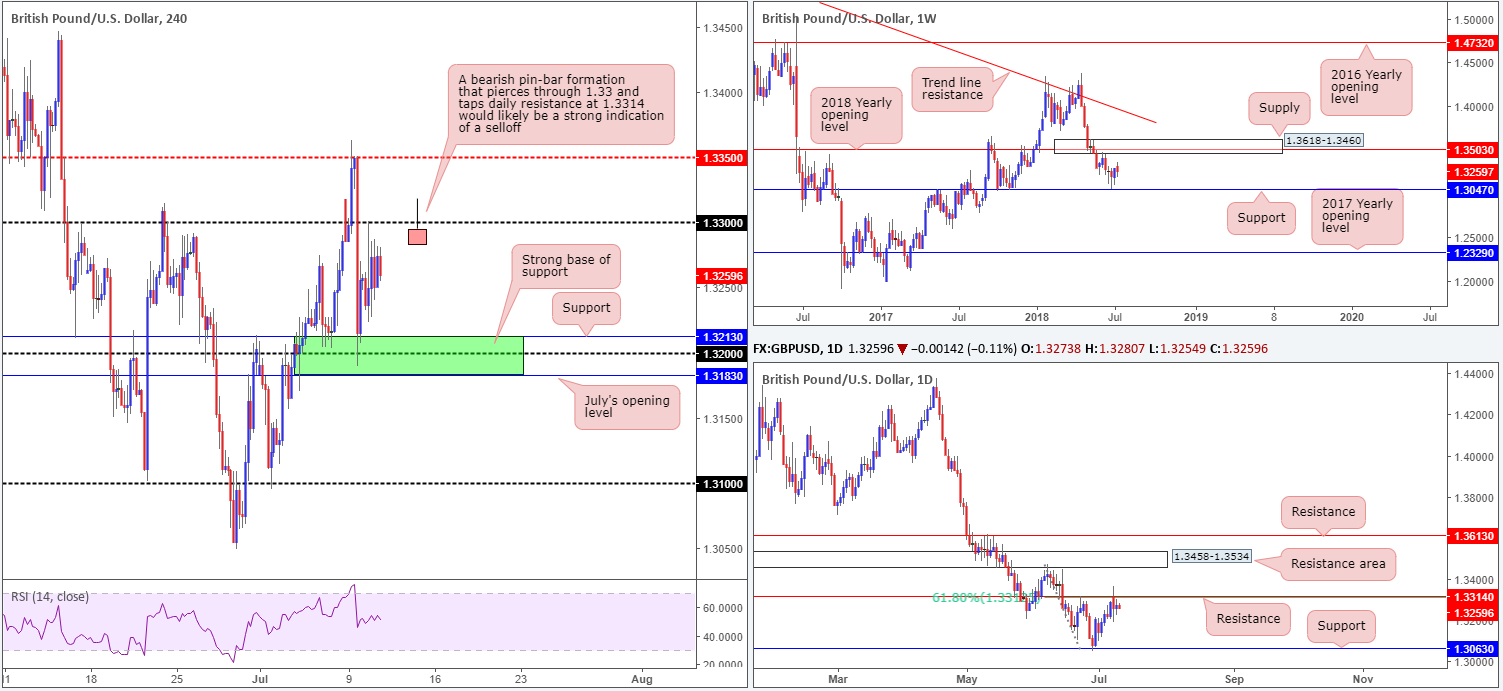
The British pound experienced a significant amount of choppy action on Tuesday, involving a brief spell around the 1.33 handle. UK data disappointed and more politicians resigned in protest of UK’s PM May’s softer Brexit plan. Overall, though, the pair managed to eke out marginal gains on the day. Attention going forward is on Thursday’s release of the long-awaited white paper, which is expected to show a notable softening in the UK’s negotiating position.
In terms of technical structure, the 1.33 handle is still of interest. Supporting a downside move from here is daily resistance planted at 1.3314. Since mid-Oct 2017, this level has provided strong support/resistance on numerous occasions so it is not a base one should overlook! Further adding to this level’s appeal, note the 61.8% Fib resistance value at 1.3312.
Areas of consideration:
As highlighted above, keep eyeballs on the 1.33 handle. A truckload of buyers’ stops were tripped here as price thundered its way south on Monday, thus unfilled orders may remain around this number from those who attempted to short the move. Additionally, confidence in this number was strengthened yesterday after its near-to-the-pip reaction. An ideal sell setup here, therefore, would be for H4 price to chalk up a bearish pin-bar formation that pierces through the underside of 1.33 (tripping stops from those already short) and taps daily resistance mentioned above at 1.3314 (for a visual representation, see the H4 chart). Shorts on the close of the candle, targeting the H4 support area marked in green at 1.3183/1.3213 (comprised of July’s opening level, a round number and H4 support), is considered a high-probability move.
Today’s data points: BoE Gov. Carney speaks; US PPI m/m; FOMC members Bostic and Williams speak.
AUD/USD:
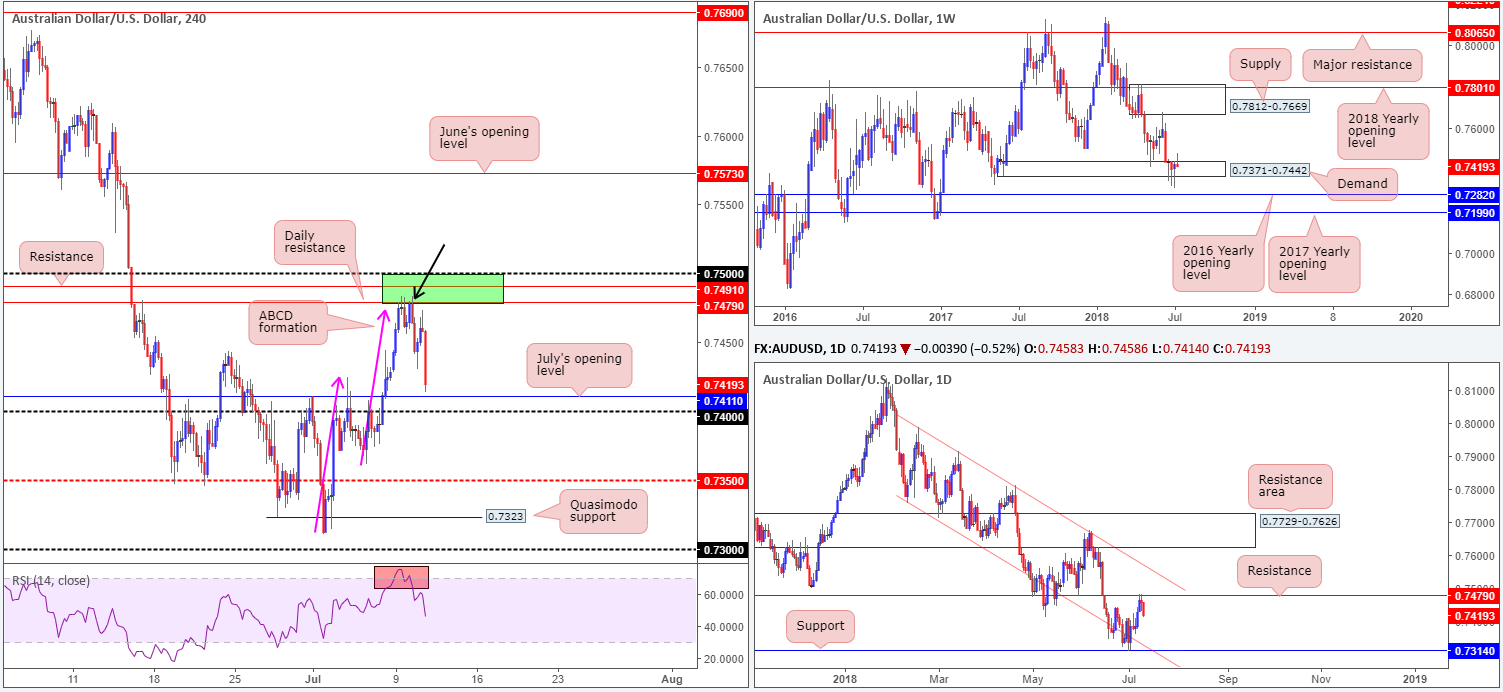
The AUD/USD, as you can see, concluded Tuesday’s session somewhat indecisively. Despite this, in recent hours, a US administration official confirmed the US is likely to announce a $200bln China tariff as early as today, consequently prompting a bout of selling in this market. The H4 candles are now seen within striking distance of July’s opening level at 0.7411, followed closely by the 0.74 handle.
For folks who read previous reports you may recall the team highlighted the 0.75/0.7479 (green) area as a possible sell zone (comprised of an ABCD [pink arrows] completion point, daily and H4 resistance levels and the 0.75 handle – also note H4 RSI was registering an overbought reading). The area held beautifully and even provided additional H4 candle confirmation in the shape of a near-full-bodied bearish candle (see black arrow). Well done to any of our readers who managed to take advantage of this move.
Areas of consideration:
Aside from the noted setup highlighted above, the team suggests keeping tabs on 0.74 today. Overhead pressure seen from the daily resistance level at 0.7479 may see H4 price engulf 0.74, likely unlocking downside to H4 mid-level support at 0.7350, and quite possibly H4 Quasimodo support at 0.7323 and the 0.73 handle.
A H4 close below 0.74 that’s followed up with a retest as resistance would, therefore, be an area to consider either adding to your current shorts, or initiating a fresh sell position, targeting 0.7350/0.7323/0.73.
Today’s data points: US PPI m/m; FOMC members Bostic and Williams speak.
USD/JPY:
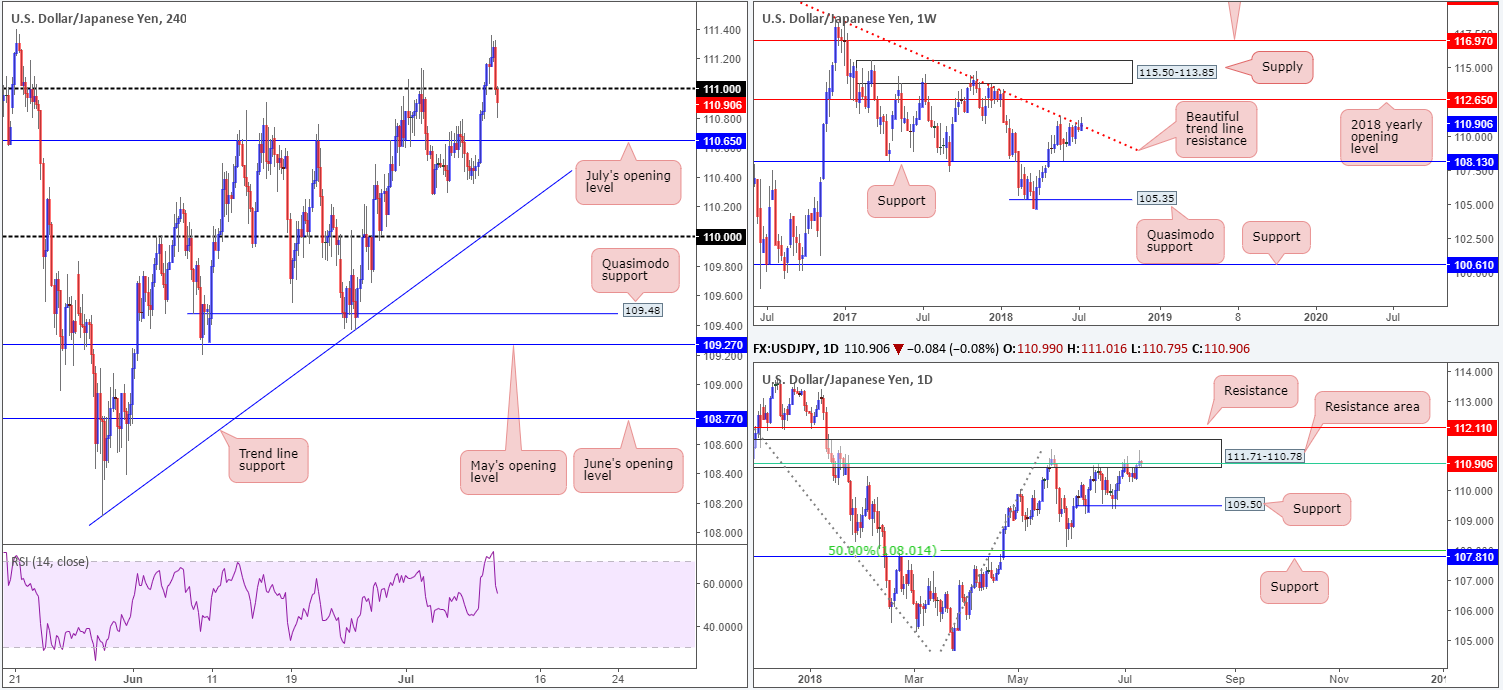
Tuesday session began on a strong footing. Amid a positive tone in the US equity markets and robust US Treasury yields, the USD/JPY popped above the 111 handle and came within an ant’s hair of clipping the May 21 high at 111.39. In spite of an earnest attempt from the bulls, things turned sour in recent hours. In early Asia, the pair lost the 111 handle on the back of fresh trade war angst, whereby the US is likely to announce a $200bln China tariff as early as today.
The recent bout of selling has placed July’s opening level seen on the H4 timeframe at 110.65 back on the radar. It also gave weekly sellers a slight edge as they appear struggling to hold the weekly trend line resistance taken from the high 123.57. In terms of daily structure, however, we can see the current weekly trend line resistance is bolstered by a daily resistance area seen at 111.71-110.78, which happens to house a 61.8% daily Fib resistance value at 110.91 (green line – in play as we write) within its limits. Note that the next downside target on the daily scale does not come into view until we reach the 109.50ish mark.
Areas of consideration:
Despite the recent push higher yesterday, all three timeframes still suggest further selling could be on the cards.
On the assumption sellers remain defensive sub 111, the expectation is for a test of July’s opening level mentioned above at 110.65. Beyond here, we have eyes on the H4 trend line support extended from the low 108.11. To take advantage of any move lower, however, it may involve drilling down to the lower timeframes to accommodate reasonable risk/reward, due to only 35 pips of room to play with between the 111 handle and 110.65.
Today’s data points: US PPI m/m; FOMC members Bostic and Williams speak.
USD/CAD:
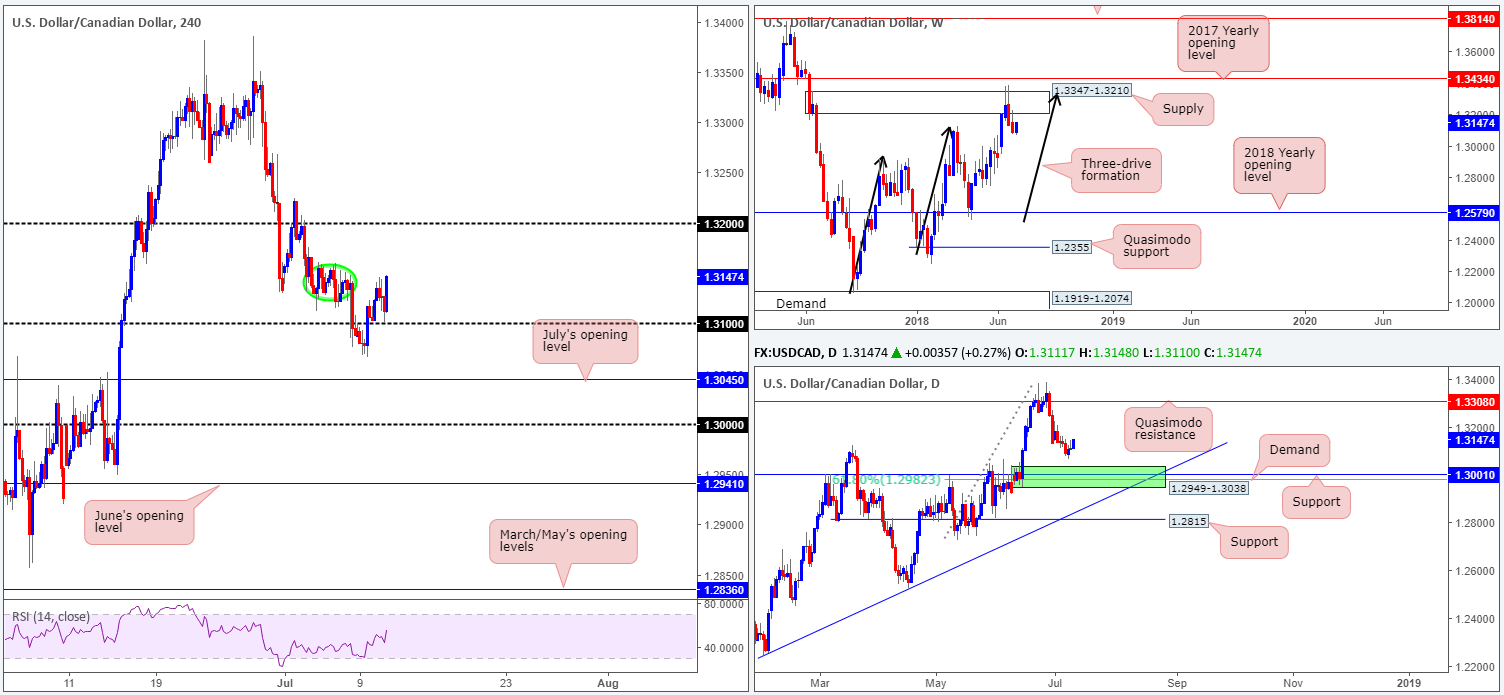
Try as it might, the USD/CAD was unable to retake the 1.31 handle to the downside on Tuesday. Ahead of today’s BoC rates decision, we’re not expecting to see much movement. The Bank of Canada is likely to resume tightening policy, hiking interest rates by 25bps to 1.50%. Of the 25 analysts surveyed by Reuters, 20 expect the BoC to hike with just 5 expecting no change at the meeting.
In terms of technical structure in this market, we see a fair portion of wood to chop through circled in green at around 1.3160/1.3123. Beyond this base, the 1.32 handle is likely the next hurdle in the firing range. On the weekly timeframe, a bearish vibe is still clearly present. After an aggressive bearish engulfing candle took shape two weeks back that whipsawed through the top edge of a supply area at 1.3347-1.3210 and completed a three-drive approach (see black arrows), we do not see much support in the firing range on this scale.
A closer look at price action on the daily timeframe, however, reveals strong support standing at 1.3001 (history dating back to Sept 2016), followed closely by a 61.8% Fib support value at 1.2982. On top of this, we can also see demand painted in green at 1.2949-1.3038 converging with these levels! Collectively, these areas are likely to hinder downside movement should price reach this far south.
Areas of consideration:
In light of where the market is trading on the bigger picture right now, we feel upside momentum may diminish.
With that being the case, the team has, once again, noted to keep eyes on a break below 1.31. A H4 close beneath here followed up with a retest would, as far as we can see, be enough to consider shorts. July’s opening level at 1.3045 is the first port of call from here. A break of this level, nonetheless, will have us entering the jaws of the green daily demand highlighted above at 1.2949-1.3038. The ultimate target for shorts below 1.31, though, remains at the key 1.30 figure.
As a reminder, do keep in mind we have the BoC taking to the stage later on today and this will likely breeze through nearby tech levels!
Today’s data points: US PPI m/m; FOMC members Bostic and Williams speak; BoC rate decision and monetary policy report.
USD/CHF:
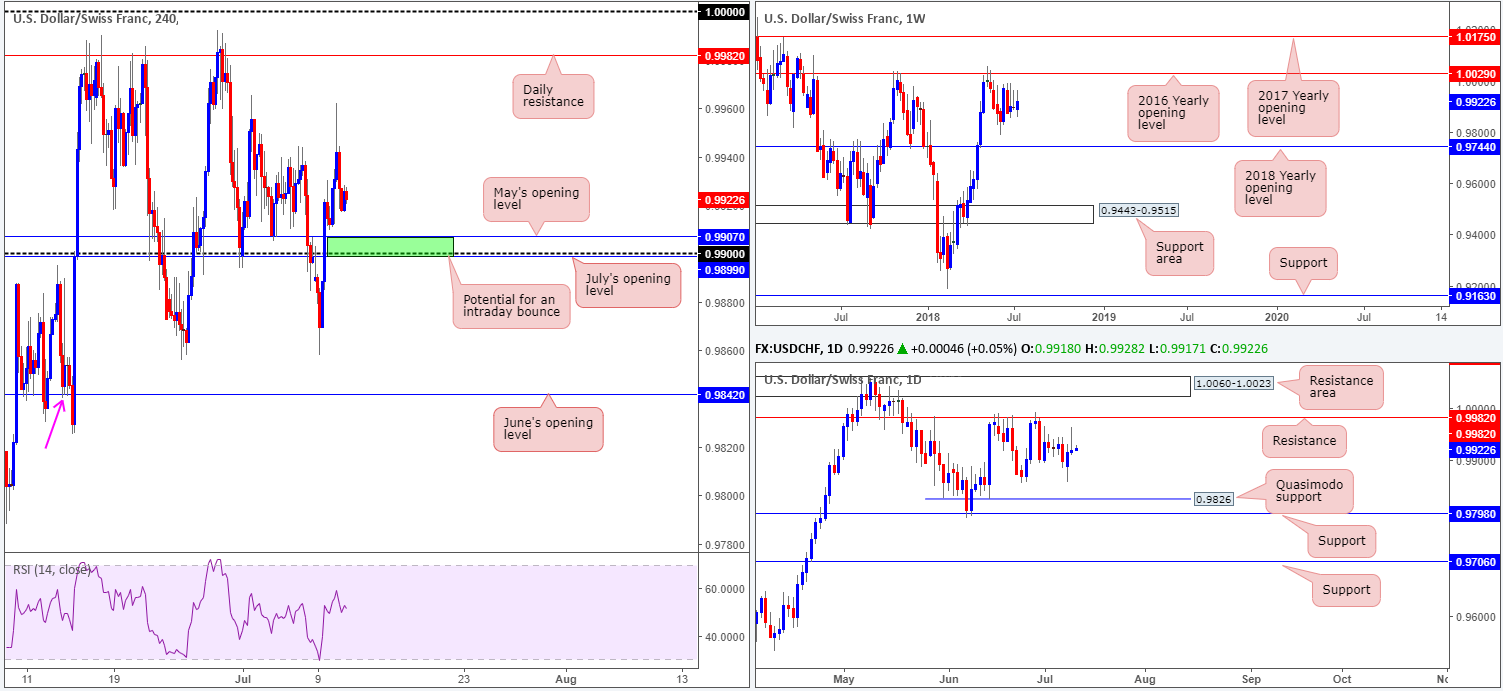
In terms of the higher timeframes in this market, weekly movement has been consolidating just south of the 2016 yearly opening level at 1.0029 for more than four weeks. To the downside, nonetheless, we have the 2018 yearly opening level at 0.9744 on the radar. Resistance at 0.9982 continues to play a key role on the daily timeframe, holding price lower on two occasions in June. Supportive structure on this scale can be seen at the June 25 low drawn from 0.9855, followed by Quasimodo support seen at 0.9826.
Tuesday’s segment began on a high note, with USD/CHF bulls advancing to highs of 0.9962 amid London’s morning session. Following the US dollar index lower, the pair swiftly reclaimed all immediate gains in US trade, consequently forming a nice-looking daily bearish pin-bar formation.
Areas of consideration:
Initial thoughts remain on longs from the green H4 zone between 0.9899/0.9907 (July’s opening level, 0.99 handle and May’s opening level). Unfortunately, there is no higher-timeframe support seen here, so we would strongly recommend waiting for H4 price to print a full or near-full-bodied bull candle before pulling the trigger. Stop-loss orders are best placed beyond the candle’s rejecting tail, with the initial take-profit target set around the 0.9944ish area.
Today’s data points: US PPI m/m; FOMC members Bostic and Williams speak.
Dow Jones Industrial Average:
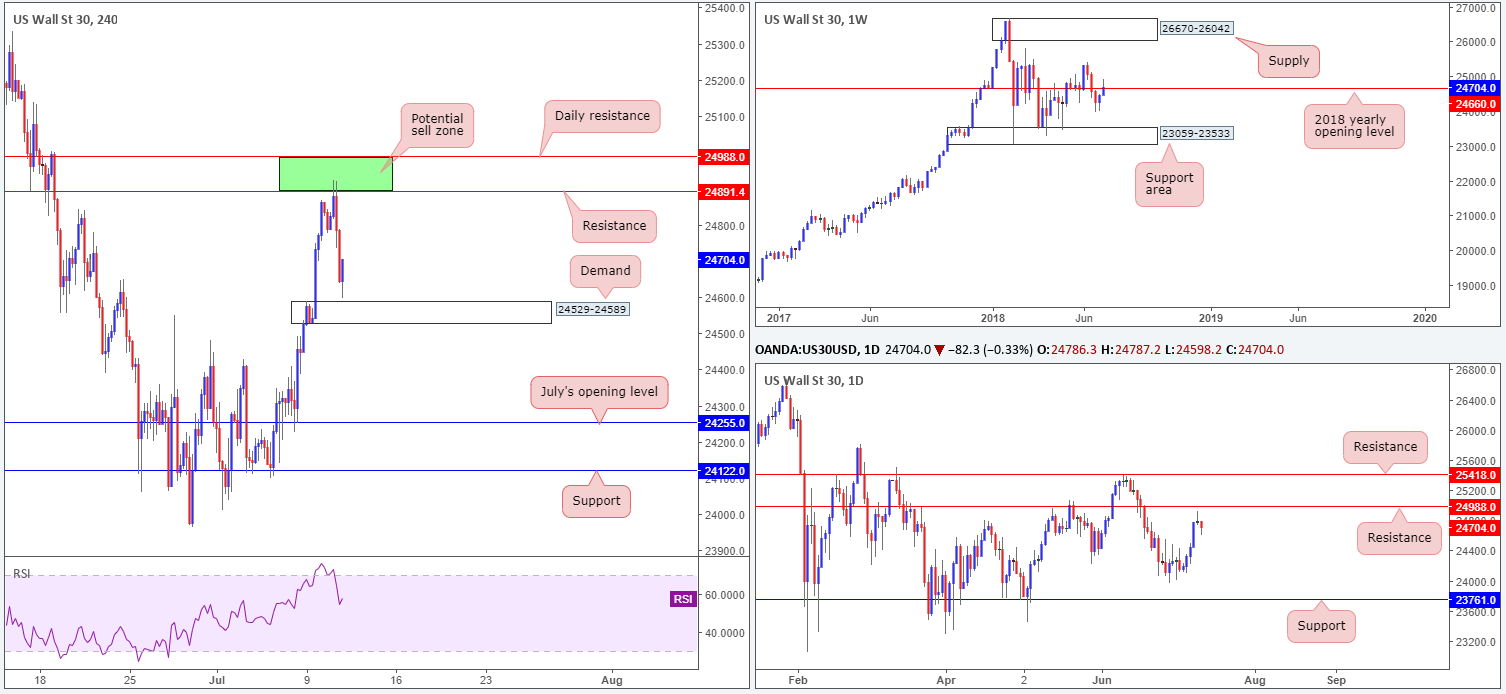
Risk appetite faded in recent trade as H4 price shook hands with the 24988/24891 sell zone. Comprised of a daily resistance level at 24988 and a H4 resistance level at 24891, the move lower from here was exacerbated by fresh trade war movement as the US announced a new tariff list on additional $200bln of goods from China. Well done to any of our readers who took advantage of this zone, as the first take-profit target came within striking distance in recent hours: a H4 demand base coming in at 24529-24589. It appears buyers are reacting to the 2018 yearly opening level seen on the weekly timeframe at 24660, printed just above the current H4 demand.
Areas of consideration:
Aside from the sell zone highlighted in yesterday’s report, we do not see much to hang our hat on at this time, particularly with weekly price now engaging with the yearly opening level at 24660. Price could trade either way!
Today’s data points: US PPI m/m; FOMC members Bostic and Williams speak.
XAU/USD (Gold)
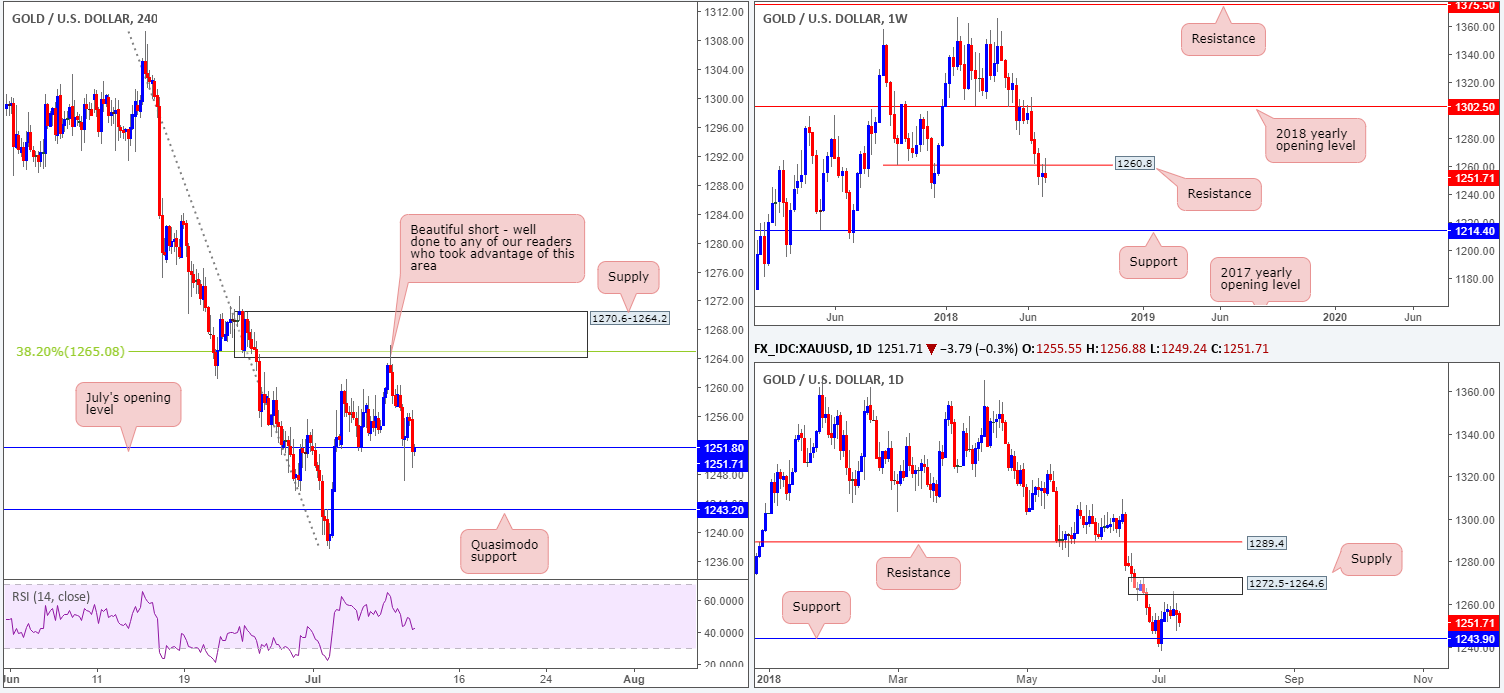
Weekly resistance at 1260.8 is emphasizing strength this morning. Continued selling from this vicinity will see the yellow metal potentially approach weekly support at 1214.4. Further supporting this level, though, is daily supply notched in at 1272.5-1264.6. Despite this, buying pressure may enter the market a little earlier according to this timeframe, given daily support seen nearby at 1243.9.
For those who remain short from the H4 supply zone at 1270.6-1264.2, excellent work! This zone was a noted base to keep eyes on in Monday’s report. We liked the area due to the following:
- Houses a 38.2% Fib resistance value at 1265.0.
- Encapsulated within daily supply at 1272.5-1264.6.
- Positioned close by a weekly resistance at 1260.8.
Areas of consideration:
According to our read, the sellers are likely going to remain in control until we shake hands with a H4 Quasimodo support at 1243.2 (seen plotted just beneath the daily support level mentioned above at 1243.9). July’s opening level seen in play at 1251.8 appears incredibly fragile at the moment, hence why we’re looking at lower levels.
Should you have missed the initial short at H4 supply, there may be a chance to get in on the action on a H4 close below and retest of 1251.8, targeting 1243.2ish.
The use of the site is agreement that the site is for informational and educational purposes only and does not constitute advice in any form in the furtherance of any trade or trading decisions.
The accuracy, completeness and timeliness of the information contained on this site cannot be guaranteed. IC Markets does not warranty, guarantee or make any representations, or assume any liability with regard to financial results based on the use of the information in the site.
News, views, opinions, recommendations and other information obtained from sources outside of www.icmarkets.com.au, used in this site are believed to be reliable, but we cannot guarantee their accuracy or completeness. All such information is subject to change at any time without notice. IC Markets assumes no responsibility for the content of any linked site. The fact that such links may exist does not indicate approval or endorsement of any material contained on any linked site.
IC Markets is not liable for any harm caused by the transmission, through accessing the services or information on this site, of a computer virus, or other computer code or programming device that might be used to access, delete, damage, disable, disrupt or otherwise impede in any manner, the operation of the site or of any user’s software, hardware, data or property.


