
EUR/USD:
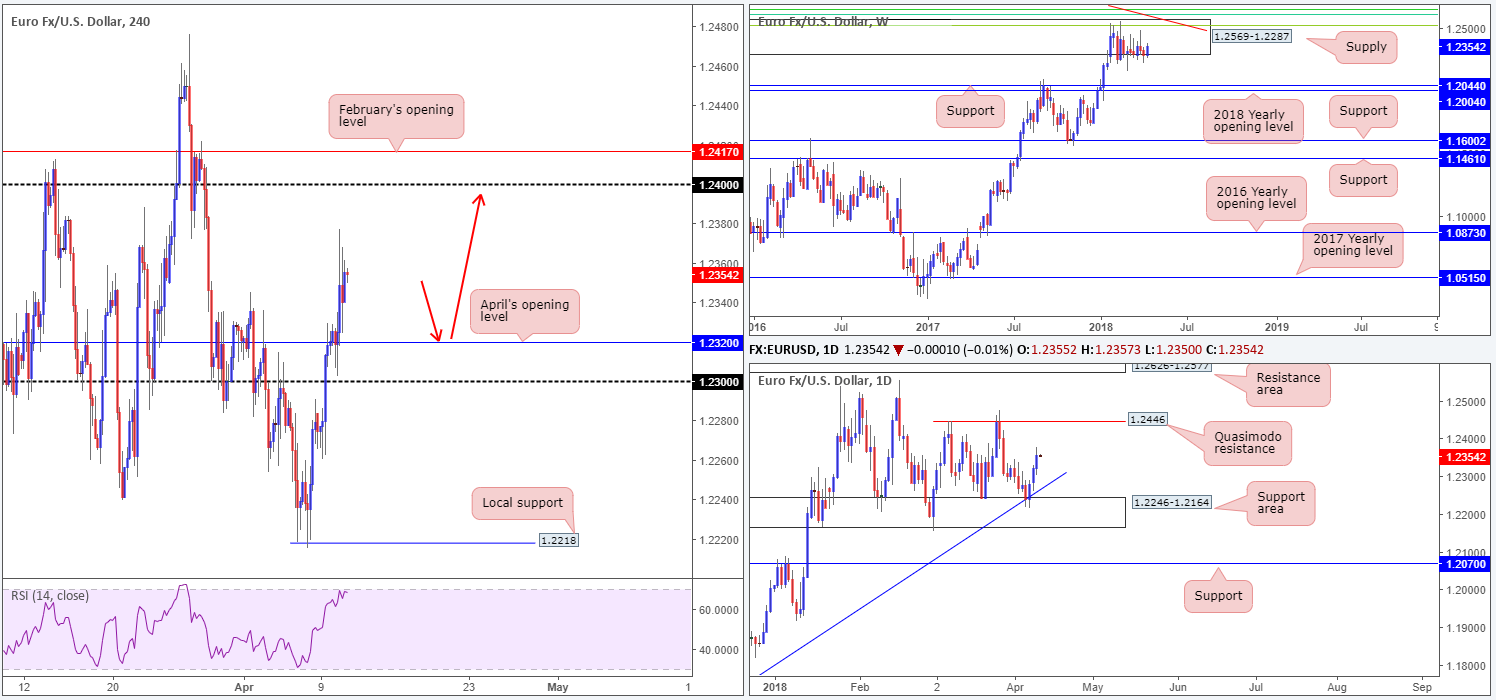
The euro is trading with a reasonably strong upside bias this morning, after the market registered its third consecutive bullish gain on Tuesday. ECB’s Nowotny’s comments provided a ledge for the unit to springboard to highs of 1.2377, despite weekly price remaining captive within the walls of a major-league weekly supply at 1.2569-1.2287.
ECB hawk Nowotny said the ECB could lift the deposit rate by 20bps to -0.20% to begin the process of rate hikes, the first phase before then raising the ref rate. The reaction was predictably hawkish, resulting in an ECB spokesperson to later clarify Nowotny’s comments, saying that those were his own views, not those of the Governing Council.
On the H4 timeframe, the next upside resistance to have an eyeball on can be seen at the 1.24 handle, shadowed by February’s opening level at 1.2417 (also worthy of note is the H4 RSI registering an overbought reading). This is followed closely by a daily Quasimodo resistance coming in at 1.2446: the next upside hurdle on the daily timeframe.
Potential trading zones:
According to the daily timeframe, further buying could be on the cards until we touch gloves with the aforementioned daily Quasimodo resistance. However, this means going up against potential weekly flow from supply!
Should you believe the euro still has more gas left in the tank to push higher, then, as highlighted in Tuesday’s report, a retest of April’s opening level on the H4 timeframe at 1.2320 could still be an option, targeting 1.24 (as per the red arrows). To be on the safe side, nonetheless, we would strongly recommend waiting and seeing if H4 price can chalk up a H4 full or near-full-bodied bull candle off of 1.2320 before committing. This will show that buyers are present and help avoid getting caught on a fakeout down to the nearby 1.23 handle.
Data points to consider today: ECB President Draghi speech; US CPI m/m and FOMC meeting minutes.
GBP/USD:
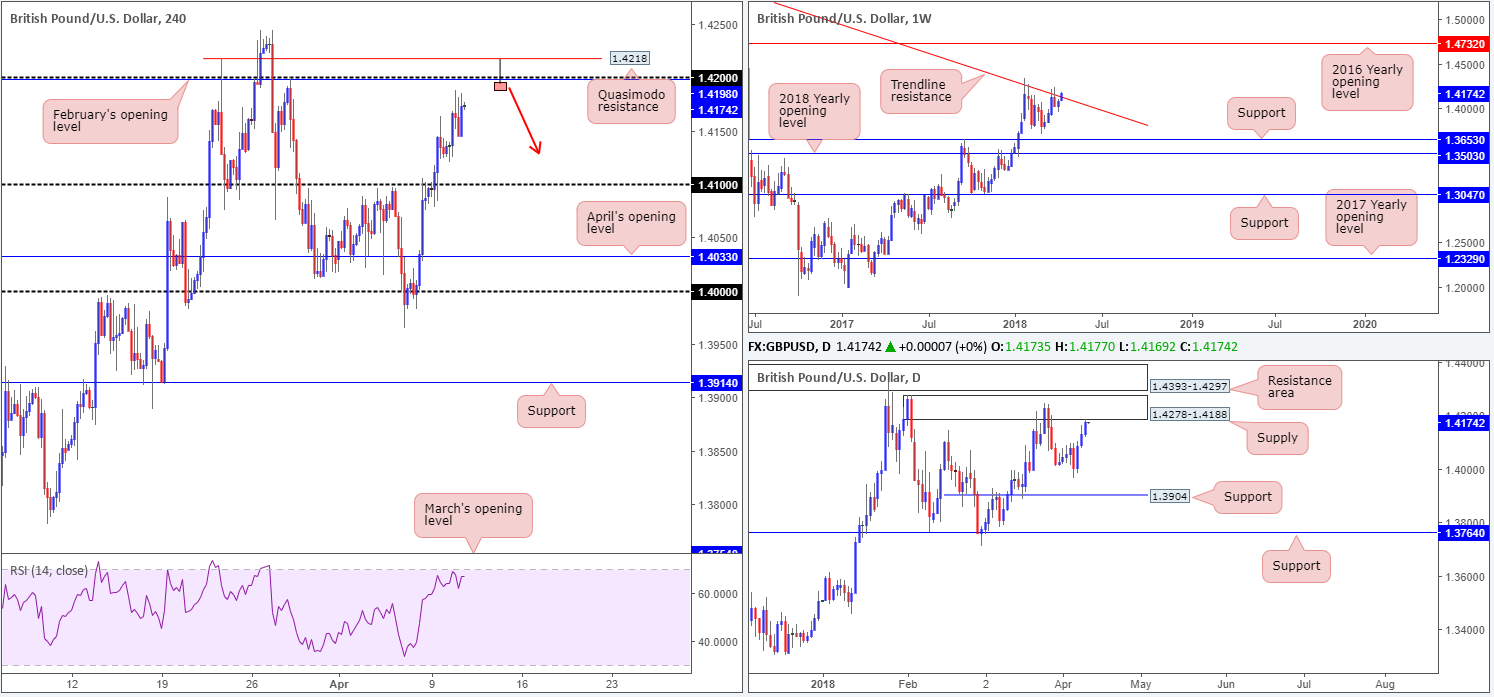
In recent trade, the British pound extended its latest advance up to highs of 1.4188. This comes off the back of a USD decline and hawkish comments from BoE member McCafferty, one of only two members that voted for a rate hike last month.
From a technical standpoint, this has positioned the H4 candles just south of the 1.42 handle/February’s opening level, and a H4 Quasimodo resistance level at 1.4218. Traders may have also noticed that surrounding these levels is a rather large daily supply zone pegged at 1.4278-1.4188, which happens to be shadowed closely by a daily resistance area coming in at 1.4393-1.4297.
What’s also interesting is the recent bout of buying has pressured weekly price marginally above a long-term weekly trend line resistance taken from the high 1.5930. This line has not witnessed a close higher since late 2015!
Potential trading zones:
With H4 RSI approaching the overbought line, along with daily price teasing the lower edge of a daily supply at 1.4188, a short from the 1.42 region on the H4 scale could be something to consider today. As most are already aware, psychological numbers are prone to fakeouts. Therefore, an ideal sell signal would, as penciled in on the H4 chart, be a H4 bearish pin-bar formation that stabs through orders at 1.42 and crosses swords with the above noted H4 Quasimodo resistance. This, in our technical view, has the potential to reach at least 1.41.
Data points to consider today: UK manufacturing production m/m; UK Goods trade balance; US CPI m/m and FOMC meeting minutes.
AUD/USD:
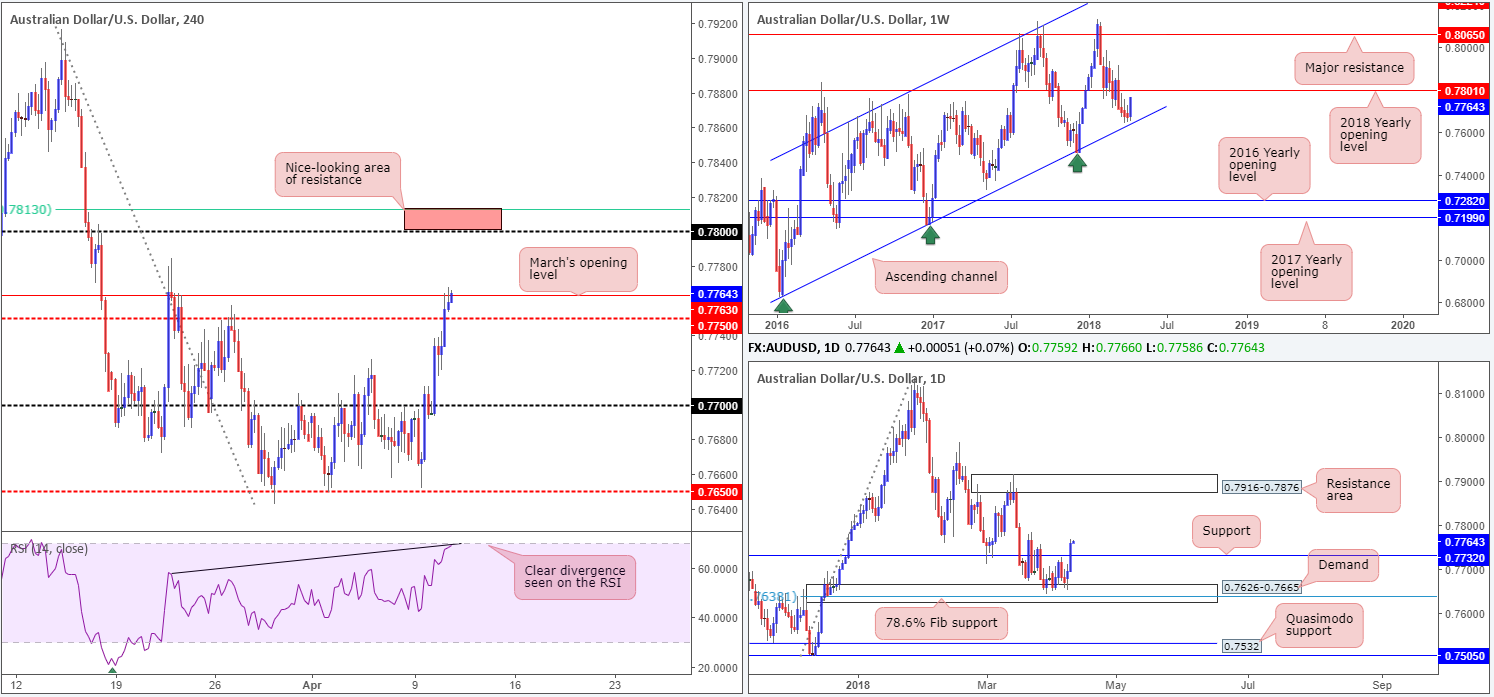
With flows moving out of havens (JPY and CHF) and into risk (AUD, CAD and NZD), the Australian dollar concluded Tuesday’s segment in positive territory.
Alongside a more constructive risk tone from China’s President Xi, the AUD/USD broke through the H4 mid-level resistance at 0.7750 and connected with March’s opening level seen directly above it at 0.7763.
Clearing 0.7763, as you can see, opens up the path north to the 0.78 handle, which is not only positioned nearby a 61.8% H4 Fib resistance at 0.7813, it also represents the 2018 yearly opening level on the weekly timeframe at 0.7801.
Potential trading zones:
0.7813/0.78 is of interest for shorts this morning. Traders may also want to note that alongside the aforementioned structures, we can also see the H4 RSI registering divergence and overbought readings.
As 0.7813/0.78 is relatively small, a fakeout is likely to be observed. To help avoid getting snagged, consider waiting for H4 price to stabilize around the zone before pulling the trigger. Ideally, a H4 full or near-full-bodied bearish candle would be best. As for take-profit targets, the next logical zone, as of current price, is March’s opening level mentioned above at 0.7763.
Data points to consider today: Chinese inflation figures y/y; RBA’s Lowe speech; US CPI m/m and FOMC meeting minutes.
USD/JPY:
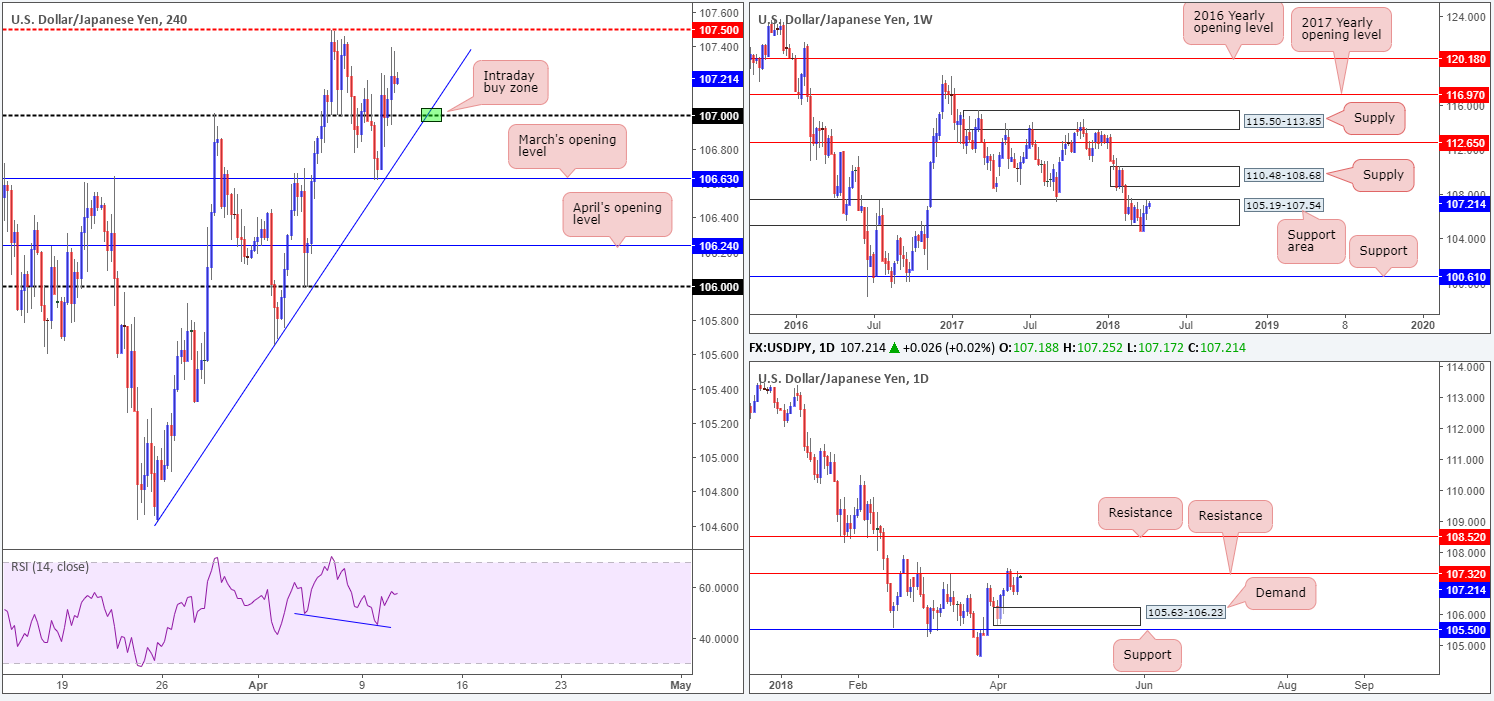
As demand for the safe-haven yen diminished, the US dollar pressed higher against its Japanese counterpart during Tuesday’s session.
For those who read Tuesday’s report you may recall the team highlighting a potential buy zone off of March’s opening level seen on the H4 timeframe at 106.63. The point at where the monthly level and the H4 trend line taken from the low 104.62 intersected was particularly appealing. Not only this, let’s remember that we also had credible divergence seen on the H4 RSI indicator. As you can see, 106.63 held firm and eventually conquered the 107 handle (a noted first take-profit target). Therefore, well done to those who took advantage of this move!
Moving forward, we can see that daily price has reconnected with resistance plotted at 107.32. A violation of this line could lead to a move being seen up to daily resistance at 108.52. Over on the weekly timeframe, price remains trading around the upper edge of a weekly support zone at 105.19-107.54. As mentioned in Monday’s report, this could prompt USD buying this week and potentially target a weekly supply zone pegged at 110.48-108.68.
Potential trading zones:
Medium/long term this is a somewhat tricky market to trade at the moment. The threat of a selloff from the current daily resistance at 107.32 could prevent weekly price from advancing.
Short-term moves, however, could be seen off of the 107 handle at the point it converges with the H4 trendline support mentioned above (marked in green), targeting the H4 mid-level resistance at 107.50.
Data points to consider today: US CPI m/m and FOMC meeting minutes.
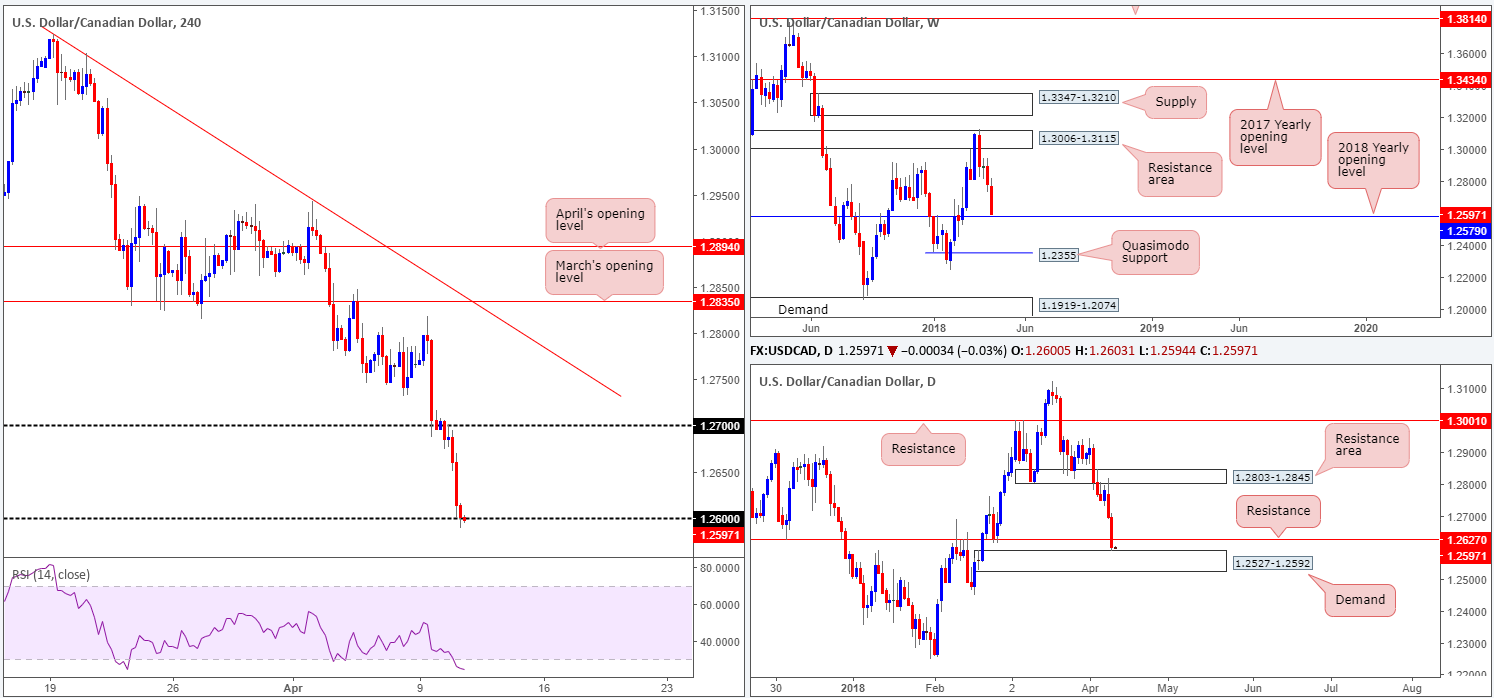
USD/CAD:
On the back of a waning USD and robust oil prices, the USD/CAD tumbled lower on Tuesday.
From the top, this has seen weekly price trade within striking distance of the 2018 yearly opening level at 1.2579. Down on the daily timeframe, latest movement has pressed through daily support at 1.2627 and bumped heads with a nearby daily demand zone coming in at 1.2527-1.2592. H4 flow, as anticipated, sold off sub 1.27 and eventually connected with 1.26 into the closing bell.
Given the 2018 yearly opening level positioned at 1.2579, which is located within the top edge of the aforementioned daily demand, further downside could be a challenge this week.
Potential trading zones:
While we clearly see the pair is in a rather dominant downtrend at the moment, we believe a recovery could be in the midst. The current daily demand, along with the 2018 yearly opening level, are considered significant barriers. However, we will not be convinced UNTIL a DAILY close is seen back above the daily resistance level mentioned above at 1.2627.
So, just to recap, we would be hesitant selling this market knowing what structure lies beneath. Traders should also exercise caution buying until we witness a meaningful move to the upside (a close above the daily resistance).
Data points to consider today: US CPI m/m and FOMC meeting minutes; Crude oil inventories.
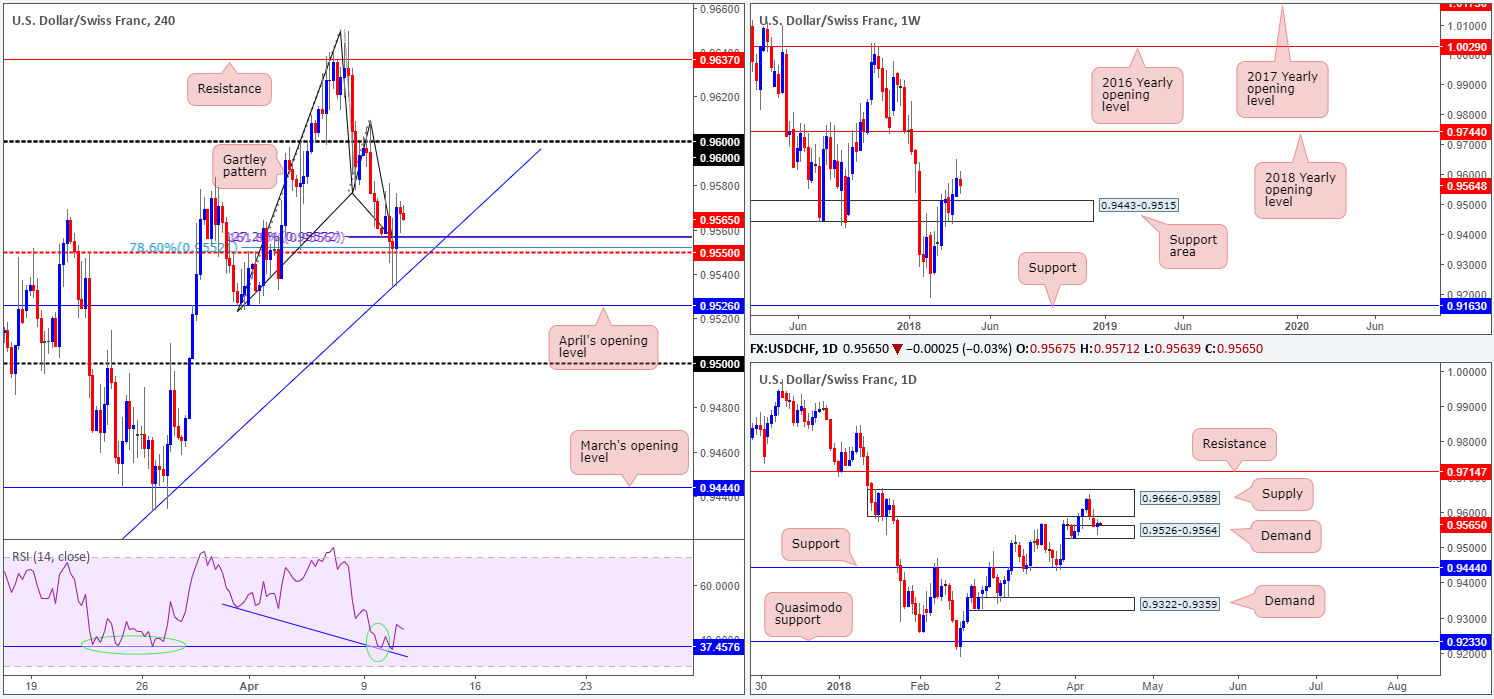
USD/CHF:
As is evident from the H4 timeframe this morning, the H4 harmonic Gartley bullish completion point at 0.9552/0.9557 held firm, despite a push lower to bring in a H4 trend line support extended from the low 0.9187. Accompanied by H4 RSI divergence and RSI support – a local daily demand area plotted at 0.9526-0.9564 – as well as room for weekly price to continue punching as far north as the 2018 yearly opening level at 0.9744, a move higher could be on the cards today.
Potential trading zones:
With stop-loss orders positioned below April’s opening level on the H4 timeframe at 0.9526, a long from the current H4 harmonic Gartley buy zone is still high probability, in our opinion. The next upside target can be seen around the underside of a nearby daily supply at 0.9589, followed by 0.96 on the H4 timeframe. The ultimate take-profit target, though, could be set at 0.9744: the 2018 yearly opening level mentioned above.
Data points to consider today: US CPI m/m and FOMC meeting minutes.
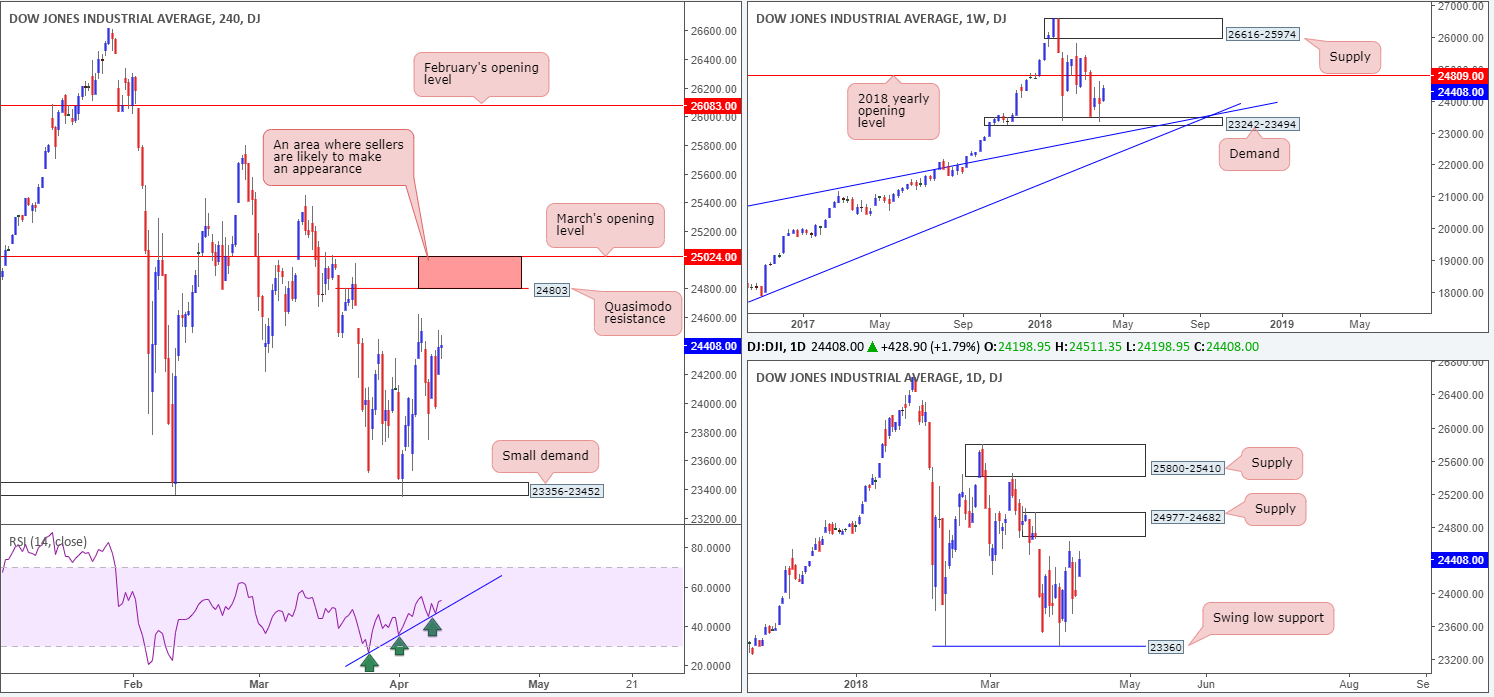
DOW 30:
The Dow Jones Industrial Average opened sharply higher on Tuesday, supported by easing trade concerns between the US and China. The risk tone was more constructive following comments from China’s President Xi signaling that China would continue to open-up its economy. Later in the session, China’s Business Journal reported that the country was considering cutting auto import tariffs by 50% (taking it to around 12.5%), which was welcomed by US President Trump.
Looking at the index from the weekly timeframe, the unit is on track to retest the 2018 yearly opening level at 24809. Daily movement, on the other hand, is trading within striking distance of a daily supply zone coming in at 24977-24682, which happens to house the noted 2018 yearly opening level. On the H4 timeframe, a H4 Quasimodo resistance at 24803 continues to station itself above current price, followed by March’s opening level at 25024. It might also be worth noting that the H4 RSI trend line support remains intact.
Potential trading zones:
The area between March’s opening level at 25024 and the H4 Quasimodo resistance at 24803 is interesting (marked in red). Not only does the area house the 2018 yearly opening level mentioned above at 24809, it also has connections with the current daily supply zone. For this reason, selling could materialize from 25024/24803 in upcoming trade.
Data points to consider today: US CPI m/m and FOMC meeting minutes.
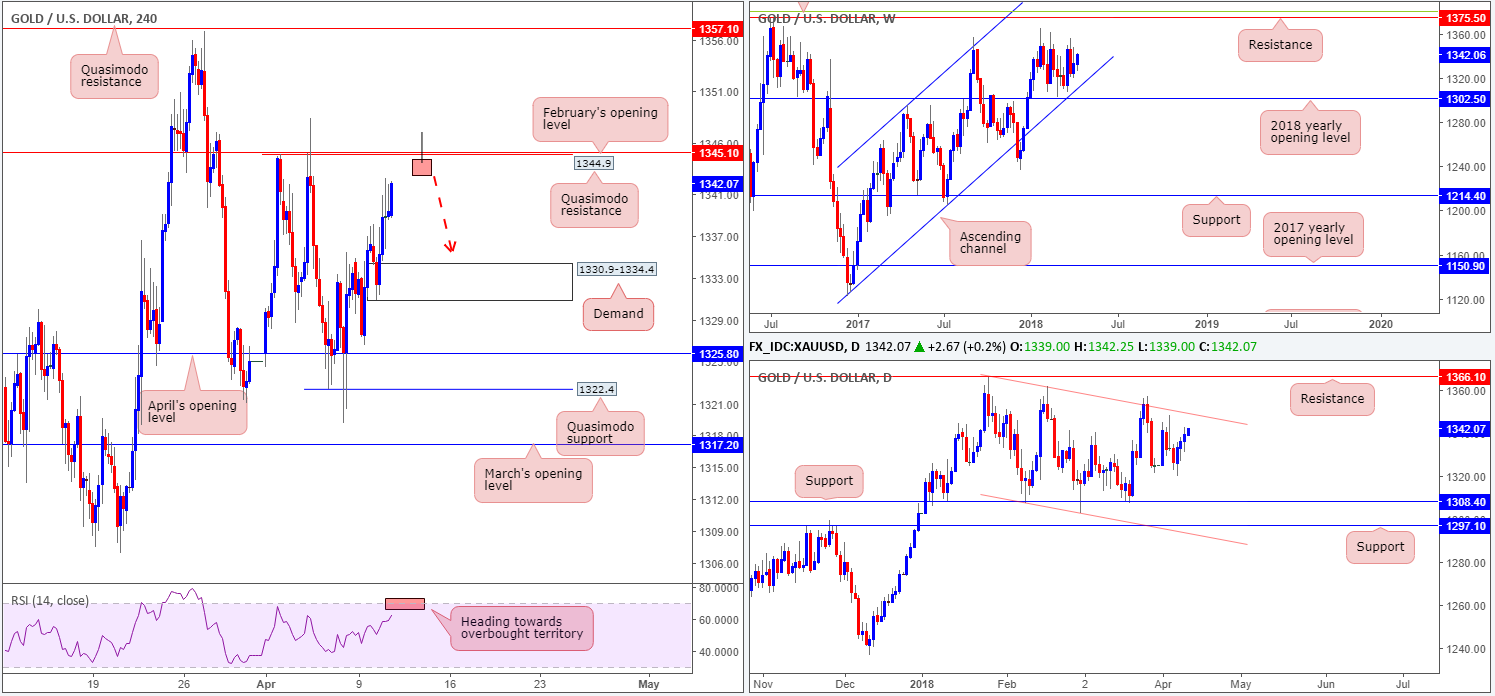
GOLD:
As the US dollar continues to decrease in value, the price of gold has advanced.
On the H4 timeframe, this has placed the candles just south of a H4 Quasimodo resistance level at 1344.9, shadowed closely by February’s opening level at 1345.1. While this is a nice-looking sell zone, which will likely be accompanied by a H4 RSI overbought reading, traders may want to pencil in a possible fakeout. Why? Well, check out where daily price is currently trading: just ahead of a daily channel resistance etched from the high 1366.0. This could, technically speaking, act as a magnet to price.
Up on the weekly timeframe, we’re unable to garner much in terms of direction since weekly price remains floating between the 2018 yearly opening level at 1302.5 (fuses closely with a long-term weekly channel support etched from the low 1122.8) and a weekly resistance pegged at 1375.5/38.2% weekly Fib resistance at 1381.0 (green line).
Potential trading zones:
On account of the above information, the team has noted to keep a watchful eye on the aforesaid H4 Quasimodo resistance level. Should a H4 bearish pin-bar formation take shape (see chart for a visual representation) that pierces through the Quasimodo and tags the daily channel resistance, a short from here is high probability, targeting H4 demand at 1330.9-1334.4 as the initial take-profit zone.
This site has been designed for informational and educational purposes only and does not constitute an offer to sell nor a solicitation of an offer to buy any products which may be referenced upon the site. The services and information provided through this site are for personal, non-commercial, educational use and display. IC Markets does not provide personal trading advice through this site and does not represent that the products or services discussed are suitable for any trader. Traders are advised not to rely on any information contained in the site in the process of making a fully informed decision.
This site may include market analysis. All ideas, opinions, and/or forecasts, expressed or implied herein, information, charts or examples contained in the lessons, are for informational and educational purposes only and should not be construed as a recommendation to invest, trade, and/or speculate in the markets. Any trades, and/or speculations made in light of the ideas, opinions, and/or forecasts, expressed or implied herein, are committed at your own risk, financial or otherwise.
The use of the site is agreement that the site is for informational and educational purposes only and does not constitute advice in any form in the furtherance of any trade or trading decisions.
The accuracy, completeness and timeliness of the information contained on this site cannot be guaranteed. IC Markets does not warranty, guarantee or make any representations, or assume any liability with regard to financial results based on the use of the information in the site.
News, views, opinions, recommendations and other information obtained from sources outside of www.icmarkets.com.au, used in this site are believed to be reliable, but we cannot guarantee their accuracy or completeness. All such information is subject to change at any time without notice. IC Markets assumes no responsibility for the content of any linked site. The fact that such links may exist does not indicate approval or endorsement of any material contained on any linked site.
IC Markets is not liable for any harm caused by the transmission, through accessing the services or information on this site, of a computer virus, or other computer code or programming device that might be used to access, delete, damage, disable, disrupt or otherwise impede in any manner, the operation of the site or of any user’s software, hardware, data or property.


