
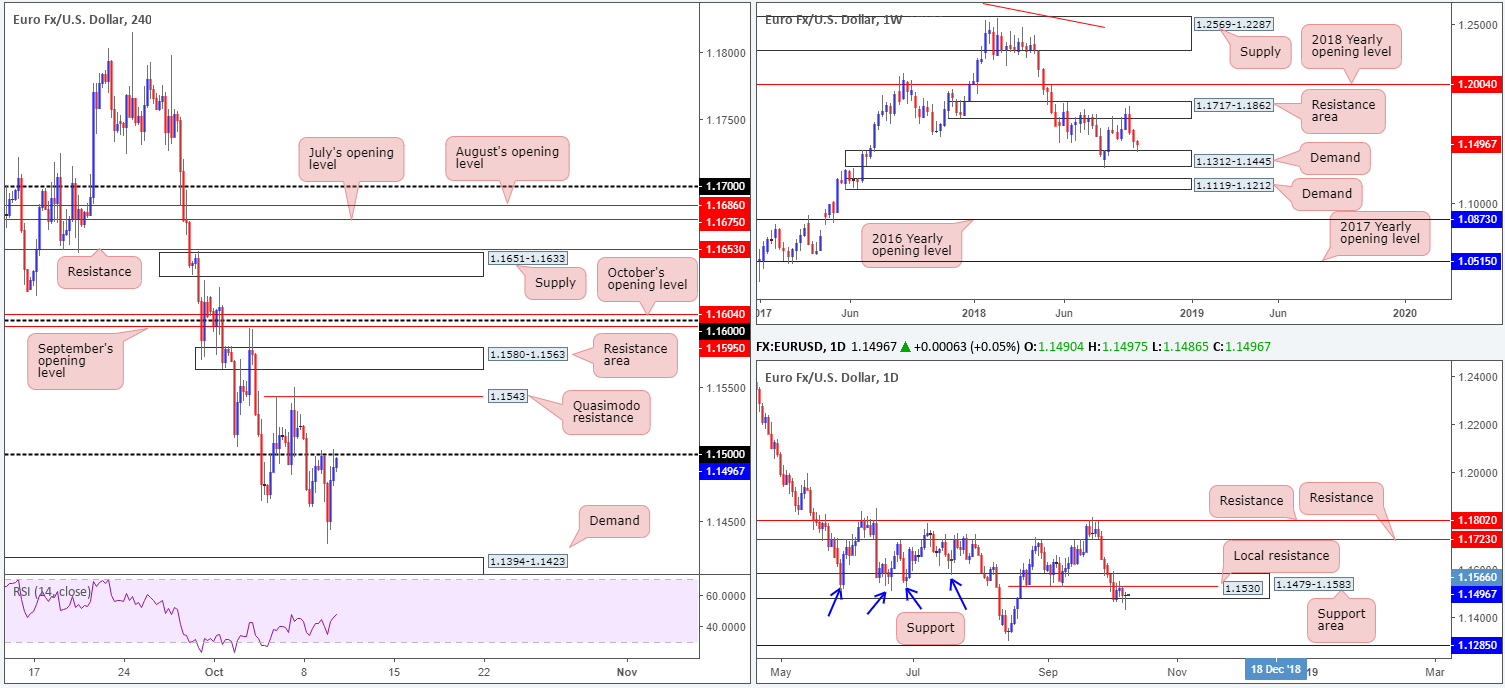
EUR/USD:
For folks who read Tuesday’s briefing you may recall the team underscored 1.15 as a possible contender for a retest play as resistance on the H4 timeframe. The reasoning behind the approach stemmed largely from higher-timeframe structure. Weekly movement displayed room to move as far south as a demand base coming in at 1.1312-1.1445. In conjunction with this, the lower edge of a daily support area at 1.1479-1.1583 suffered numerous breaks to the downside (likely weakening buyer intent) after failing to overthrow nearby local resistance at 1.1530.
In the early hours of Europe yesterday, as you can see, the H4 candles shook hands with the underside of 1.15 and sank to lows of 1.1432 – levels not seen since late August – missing nearby H4 demand by a hair at 1.1394-1.1423. Well done to any of our readers who managed to jump aboard this move!
Areas of consideration:
As expected, the aforementioned weekly demand area offered a floor to this market, lifting the EUR/USD back towards its starting point for the day: the 1.15 handle. It might also be worth noting the daily timeframe produced a nice-looking bullish pin-bar formation during yesterday’s movement.
With weekly demand in play, a resurgence of bidding may be observed today/this week. Despite this, considerable obstacles lie in the way of further upside on both H4 and daily structure, cautioning an exuberantly bullish approach. First among these is the 1.15 handle. A violation of 1.15 to the upside, nevertheless, has a H4 Quasimodo resistance level at 1.1543 to target, tailed closely by a H4 resistance area plotted at 1.1580-1.1563. Before reaching these points, however, buyers will also need to grapple with local resistance mentioned above on the daily timeframe at 1.1530.
To that end, although we’re coming from weekly demand at this point, a cautionary approach above 1.15 is recommended today, traders.
Today’s data points: FOMC members Williams and Bostic speak; US PPI figures m/m; US Treasury currency report.
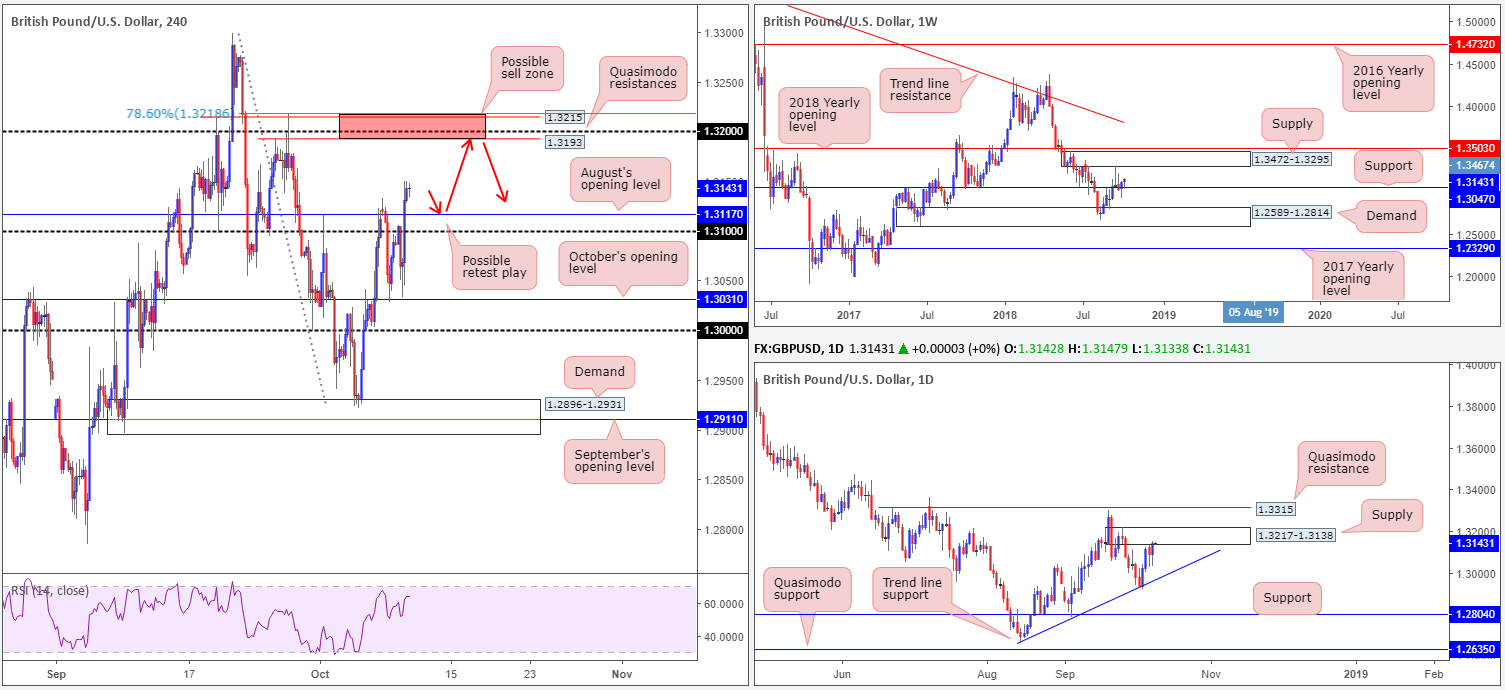
GBP/USD:
Leaving October’s opening level at 1.3031 (support) on the H4 timeframe unchallenged, sterling overthrew its 1.31 handle and August’s opening level (resistance) at 1.3117 on Tuesday, and rallied to highs of 1.3150 on news the divorce terms with the EU could be settled by Monday.
Recent movement has positioned the H4 candles in a favourable setting for additional upside today, targeting the 1.32 region, specifically the red H4 sell zone at 1.3218-1.3193 (comprised of a 78.6% H4 Fib resistance value at 1.3218, a H4 Quasimodo resistance at 1.3215, the 1.32 handle and another H4 Quasimodo resistance at 1.3193). In addition to this, traders may also want to acknowledge the H4 zone is sited within the upper limits of daily supply marked at 1.3217-1.3138.
Areas of consideration:
Two points of interest are stand out this morning for possible trading opportunities:
- A bullish retest play off 1.31/1.3117 could be in store today, targeting the H4 red zone at 1.3218-1.3193. While weekly action is supportive – shows room to extend as far north as supply at 1.3472-1.3295 – do remain aware of daily supply in play at 1.3217-1.3138!
- Although the red H4 zone at 1.3218-1.3193 is situated in the market before the weekly supply at 1.3472-1.3295 enters the fight, 1.3218-1.3193 is still highly likely to produce a bounce lower due to the aforesaid converging levels that make up its base, including the current daily supply.
While both highlighted zones will likely offer at least a bounce, conservative traders may elect to wait for additional candlestick confirmation before pulling the trigger.
Today’s data points: UK growth figures; UK manufacturing production m/m; MPC member Haldane speaks; FOMC members Williams and Bostic speak; US PPI figures m/m; US Treasury currency report.
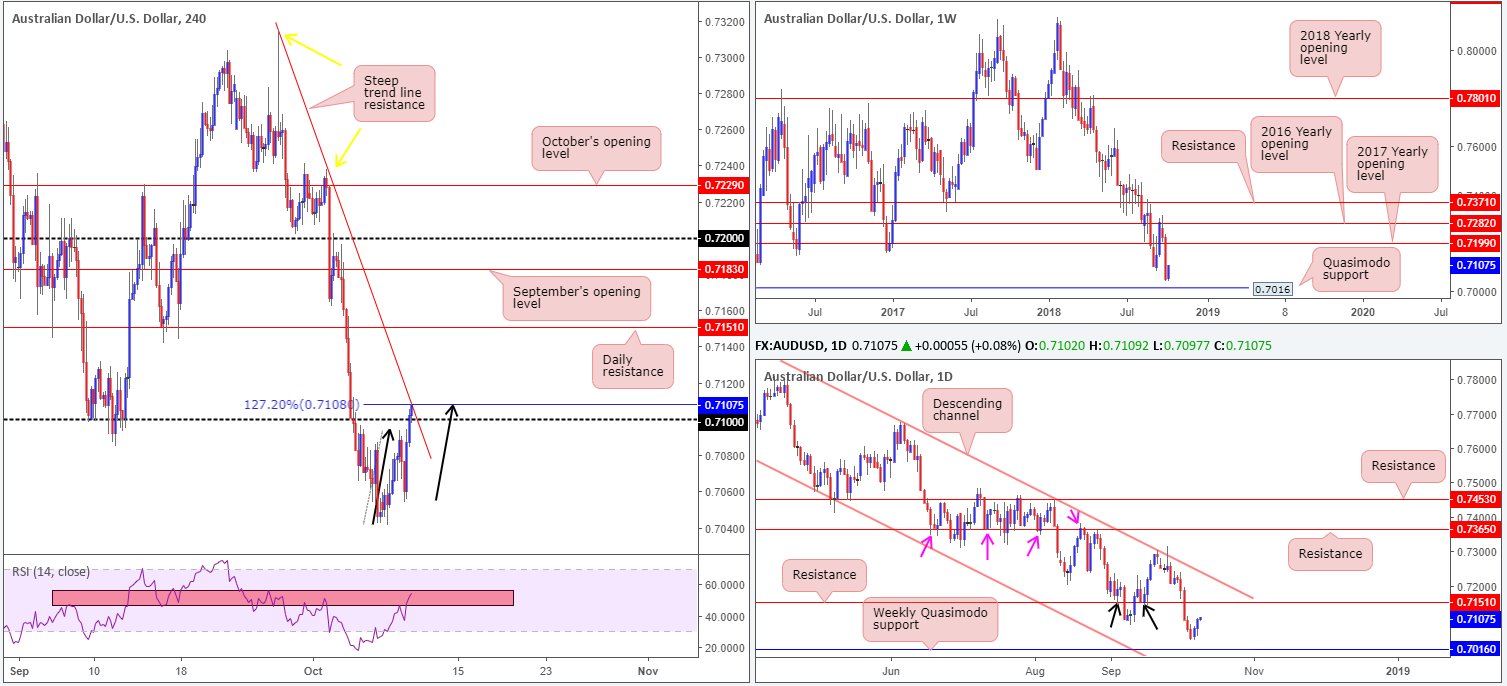
AUD/USD:
The Australian dollar extended Monday’s gains vs. its US counterpart on Tuesday, concluding the session a smidgen above its 0.71 handle on the H4 timeframe. While this has likely tripped a truckload of stop-loss orders above 0.71 and filled breakout buyers’ orders, a minor pullback could be in store. As you can see on the H4 chart, price recently completed a bearish AB=CD (black arrows) 127.2% (Fib ext.) pattern at 0.7108 that intersects with a steep trend line resistance (taken from the high 0.7315). Also of note is the RSI indicator is seen testing a resistance area around the 56.46/46.87 region.
Why only a ‘minor’ pullback may take place comes from the higher-timeframe structure showing room to press higher. Weekly price could potentially drag this market towards its 2017 yearly opening level at 0.7199, while daily price has a barrier of resistance situated around the 0.7151 mark.
Areas of consideration:
In the event H4 price pencils in a bearish candlestick formation that closes beneath 0.71, this may be a worthy candidate for intraday shorts using the AB=CD pattern for take-profit levels (38.2%/61.8% value of legs A-D).
In the event higher-timeframe flows support further upside today, nevertheless, traders may want to consider longs on any retest (preferably in the shape of a H4 bullish candlestick formation) seen at 0.71.
Stop/entry parameters, for either setup, are likely best dictated by the selected candlestick formation.
Today’s data points: FOMC members Williams and Bostic speak; US PPI figures m/m; US Treasury currency report.
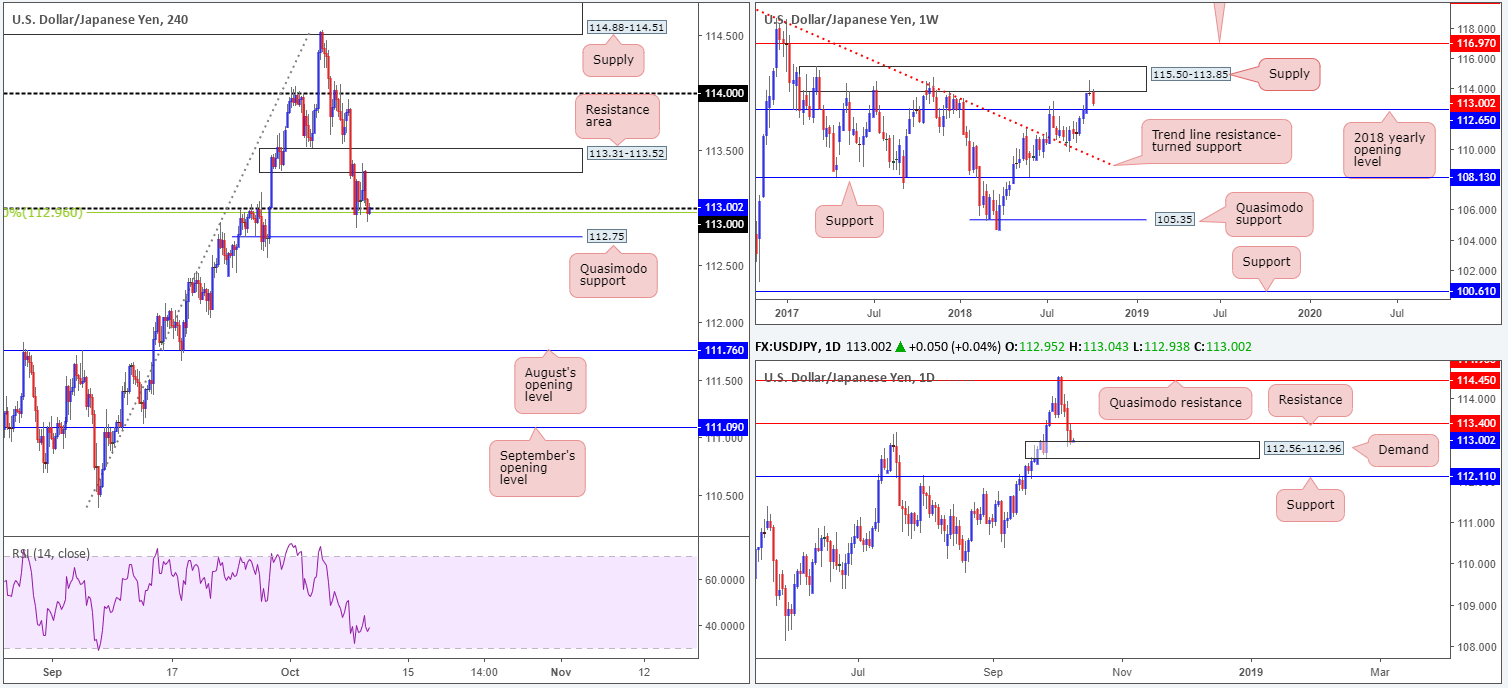
USD/JPY:
Although the USD/JPY chalked up its fourth consecutive loss, overall structure in this market remains unchanged.
Weekly flow remains poised to approach its 2018 yearly opening level at 112.65. This comes after the market engaged with a notable supply at 115.50-113.85 last week (boasts notable history, capping upside on a number of occasions throughout 2017) in the shape of a bearish pin-bar pattern.
In terms of where we stand on the daily timeframe, a nice-looking demand zone at 112.56-112.96 entered the fold recently, following a violent break of nearby support at 113.40 (now acting resistance).
Our technical studies on the H4 timeframe show price continues to range between its 113 handle/ 38.2% Fib support at 112.96 and a demand-turned resistance area at 113.31-113.52 (houses daily resistance within at 113.40). Beneath 113 we have a nearby Quasimodo support in view at 112.75, which happens to be positioned ten pips above the 2018 yearly opening level on the weekly timeframe at 112.65.
Areas of consideration:
Overall, the focus remains on the 2018 yearly opening level at 112.65 based on the weekly timeframe, as it is seen positioned within daily demand mentioned above at 112.56-112.96. With stop-loss orders located just beneath the current daily demand at 112.54, a bounce from 112.65 is likely. Ultimately, the first take-profit target can be seen around daily resistance at 113.40, which you may recall resides within the H4 resistance area at 113.31-113.52. This, should the trade come to fruition, offers incredible risk/reward in only a small move!
Today’s data points: FOMC members Williams and Bostic speak; US PPI figures m/m; US Treasury currency report.
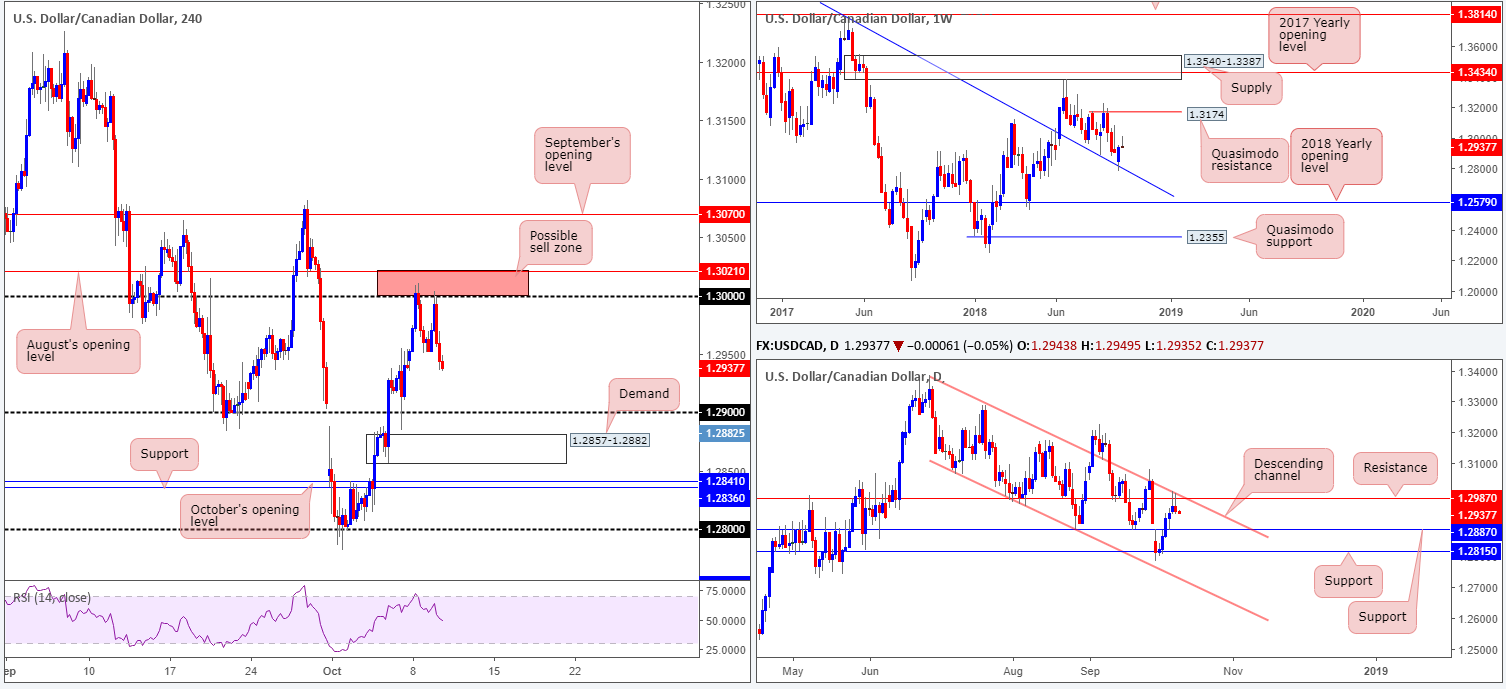
USD/CAD:
On the back of a move higher in crude oil, the USD/CAD penciled in its second consecutive daily bearish pin-bar formation during the course of Tuesday’s sessions. What’s also notable from a technical perspective is the candlesticks took shape from a daily channel resistance (taken from the high 1.3386) and its converging resistance level priced in at 1.2987. The next downside target from here can be seen at support chalked in at 1.2887.
Daily structure was largely responsible for the selection of 1.3021/1.30 on Monday as a possible sell zone (comprised of August’s opening level and a round number). As you can see, the area held for a second time yesterday, pushing to lows of 1.2936. Well done to any of our readers who managed to jump aboard this train!
Areas of consideration:
We see very little to hang our hat on in terms of anything stopping the H4 candles from reaching its 1.29 handle today, followed closely by the daily support mentioned above at 1.2887. The only grumble is the weekly timeframe: its recent response off the trend line resistance-turned support (extended from the high 1.4689), with room to press as high as a Quasimodo resistance level parked at 1.3174. At present, though, weekly price is in the process of drawing up a bearish pin-bar pattern.
Those looking to pursue a long position off of 1.29, do remain cognizant of a possible fakeout beyond this number to H4 demand plotted nearby at 1.2857-1.2882. One can only imagine how many stop-loss orders are positioned beneath 1.29!
Given the current daily support level is sited only a few pips above the noted H4 demand, the H4 area would actually be considered a high-probability base for longs. Aggressive traders will likely enter at market from 1.2882 (stops beneath 1.2857), with eyes on a H4 close back above 1.29. Conservative traders, however, may want to wait and see if H4 price prints a bullish candlestick formation prior to pressing the buy button (stop/entry in this case are likely best dictated by the selected candlestick formation).
Today’s data points: FOMC members Williams and Bostic speak; US PPI figures m/m; US Treasury currency report.
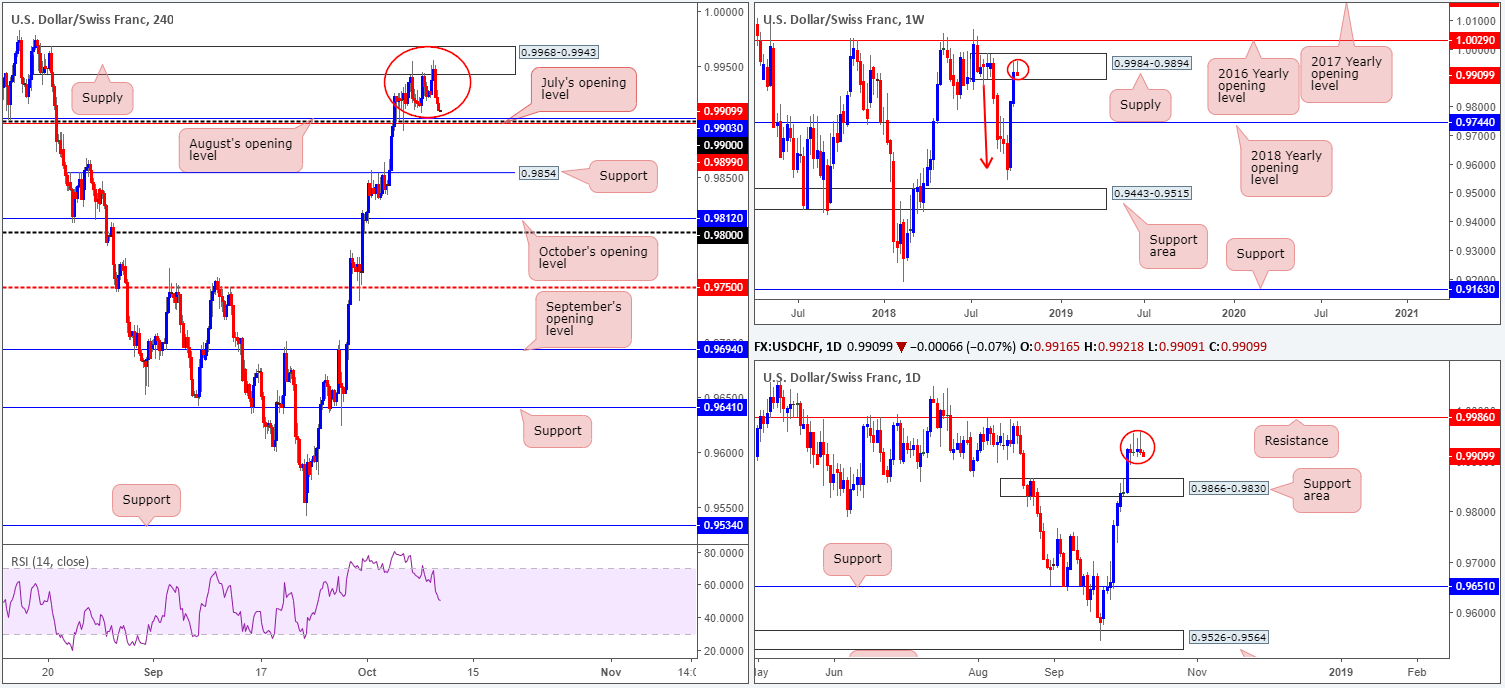
USD/CHF:
Since the beginning of the week, USD/CHF movement has emphasized a subdued tone, ranging between H4 supply at 0.9968-0.9943 and its 0.99 handle. Traders might also want to acknowledge 0.99 is shadowed closely by two monthly opening levels from August and July at 0.9903 and 0.9899, respectively. In light of the somewhat lackluster performance, much of the following report will echo thoughts put forward in recent analysis.
On the higher timeframes, weekly players are seen interacting with supply at 0.9984-0.9894, by way of a potential bearish pin-bar pattern. A closer look at price action on the daily timeframe shows three consecutive bearish pin-bar formations have taken shape in recent trade – the last being the more defined of the three. While we know these patterns have taken shape within the aforementioned weekly supply, on the daily scale room to move north is seen towards resistance coming in at 0.9986 (sited two pips above the weekly supply). Should the pair push lower this week, however, the first area of concern can be seen at a support zone carved from 0.9866-0.9830.
Areas of consideration:
Regardless of the fact daily price could advance to test its resistance level at 0.9986, H4 and weekly price are both seen selling off from supply. Couple this with back-to-back daily bearish pin-bar formations, we potentially have ourselves some strong sellers in the mix.
A H4 close beneath 0.99 is considered a bearish cue, given the overall picture. A retest of this number in the shape of a bearish candlestick formation would likely be enough to encourage sellers into the market. The only grumble here is limited space to maneuver. Close at hand, we have the top edge of a daily support area at 0.9866, followed closely by H4 support at 0.9854. Beyond here, the team would be eyeing October’s opening level at 0.9812, followed closely by the 0.98 mark as the next support targets.
Traders are urged to consider risk/reward parameters before pulling the trigger to short beneath 0.99. If you’re unable to lock in at least 1:1 to the first take-profit zone (0.9866), it may be best to pass and wait for something a little more substantial to come along.
Today’s data points: FOMC members Williams and Bostic speak; US PPI figures m/m; US Treasury currency report.
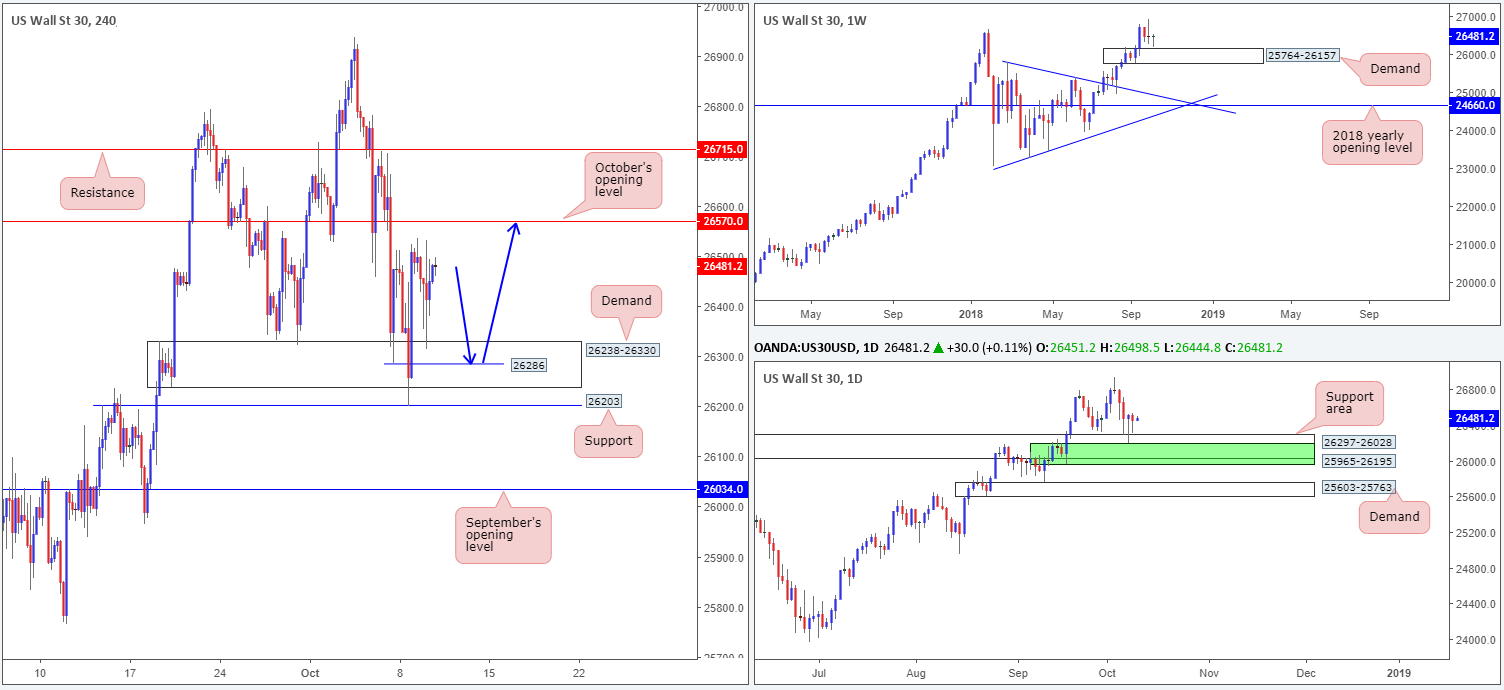
Dow Jones Industrial Average:
Following Monday’s fakeout beneath H4 demand drawn from 26238-26330, likely ripping through countless stop-loss orders, the index retested the area on Tuesday and held ground. Overhead on the H4 timeframe, the next resistance in view is October’s opening level at 26570, followed by resistance at 26715.
Bullish action, according to daily structure, is reinforced by not only a support area coming in at 26297-26028, but also demand shaded in green at 25965-26195 (both zones happen to be glued around the top edge of weekly demand at 25764-26157). What’s also notable from a technical perspective is the back-to-back daily bullish pin-bar patterns, which has likely caught the attention of candlestick enthusiasts.
Areas of consideration:
In light of daily structure, and weekly action coming within striking distance of demand mentioned above at 25764-26157, further upside is likely on the cards. Unfortunately, with October’s opening level nearby at 26570 likely to hinder upside, trading long is tricky at current price. The only alternative we see is for a second retest of H4 demand to play out, shaped in the form of a bullish candlestick pattern. Aside from displaying buyer intent, it also provides stop/entry parameters and offers (depending on the size of the bullish candlestick formation that is) reasonable risk/reward to October’s opening level.
Do bear in mind, though, there’s a strong possibility the retest of the H4 demand will likely draw price deeper into the area towards the H4 Quasimodo support at 26286 to take stops from beneath yesterday’s low at 26314.
Today’s data points: FOMC members Williams and Bostic speak; US PPI figures m/m; US Treasury currency report.
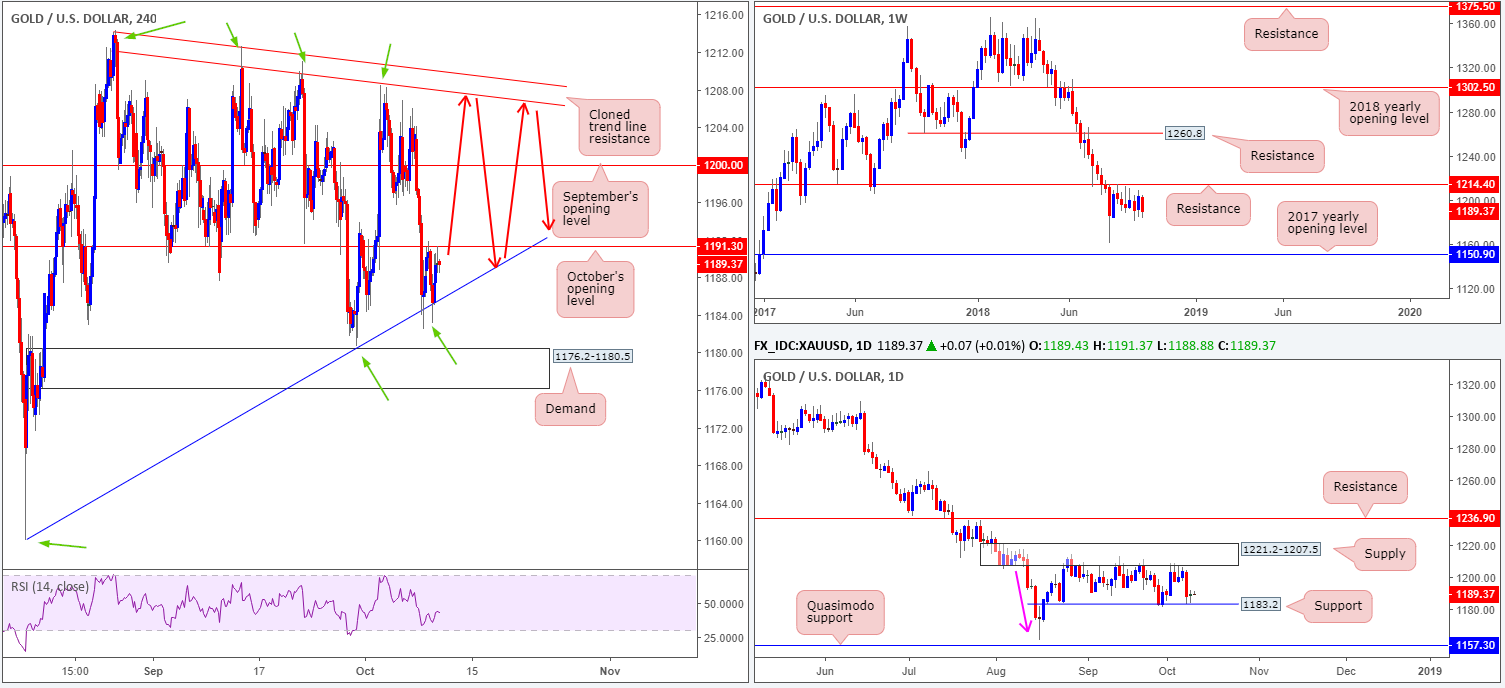
XAU/USD (Gold):
Speculative interest remains tightly sandwiched between October’s opening level at 1191.3 on the H4 timeframe and a trend line support (extended from the low 1160.3). Overall, though, the H4 candles have been compressing between this trend line support and the cloned descending lines since the beginning of October (meeting the characteristics of a bearish pennant pattern – taken from the high 1214.3).
Considering the fact price action is effectively unchanged since yesterday, much of the following report will emphasize similar points in yesterday’s briefing.
The price of gold on the weekly timeframe remains languishing beneath key resistance at 1214.4. Further selling on this scale has the 2018 yearly low of 1160.3 to target, followed closely by the 2017 yearly opening level at 1150.9. In conjunction with weekly flow, daily movement continues to respect a nice-looking supply zone at 1221.2-1207.5. Aside from the base displaying attractive downside momentum (pink arrow), this area could also be considered the ‘decision point’ to print 2018 yearly lows of 1160.3. Traders, however, are also urged to consider support on this scale: 1183.2 (which has held price higher so far this week), followed by a Quasimodo support at 1157.3.
Areas of consideration:
In light of where price is trading from on the higher timeframes, a long in this market will unlikely produce much to get excited about, despite bouncing from daily support at 1183.2.
Ultimately, traders should be looking for the H4 bearish pennant to complete and breakout south. Should this come to fruition and price engulfs H4 demand at 1176.2-1180.5, shorts are high probability at this point, targeting the 2018 yearly low of 1160.3.
Until this happens, however, the H4 bearish pennant could continue to compress (as per the red arrows), by which traders could attempt to fade till broken. However, given the likelihood of fakeout occurring around these extremes, waiting for H4 candlestick confirmation to emerge before pulling the trigger is likely the better (safer) path to take right now.
The use of the site is agreement that the site is for informational and educational purposes only and does not constitute advice in any form in the furtherance of any trade or trading decisions.
The accuracy, completeness and timeliness of the information contained on this site cannot be guaranteed. IC Markets does not warranty, guarantee or make any representations, or assume any liability with regard to financial results based on the use of the information in the site.
News, views, opinions, recommendations and other information obtained from sources outside of www.icmarkets.com.au, used in this site are believed to be reliable, but we cannot guarantee their accuracy or completeness. All such information is subject to change at any time without notice. IC Markets assumes no responsibility for the content of any linked site. The fact that such links may exist does not indicate approval or endorsement of any material contained on any linked site.
IC Markets is not liable for any harm caused by the transmission, through accessing the services or information on this site, of a computer virus, or other computer code or programming device that might be used to access, delete, damage, disable, disrupt or otherwise impede in any manner, the operation of the site or of any user’s software, hardware, data or property.


