
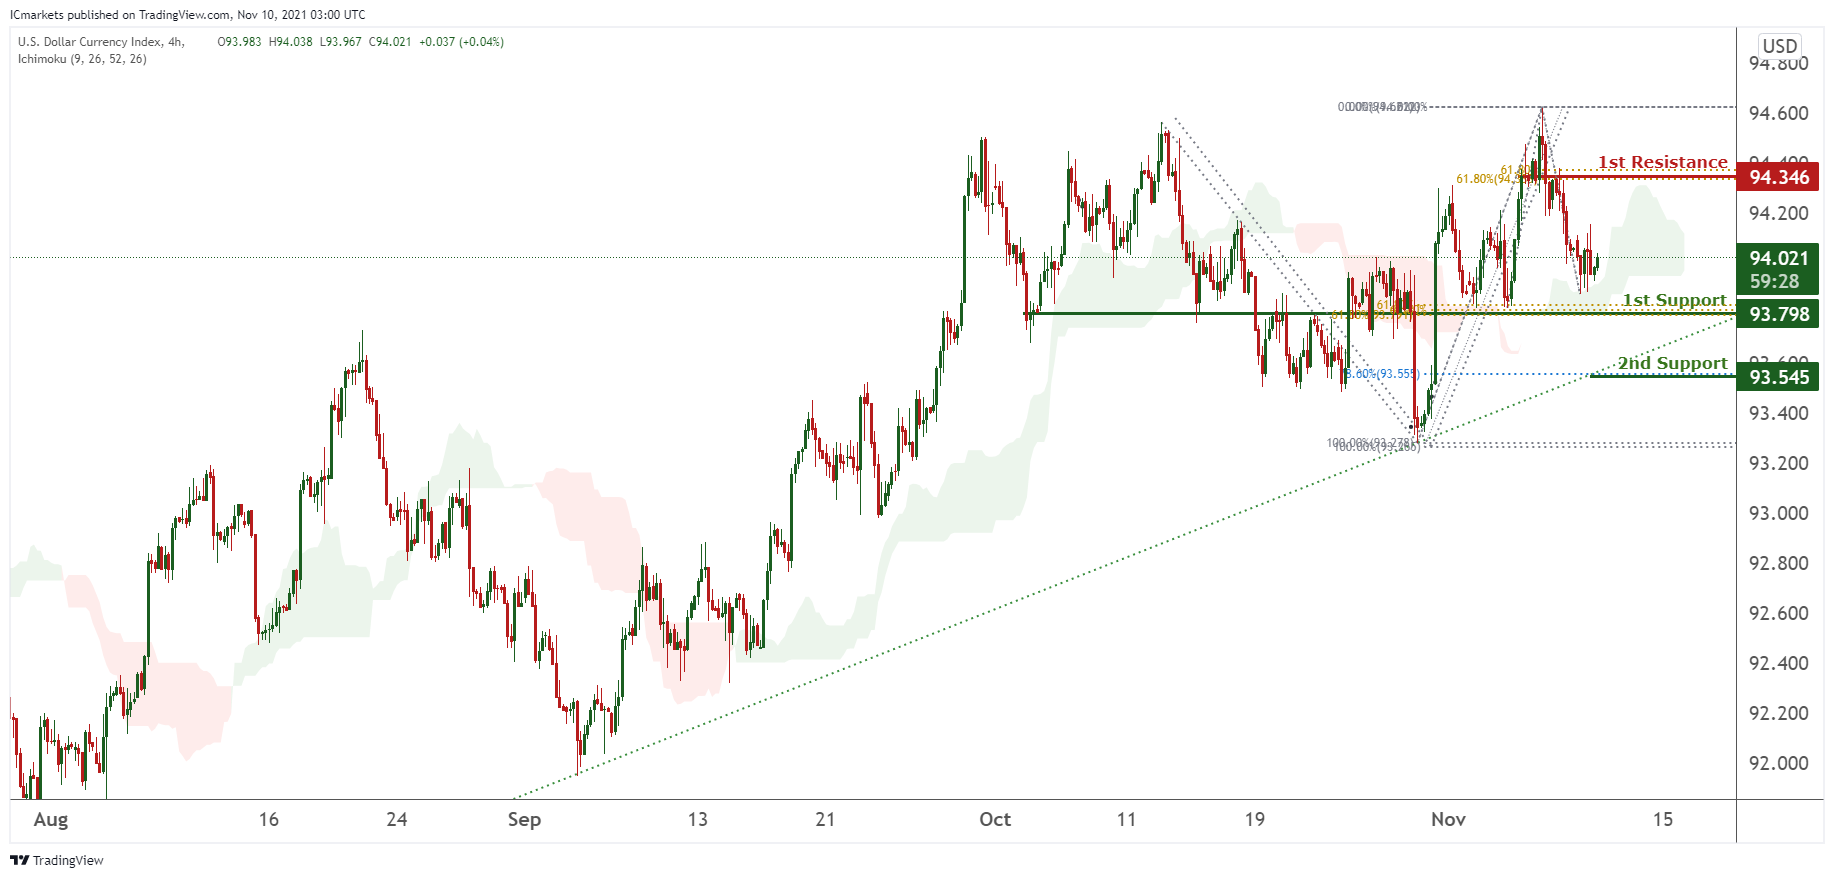
DXY:
On the H4 timeframe, prices are on a bullish momentum. We see the potential for prices to climb from 1st support at 93.798 in line with 61.8% Fibonacci retracement and 61.8% Fibonacci extension towards our 1st resistance at 94.346 in line with 61.8% Fibonacci retracement. Technical indicators are showing bullish momentum. Alternatively, as prices are hovering within a large range, we prefer to remain neutral for now.
Areas of consideration:
● H4 time frame, 1st resistance at 94.346
● H4 time frame, 1st support at 93.798
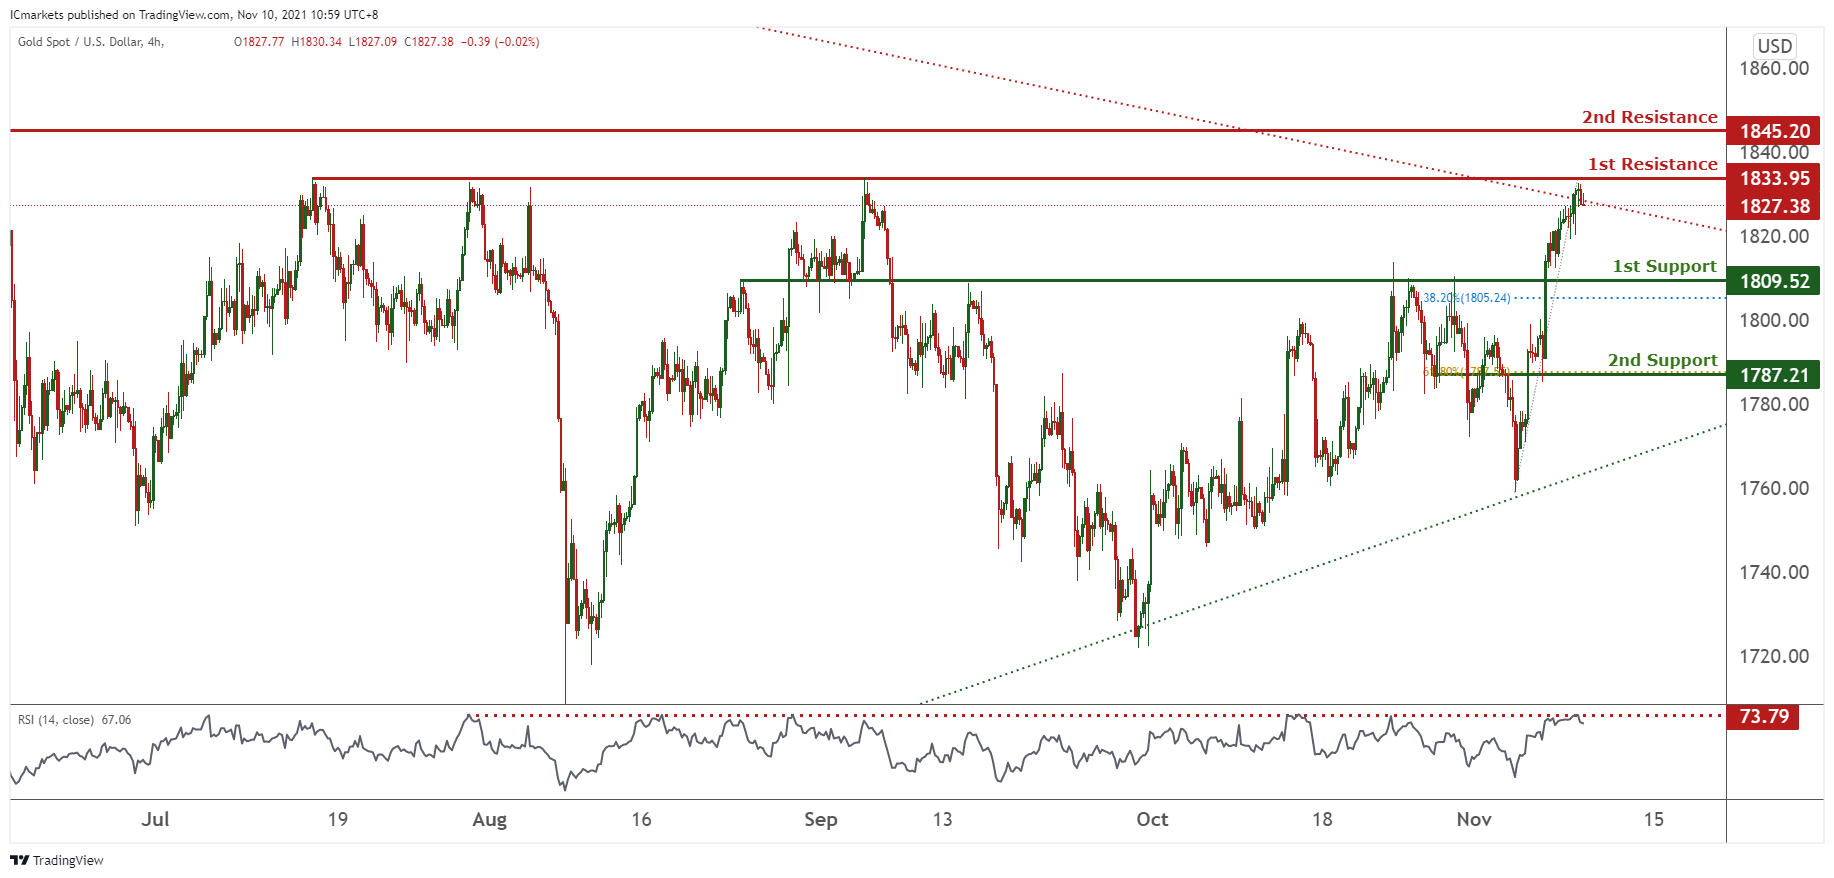
XAU/USD (GOLD):
On the H4 chart, prices are abiding to a daily triangle. We see potential for prices to dip from our 1st resistance at 1833.95 in line with 100% Fibonacci retracement towards our 1st support at 1809.52 in line with 38.2% Fibonacci retracement. Technical indicators are showing bearish momentum. Alternatively, breaking our 1st support at 1809.52 will find prices dipping towards our 2nd support at 1787.21 in line with 161.8% Fibonacci projection.
Areas of consideration:
● 4h 1st support at 1809.52
● 4h 1st resistance at 1833.95
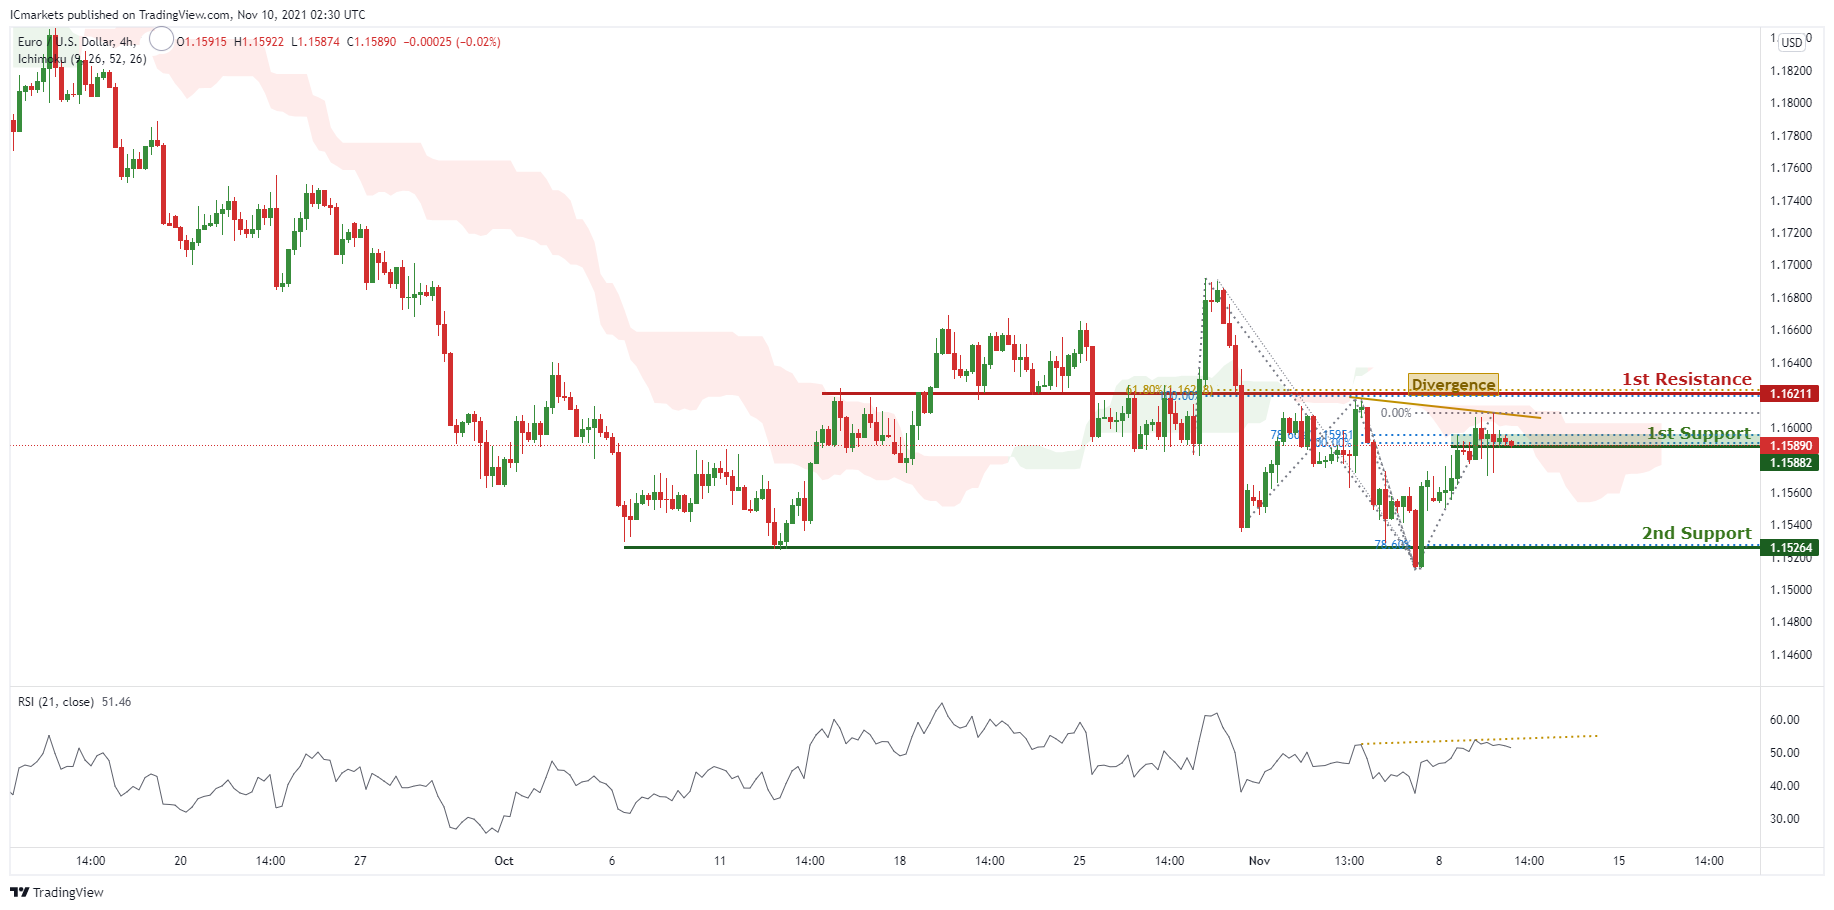
EUR/USD:
On the H4 chart, price is near the first support level of 1.15882 which is also 50% Fibonacci retracement and 78.6% Fibonacci projection. Price can potentially dip to the 2nd support level of 1.15264 which is also 78.6% Fibonacci projection. Our bearish bias is supported by RSI which shows a clear divergence. Alternatively if price can go to the first resistance level of 1.16211
Areas of consideration:
1st resistance – 1.16211
1st support – 1.15882
2nd support- 1.15264
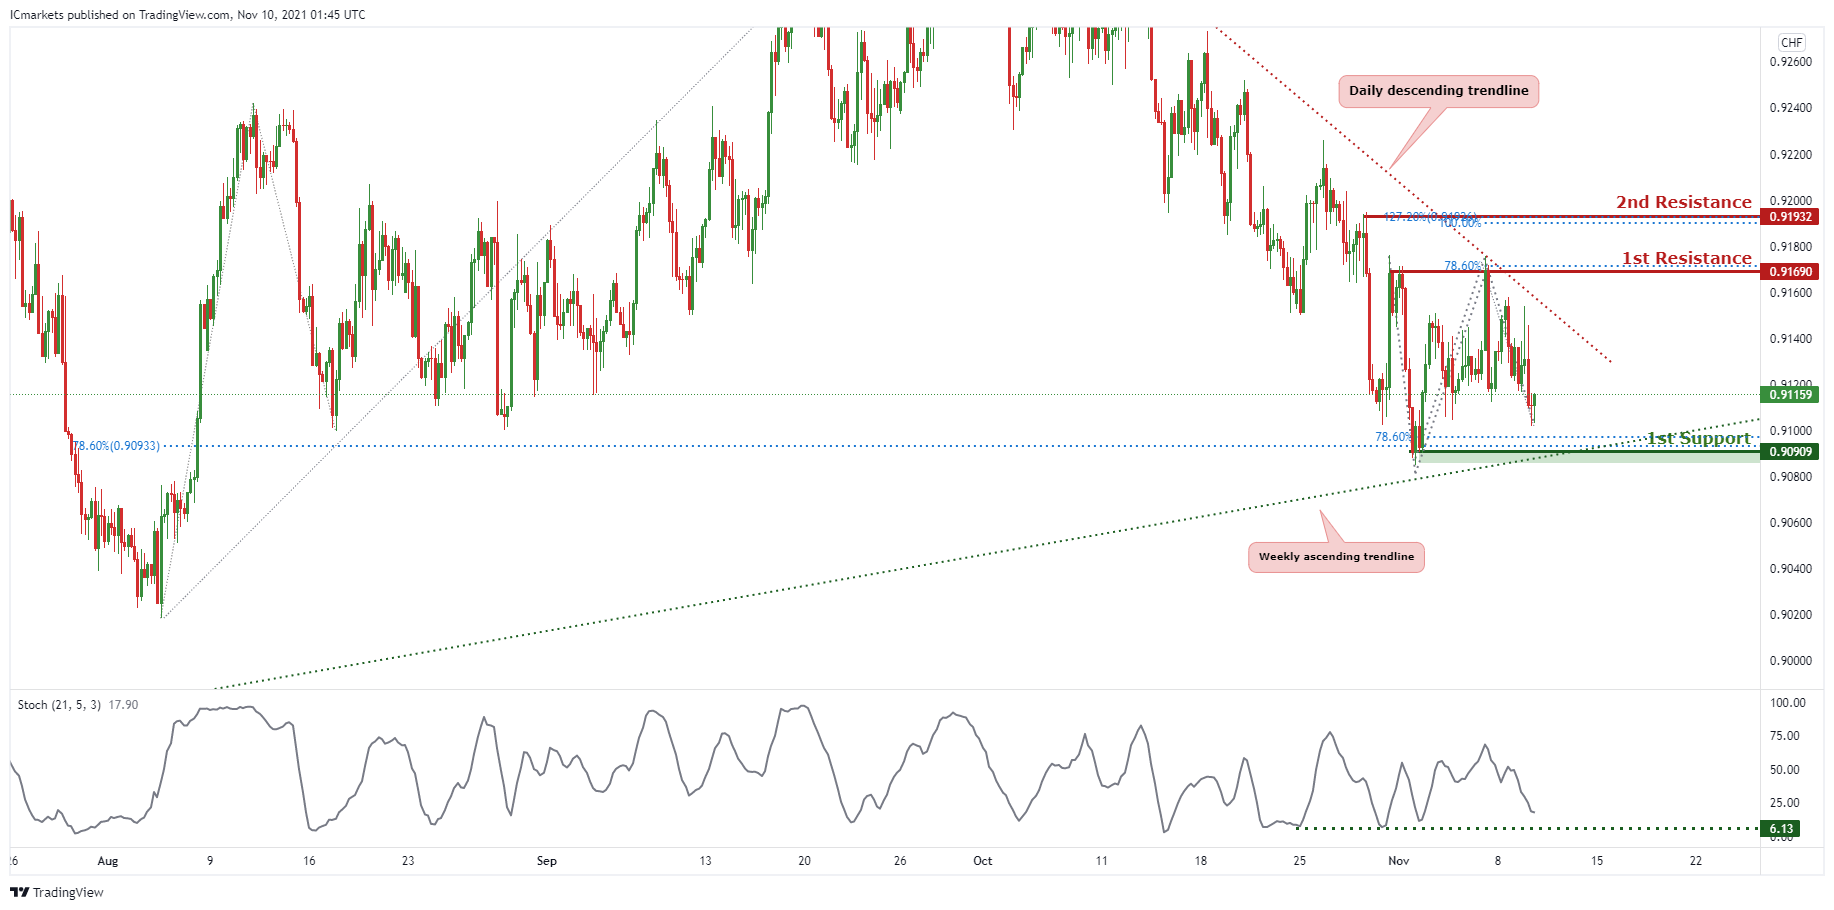
USD/CHF:
On the H4 timeframe, price is now abiding to a descending trendline resistance, signifying bearish momentum. We can now expect price to make a bounce from 1st Support in line with 78.6% Fibonacci projection and 78.6% Fibonacci retracement towards 1st resistance in line with 78.6% Fibonacci projection. Our bullish bias is further supported by the stochastic indicator %K line where it touched the support.
Areas of consideration:
● Watch 1st Support at 0.90909
● Watch 1st Resistance at 0.91690
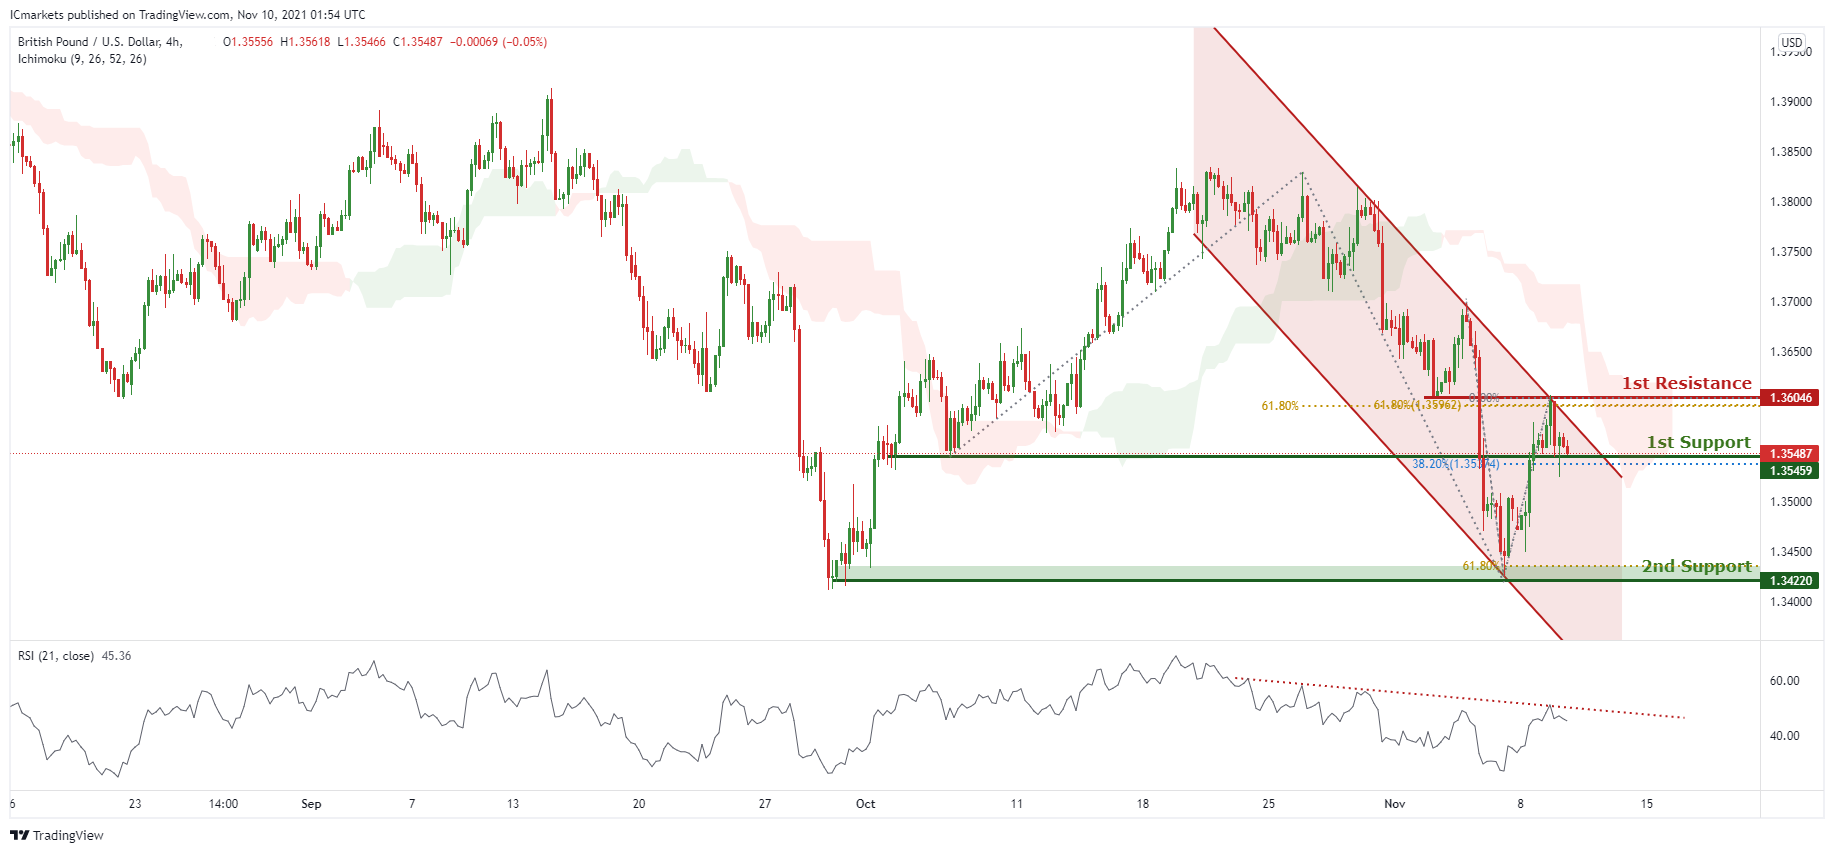
GBP/USD:
On the H4 chart price is trading in a bearish parallel channel and near the first support level of 1.35487 which is also 38.2% Fibonacci retracement. Price can potentially dip to the 2nd support level of 1.34220 which is also 61.8% Fibonacci projection. Our bearish bias is supported by the ichimoku cloud indicator as price is trading under it . Our RSI also shows a descending trendline.
Areas of consideration:
H4 first resistance – 1.36046
H4 first support – 1.35459
H4 second support – 1.34220
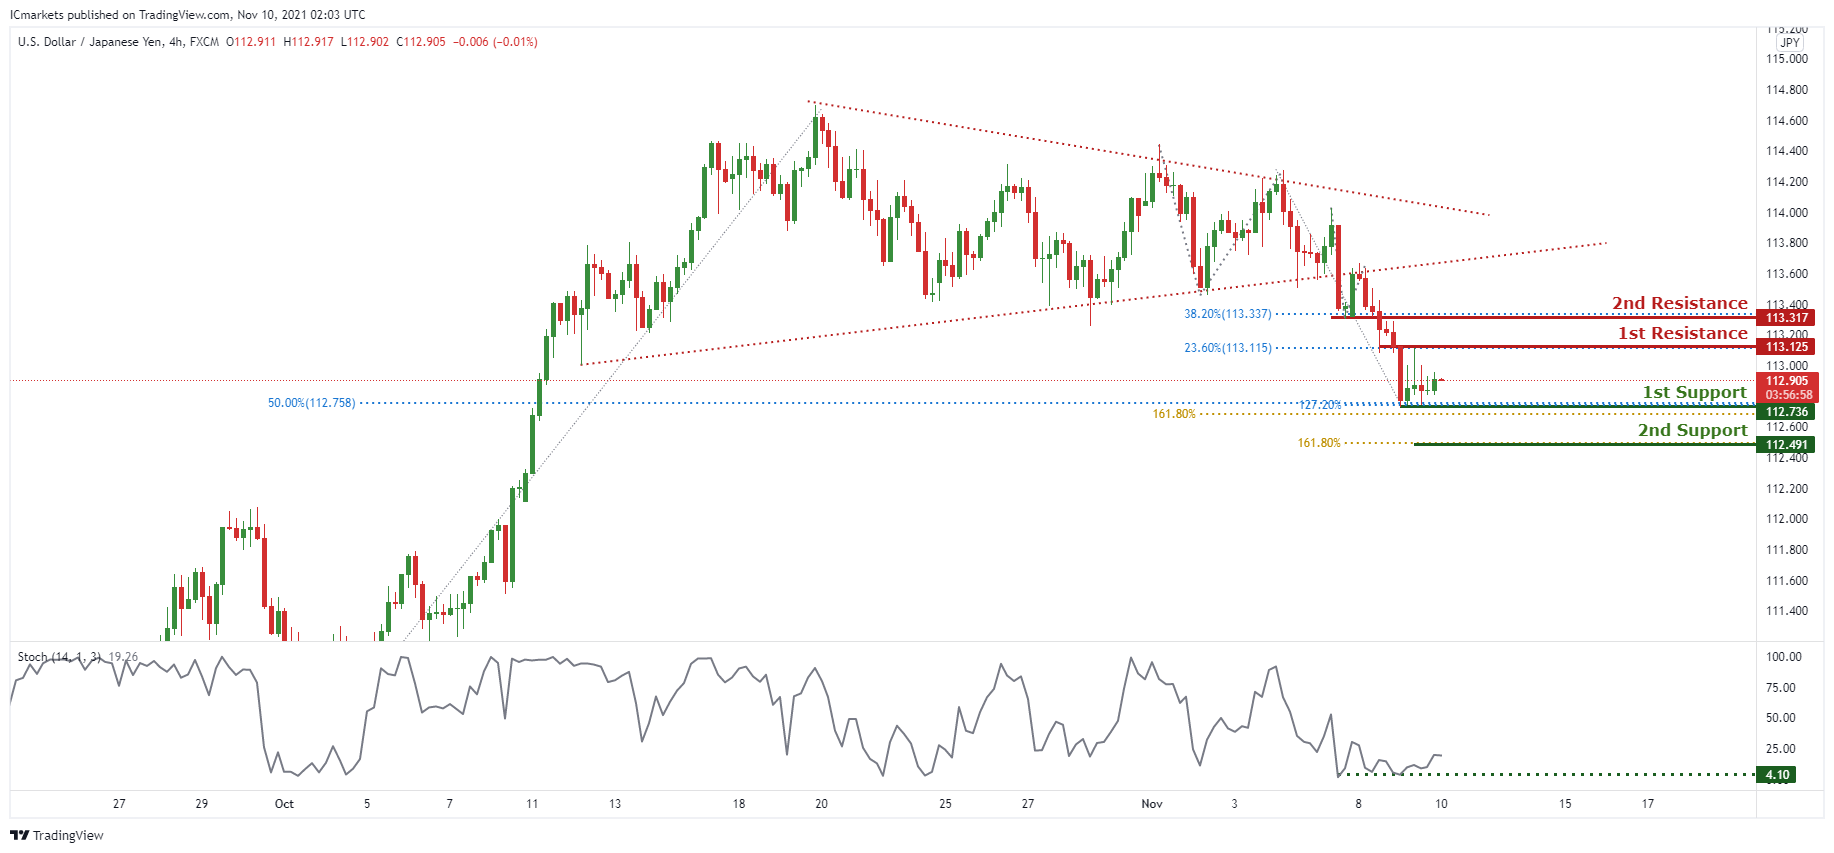
USD/JPY:
On the H4 timeframe, price is reacting in a descending channel, signifying a bearish momentum. However, we can expect price to make a short-term bullish bounce from 1st Support in line with 50% Fibonacci retracement and 161.8% Fibonacci projection towards trh 1st Resistance in line with 23.6% Fibonacci retracement. Our short-term bullish bias is further supported by the stochastic indicator where the%K line bounced off at the support level.
Areas of consideration:
● H4 1st resistance level 113.125
● H4 1st support level 112.736
AUD/USD:
On the H4, we can see that price broke past the ascending trendline support, signifying a bearish trend momentum. In reference with yesterday’s analysis indeed dropped to the 1st Support level, we can no expect price to make a small bounce from 1st Support in line with 61.8% Fibonacci projection and 50% Fibonacci retracement towards 1st Resistance in line with 50% Fibonacci retracement and 78.6% Fibonacci projection. Our short-term bullish bounce is further supported by the stochastic indicator %Kline where it is approaching the support level.
Areas of consideration:
● H4 1st resistance level 0.74218
● H4 1st support level 0.73685
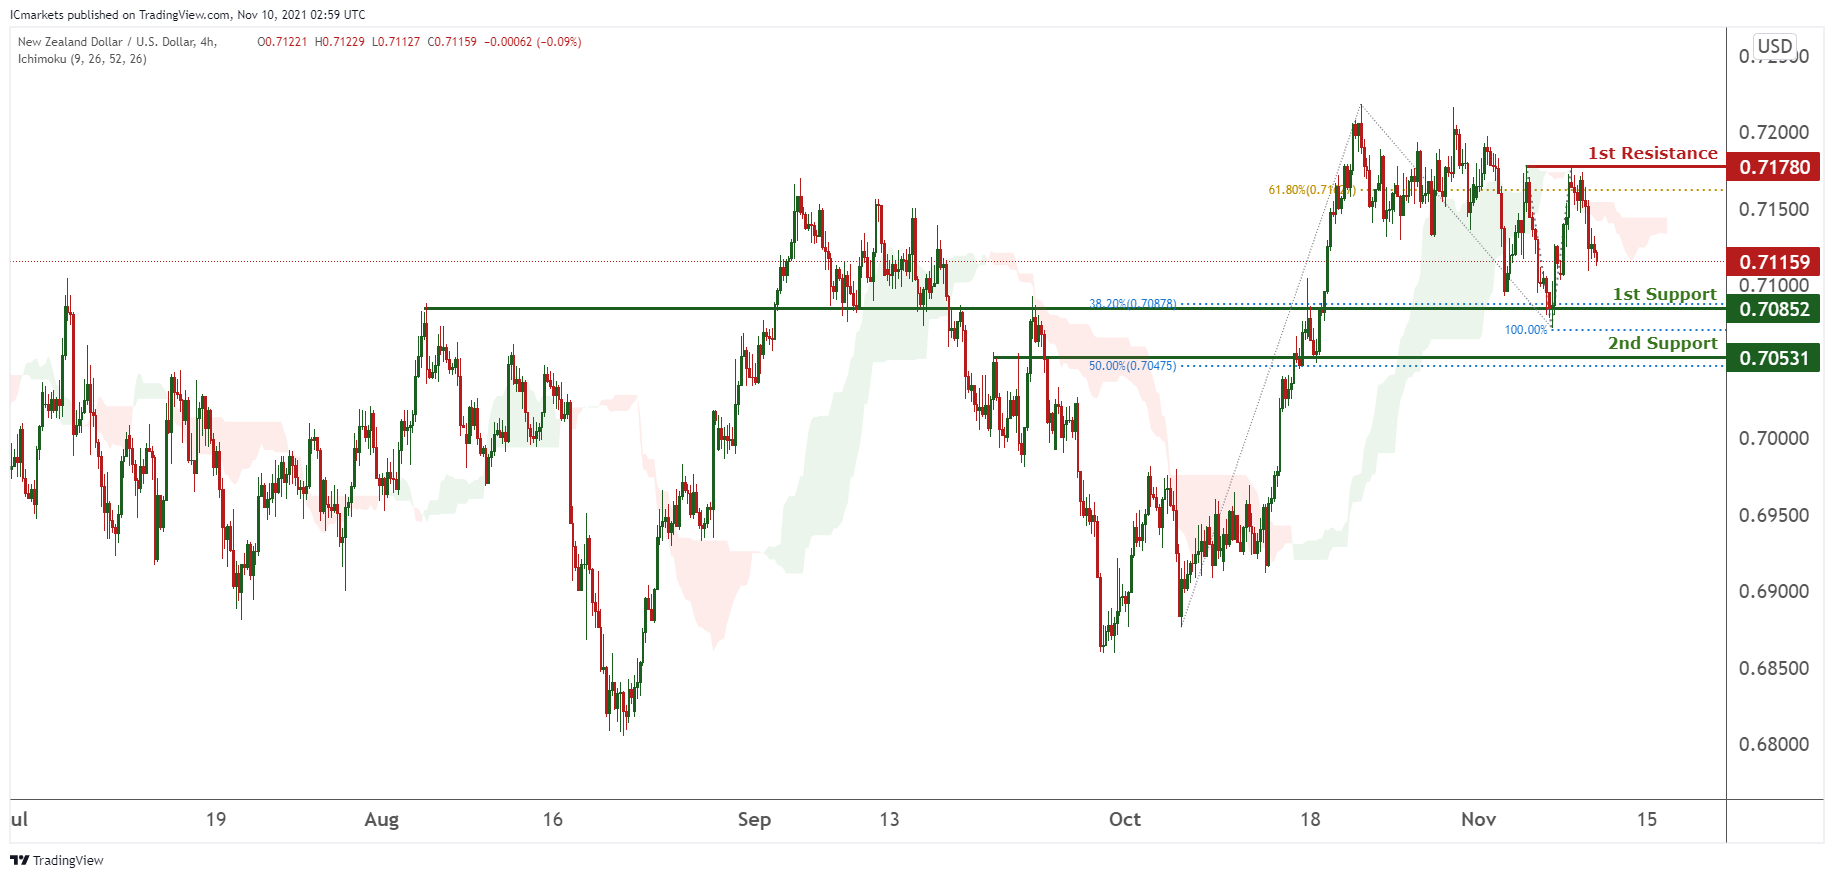
NZD/USD:
On the H4 timeframe, prices are on a bearish momentum and have the potential to dip from our 1st resistance at 0.7178 which is a graphical swing high towards our 1st support at 0.70853 which is a graphical swing low and area of Fibonacci confluences. Technical indicators are showing bearish momentum. If prices break our 1st support, it has the potential to dip to our 2nd support at 0.70531 in line with 50% Fibonacci retracement.
Areas of consideration:
● H4 time frame, 1st resistance at 0.7178
● H4 time frame, 1st support at 0.70852
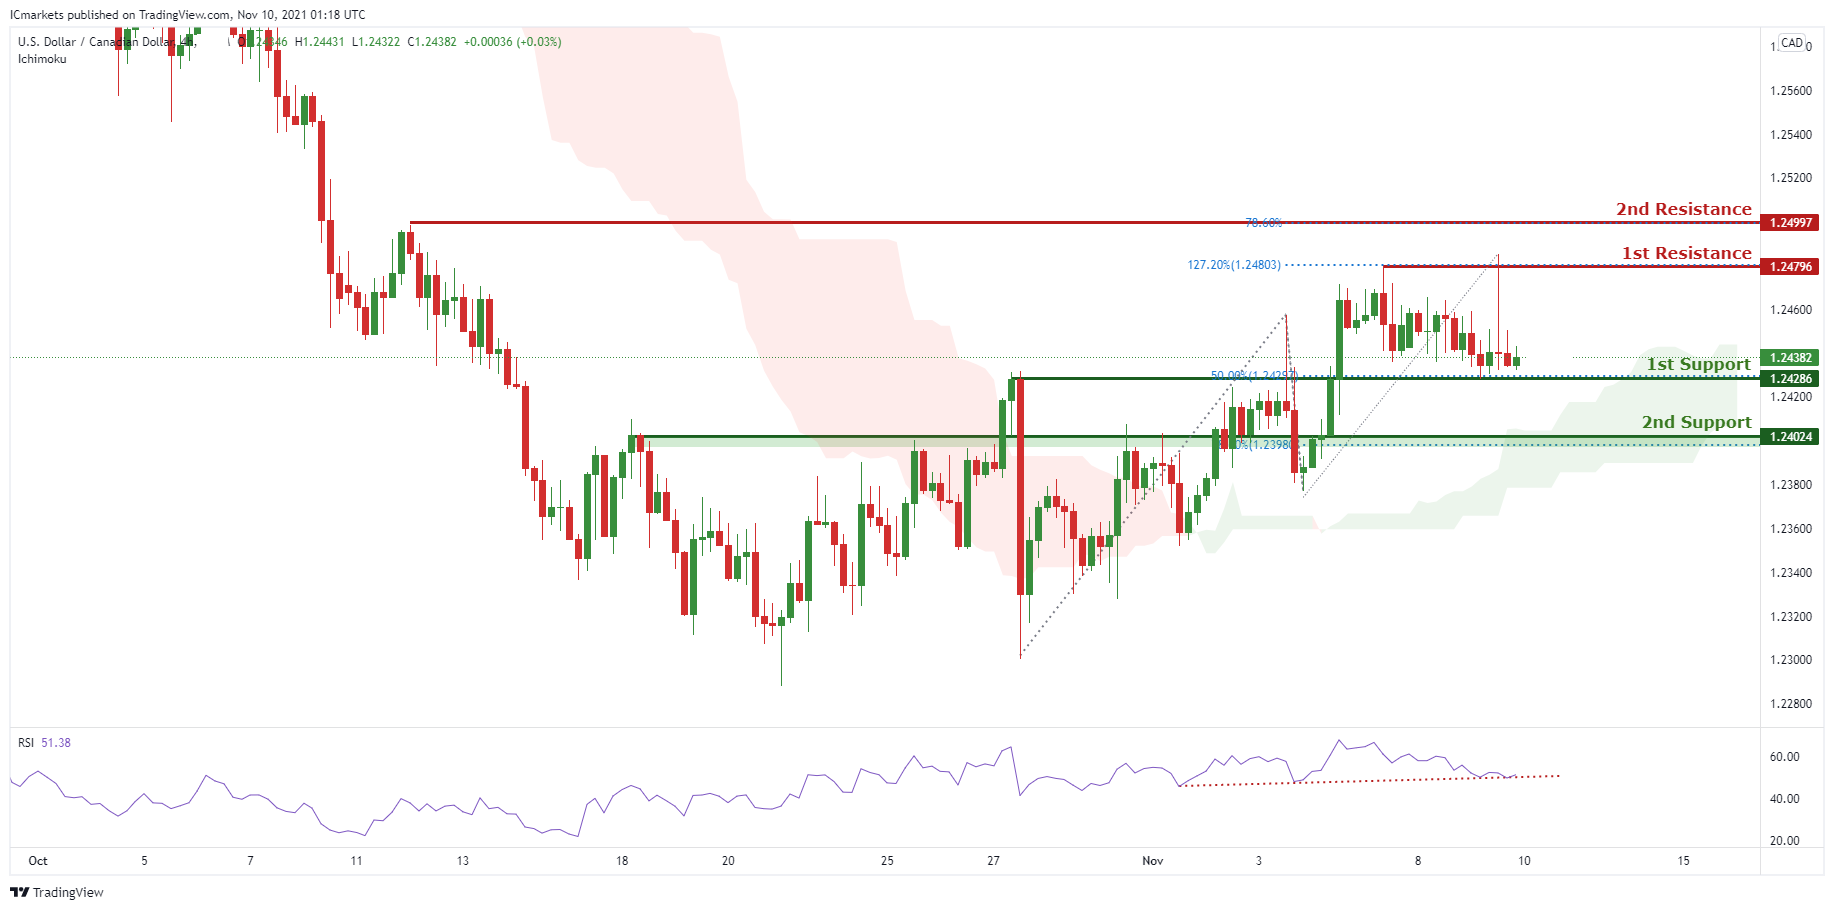
USD/CAD:
On the H4, with price bouncing off the support on the RSI indicator and price moving above the ichimoku cloud, we have a bullish bias that price will rise from 1st support at 1.24286 in line with the 50% Fibonacci retracement levels and the horizontal overlap support to 1st resistance at 1.24796 in line with the graphical swing high resistance and possibly even to 2nd resistance at 1.24964 in line with the graphical swing high from 12th of October. Alternatively, we may see price break 1st support structure and head for 2nd support at 1.24024 in line with the 78.6% Fibonacci retracement level and horizontal overlap support.
Areas of consideration:
● H4 time frame, support at 1.24286
● H4 time frame, resistance at 1.24796
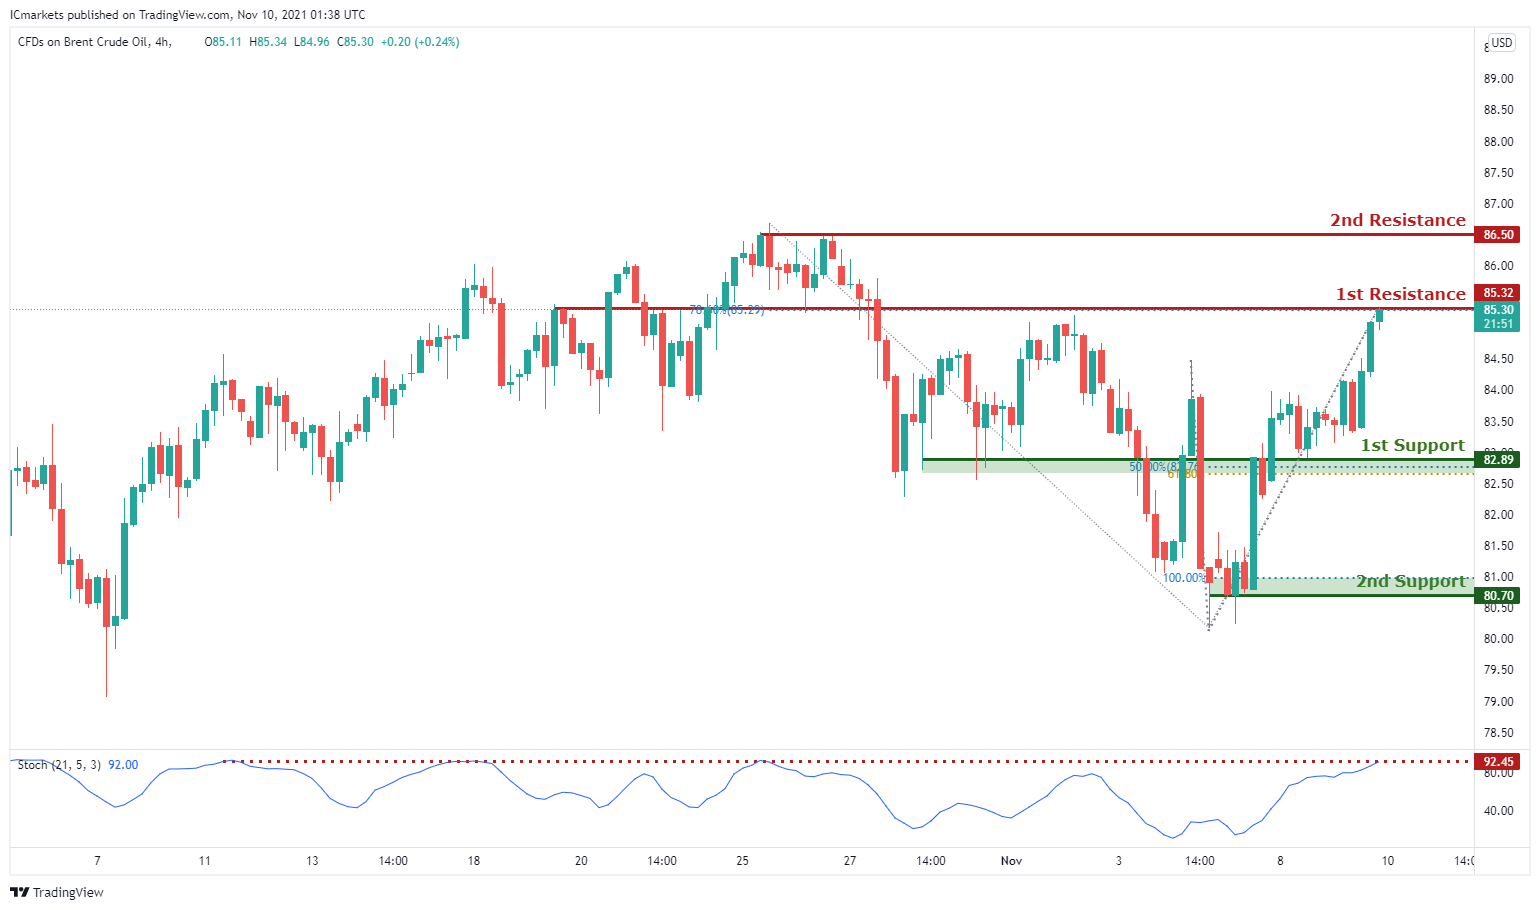
OIL:
On the H4 timeframe,with price approaching the stochastics resistance level, we are expecting a bearish drop from our 1st resistance at 85.30 in line with the 78.6% Fibonacci retracement level to 1st support at 82.89 in line with our horizontal overlap support and 50% and 61.8% Fibonacci retracement level and possibly our 2nd support at 80.70 in line with our 100% Fibonacci projection levels. Alternatively, price may break 1st resistance structure and head for 2nd resistance which is in line with our swing high resistance.
Areas of consideration:
● H4 time frame, 1st resistance of 85.30
● H4 time frame, 1st support of 82.89
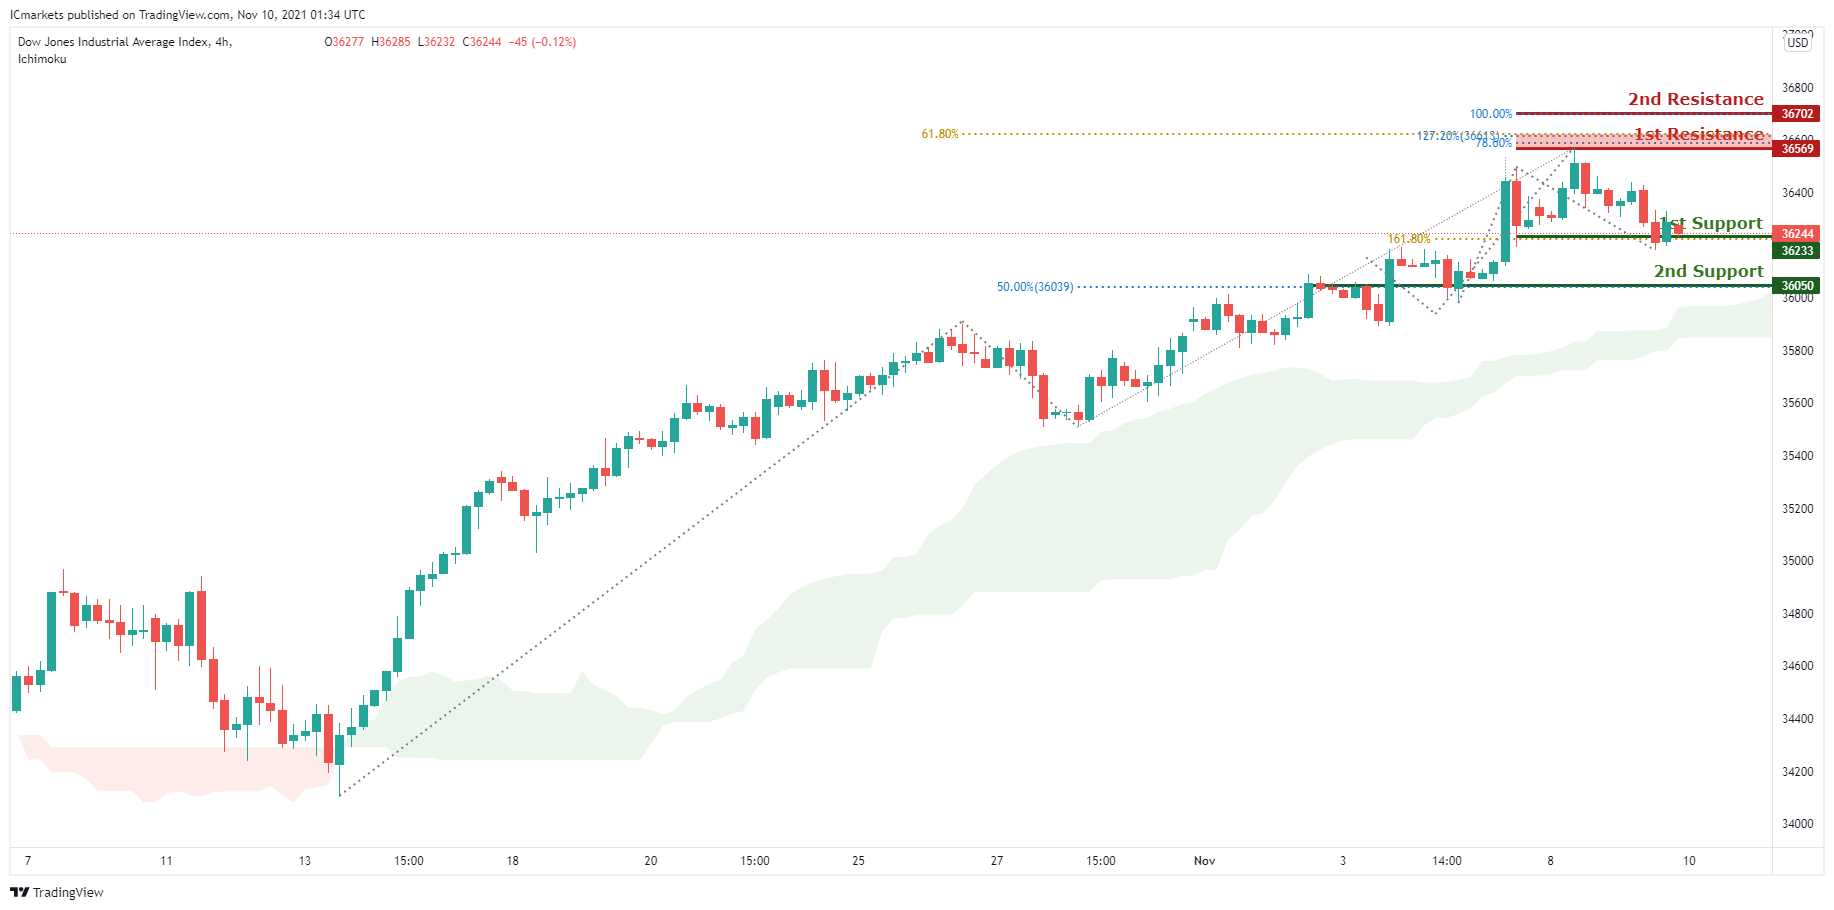
Dow Jones Industrial Average:
On the H4, with price moving above our ichimoku cloud and moving in an uptrend, we are biased that price will rise from out 1st support at 36244 in line with the 161.8% Fibonacci extension level to 1st resistance at 36569 in line with 61.8% and 78.6% Fibonacci projection and 127.2% Fibonacci extension and possibly even rise to 2nd resistance at 36702 in line with the 100% Fibonacci extension. Alternatively, we may see price break 1st support and head for 2nd support at 36050 in line with 50% Fibonacci retracement and graphical swing low.
Areas of consideration:
● 4H resistance at 36569
● 4H support at 36244
The accuracy, completeness and timeliness of the information contained on this site cannot be guaranteed. IC Markets does not warranty, guarantee or make any representations, or assume any liability regarding financial results based on the use of the information in the site.
News, views, opinions, recommendations and other information obtained from sources outside of www.icmarkets.com.au, used in this site are believed to be reliable, but we cannot guarantee their accuracy or completeness. All such information is subject to change at any time without notice. IC Markets assumes no responsibility for the content of any linked site.
The fact that such links may exist does not indicate approval or endorsement of any material contained on any linked site. IC Markets is not liable for any harm caused by the transmission, through accessing the services or information on this site, of a computer virus, or other computer code or programming device that might be used to access, delete, damage, disable, disrupt or otherwise impede in any manner, the operation of the site or of any user’s software, hardware, data or property.


