
Key risk events today:
US CPI m/m and Core CPI m/m; FOMC Economic Projections, FOMC Statement, Federal Funds Rate and Press Conference.
(Previous analysis as well as outside sources – italics).
EUR/USD:
The US dollar index ceded further ground Tuesday, snaking through 96.50 and now poised to connect with the 96.00 handle.
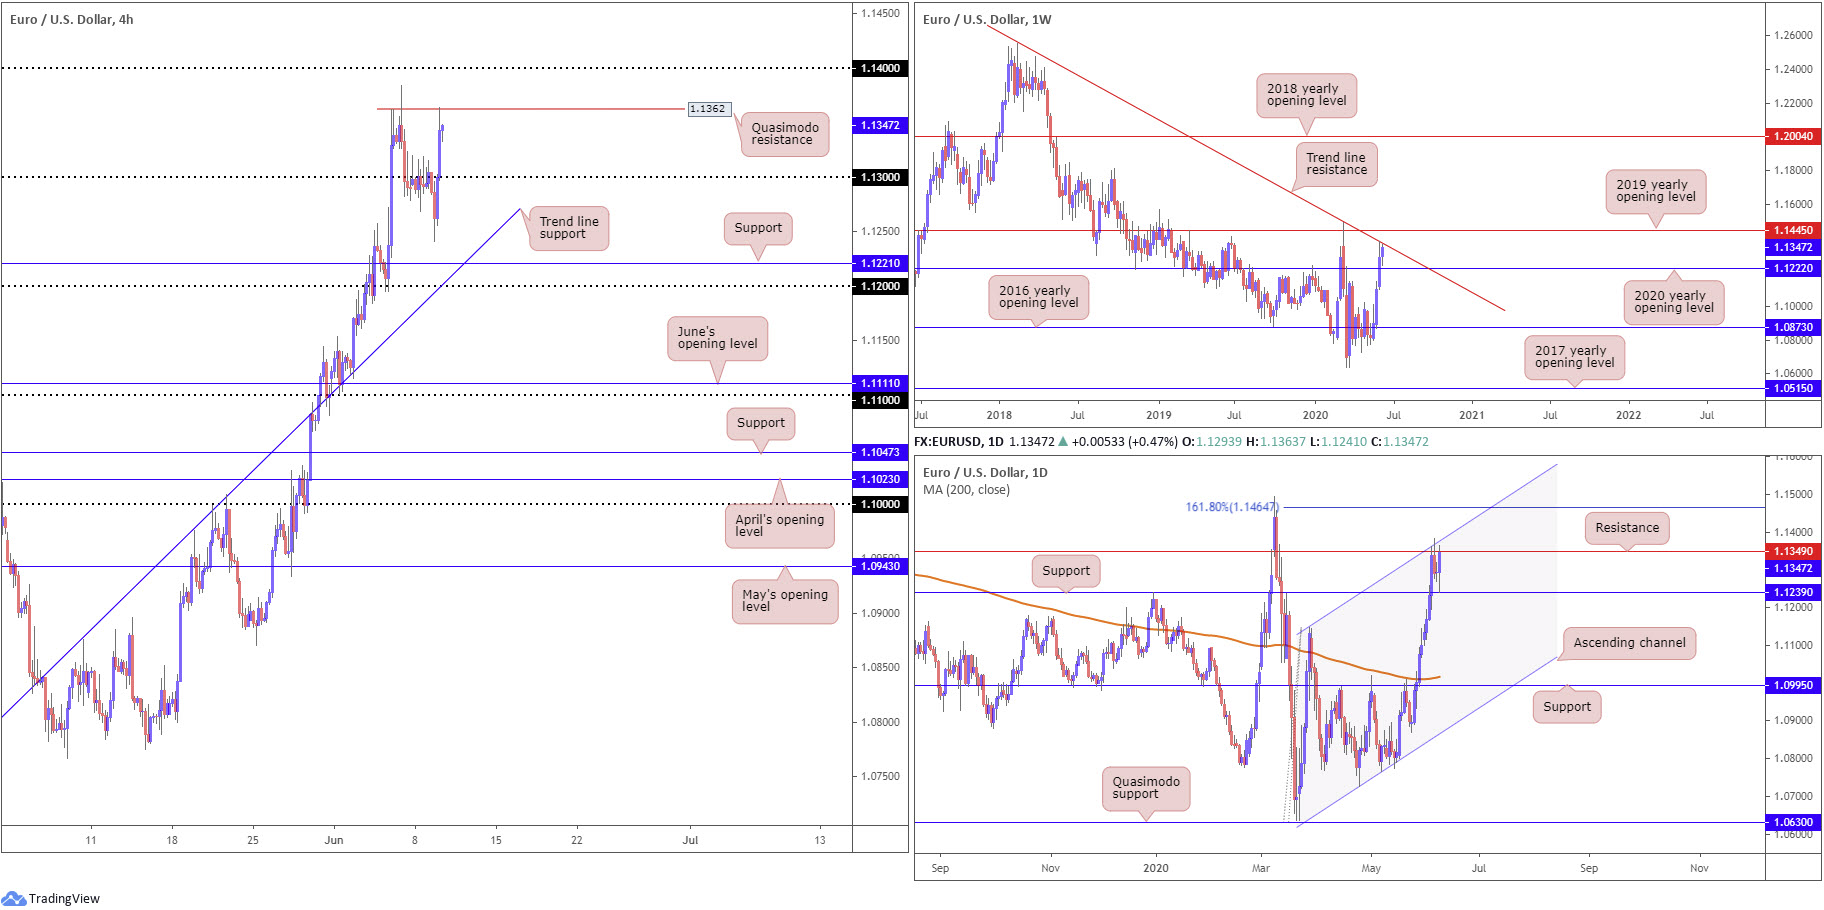
EUR/USD, according to the H4 timeframe, dipped to 1.1241 yesterday, leaving support at 1.1221 unchallenged, before turning to reclaim 1.13+ status to shake hands with recently formed Quasimodo resistance at 1.1362. Given the short-term upward trend we’re in right now, it’s unlikely to see much of a reaction emerge off the aforementioned resistance, therefore shining the spotlights on 1.14 as the next possible hurdle.
Moving things across to the weekly timeframe, buyers remain in a healthy position despite facing the wrath of long-standing trend line resistance, extended from the high 1.2555. Of course, the trend line resistance may still lure price lower, perhaps reconnecting with 1.1222. Further upside, though, could have the unit cross swords with the 2019 yearly opening level at 1.1445.
The story on the daily timeframe, after price came within two pips of shaking hands with support at 1.1239, shows the unit gripping resistance at 1.1349, a level displaying a close connection with channel resistance, extended from the high 1.1147. In the event 1.1349 gives way, a 161.8% Fibonacci extension point at 1.1464 may make an appearance.
Areas of consideration:
With H4 candles showing some interest off Quasimodo resistance at 1.1362, weekly price toying with trendline resistance and daily price re-joining with resistance at 1.1349, sellers still may have a hand in this fight and push for 1.13 today. Selling, however, entails going up against the short-term uptrend.
Another sell point to be aware of today is the 1.14 handle on the H4 timeframe, aligning closely with daily channel resistance (1.1147).
GBP/USD:
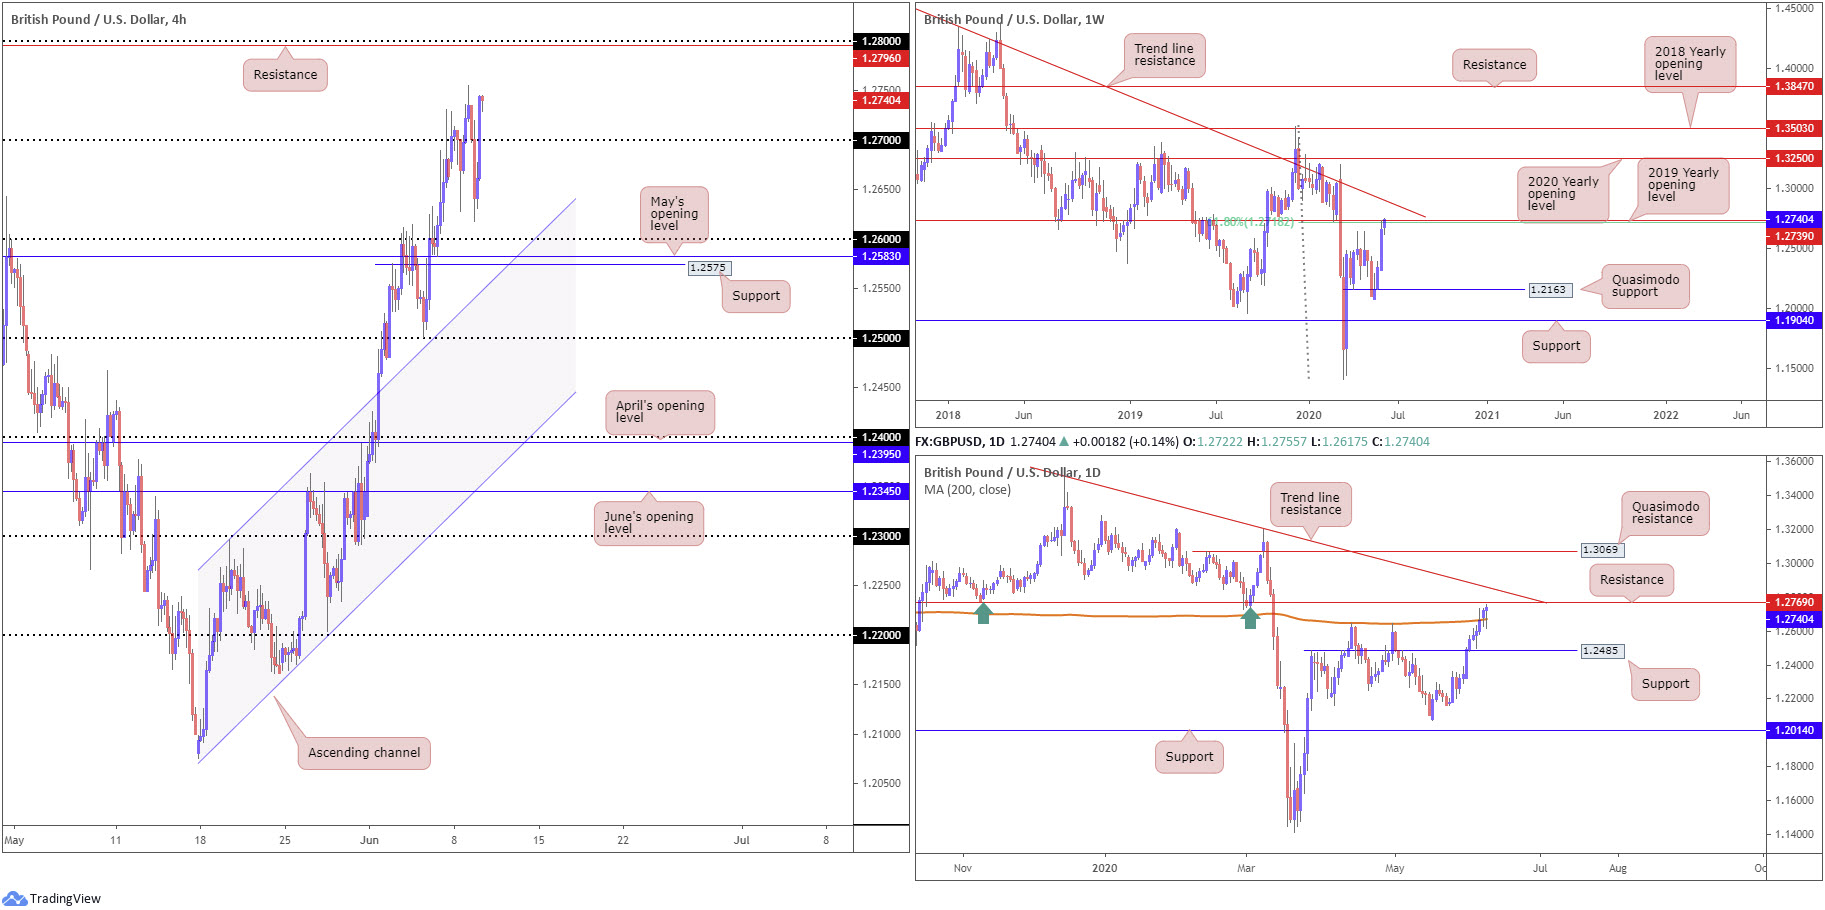
At one stage, sterling shorts governed control under the 1.27 handle in early trade Tuesday, seeking a low point at 1.2617. Thanks to USD shorts spinning off into another phase of downside, though, GBP/USD concluded things back above 1.27 – It is at times like these one can almost feel protective stop-loss orders popping. Closing back above the noted round number threatens a possible continuation to H4 resistance at 1.2796 (prior Quasimodo support), a few pips under 1.28.
The 200-day SMA (orange – 1.2671) remained supportive Tuesday, withstanding another downside attempt. Ahead we face possible resistance coming in at 1.2769 and trend line resistance, taken from the high 1.3514. Although registering its ninth consecutive daily gain, resistance at 1.2769, owing to its history, could put a lid on gains. Initial support from here, assuming we take the 200-day SMA, still resides at 1.2485.
In terms of price movement on the weekly timeframe, sterling recently shook hands with a 61.8% Fibonacci retracement ratio at 1.2718 and the 2019 yearly opening level at 1.2739. Combined, this is impressive resistance. However, prudent traders will want to note trend line resistance, extended from the high 1.5930, in the event we spin off into another phase of buying this week. A rejection from current resistance, nevertheless, has plenty of room to manoeuvre until reaching Quasimodo support at 1.2163.
Areas of consideration:
Weekly resistance making an appearance between 1.2718/1.2739, along with resistance lurking at 1.2769 on the daily timeframe, may continue to hamper attempts to H4 resistance at 1.2796 today. Sellers, as stated in Tuesday’s technical briefing, potentially inhabit 1.2769/1.2718.
Despite this, buyers continue to defend their position at the moment. Therefore, traders may still look to 1.27 as feasible support today.
AUD/USD:
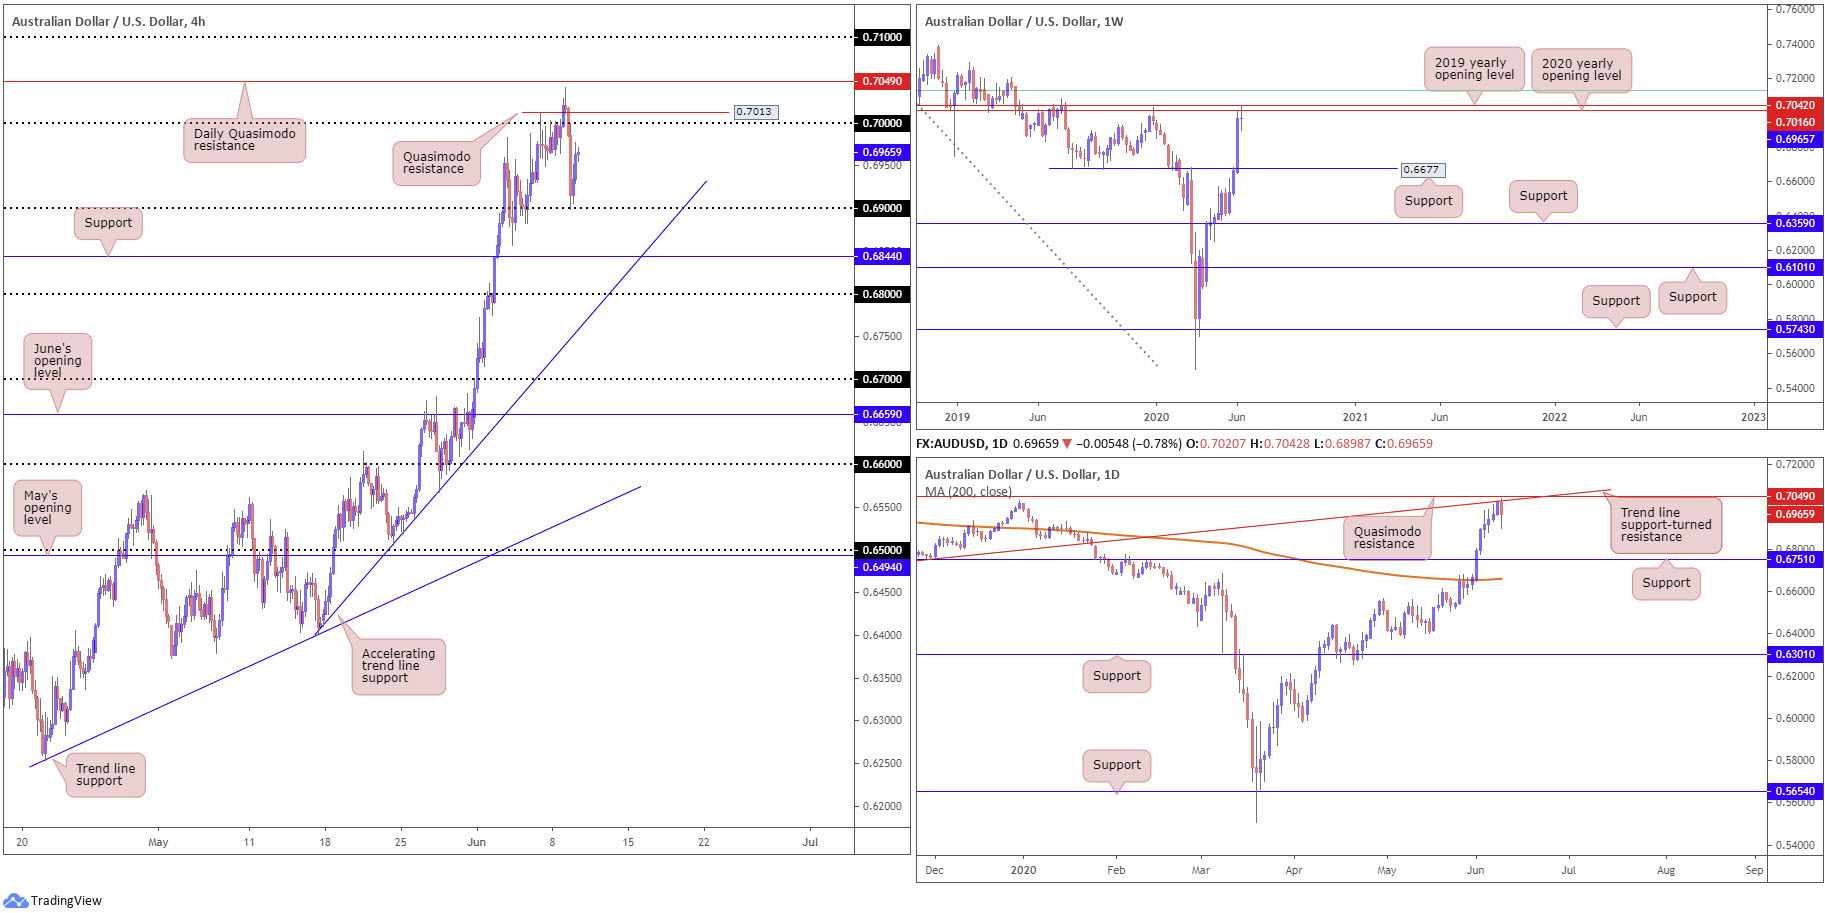
Risk sentiment received a blow Tuesday, transporting AUD/USD 1% lower at one point and shaking hands with the 0.69 handle on the H4 timeframe. As you can see, though, as we headed into the US session, we pared a portion of the day’s losses, and consequently drew 0.70 back into the frame as potential resistance.
Interestingly, on the weekly timeframe we have the current candle engaging with the 2020 yearly opening level and the 2019 yearly opening level at 0.7016 and 0.7042, respectively. Candlestick traders will also note an indecisive tone being seen at the moment, shaped in the form of a doji candlestick pattern.
Snapping an eight-day bullish phase, daily price is seen crossing swords with trend line support-turned resistance, taken from the low 0.6670, sited ahead of a Quasimodo resistance nearby at 0.7049 (also marked on the H4 timeframe).
Areas of consideration:
For those who read Tuesday’s technical briefing you may recall the following (italics):
Having noted higher-timeframe resistance positioned above the key figure 0.70 on the H4 timeframe highlights the possibility of a fakeout scenario unfolding. Protective stop-loss orders above 0.70 are currently being filled from those attempting to fade the figure, while buy-stops derived from breakout buyers are also being triggered. Combined, this provides ample liquidity for bigger players to sell from the higher-timeframe resistances.
Conservative sellers, though, are likely to wait and see if H4 can close back under 0.70 before engaging.
Well done to any sellers who managed to jump aboard the recent downturn.
Going forward, some traders will likely have eyes on 0.70 and nearby H4 Quasimodo resistance at 0.7013 as a possible reversal station today, having noted weekly and daily resistances still in motion. However, traders are urged to pencil in the possibility of a fakeout to daily Quasimodo resistance at 0.7049 before serious sellers make an appearance.
USD/JPY:
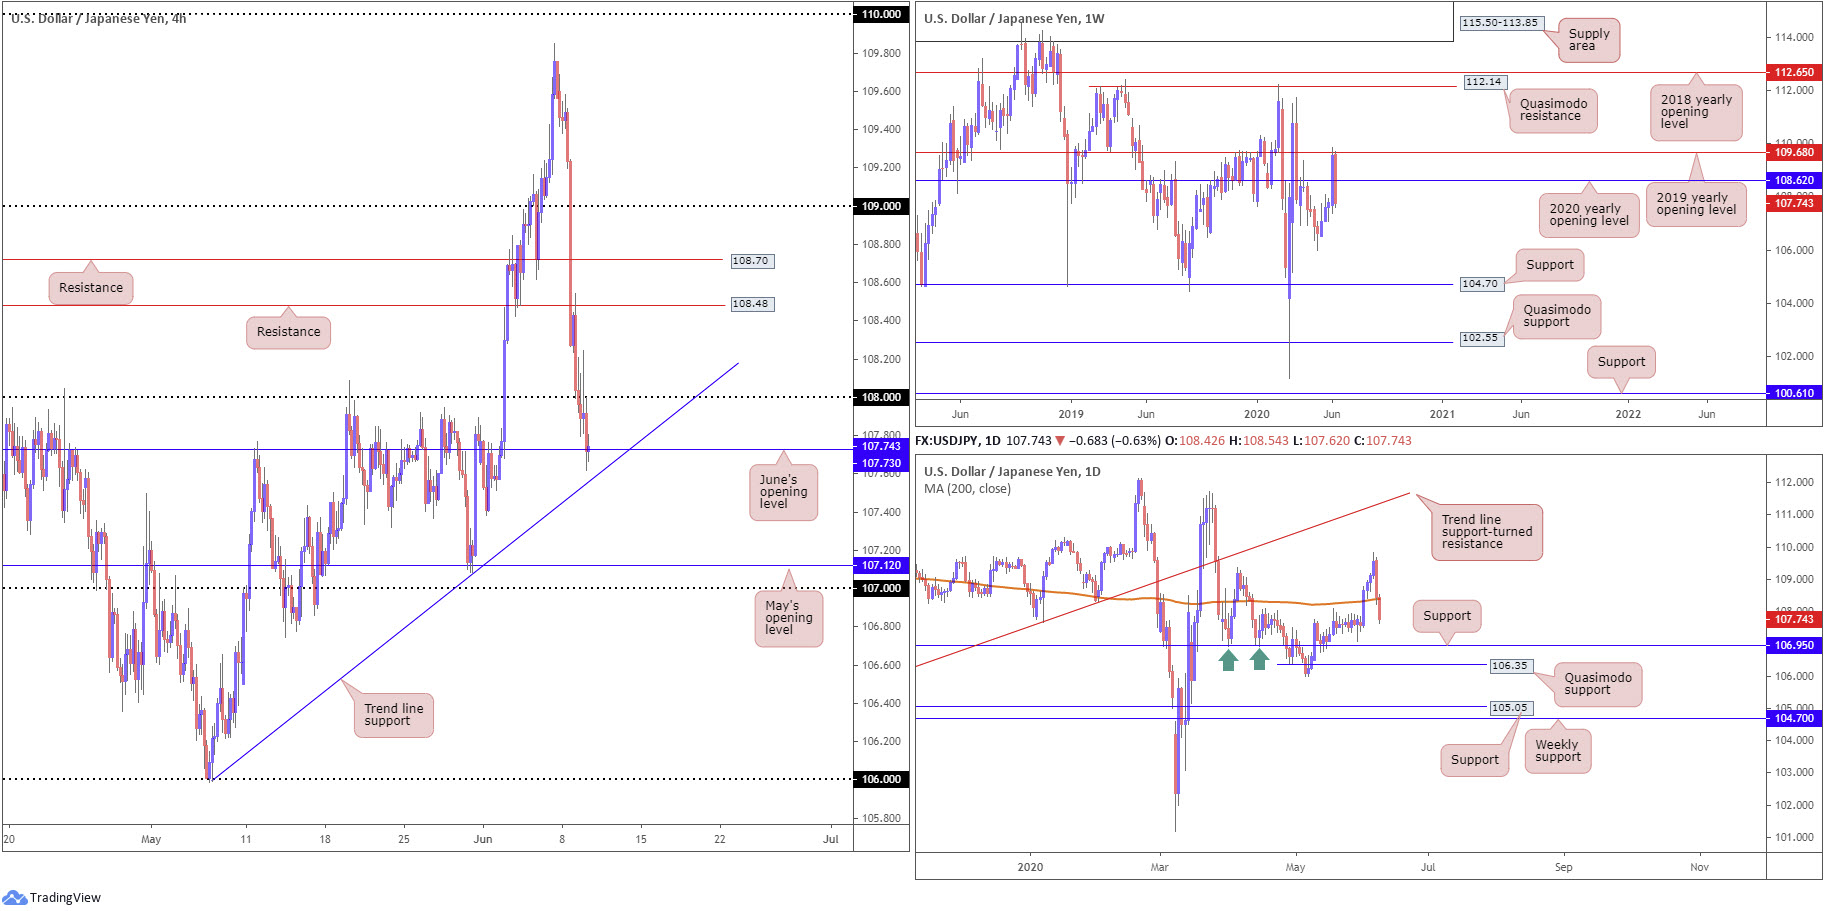
The US dollar dived against the Japanese yen for a second consecutive session Tuesday, losing a further 0.6%. Upside attempts above the 108 handle on the H4 timeframe failed to glean much interest, with supply swarming the pair and hauling price to June’s opening level at 107.73. Price action traders will also view trend line support, taken from the low 105.99, resting a touch under 107.73.
The story on the daily timeframe had the unit dip its toe under the 200-day SMA (orange – 108.39) yesterday, throwing 106.95 back in the pot as potential support today, closely followed by Quasimodo support at 106.35. Down 1.6% on the week so far, we can see weekly price recently probed territory under the 2020 yearly opening level at 108.62, shifting focus to the 105.98 6th May low as the next downside target.
Areas of consideration:
Tuesday’s weekly technical briefing underlined the following (italics):
Going forward, short plays off 108.48 are possible, though buyers off the 200-day SMA could be too much for sellers to contend with here. Therefore, a cautionary stance is necessary.
Well done to any readers who managed short positions off 108.48. Higher-timeframe structure now suggests further downside could be on the cards today, with 106.95 on the daily timeframe set as the initial port of call. A H4 close under trend line resistance (preferably followed up with a retest), therefore, may entice selling, targeting May’s opening level at 107.12 on the H4 timeframe, followed by the 107 handle and then daily support at 106.95.
USD/CAD:
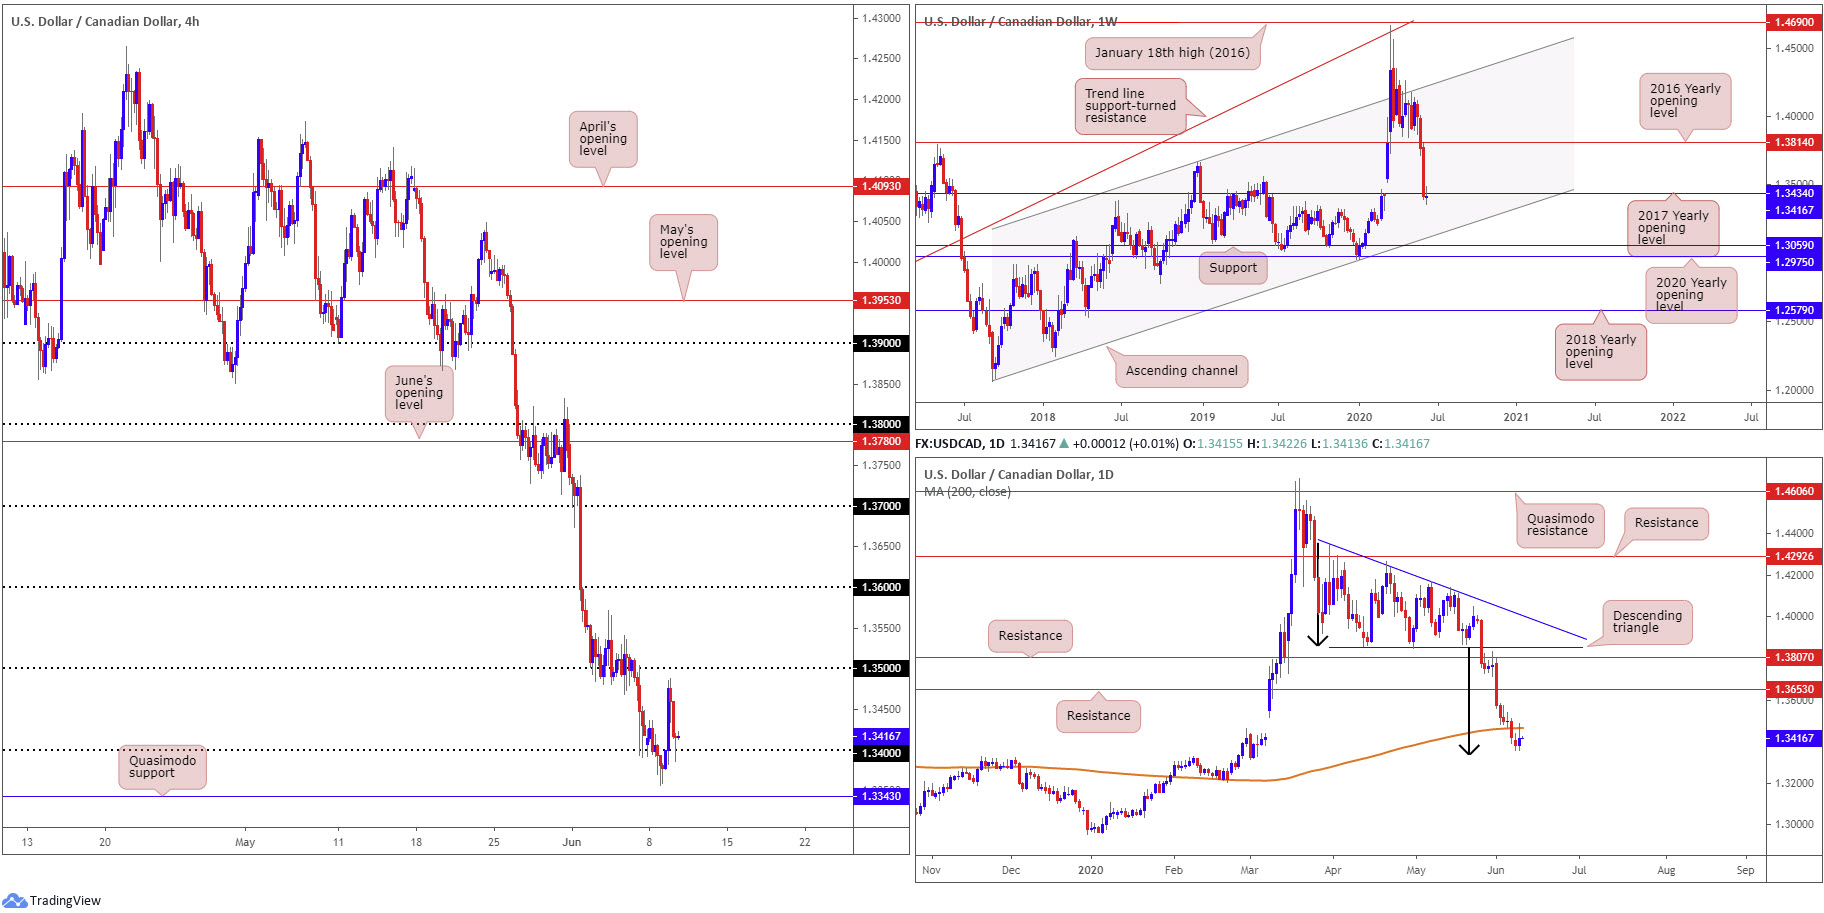
Entering from the top this morning, the technical landscape on the weekly timeframe reveals buyers and sellers battling for position a few pips under the 2017 yearly opening level at 1.3434. Right now, we’re seeing little generated from either side of the market, currently forming an indecision candle.
Meanwhile, on the daily timeframe, the underside of the 200-day SMA (orange – 1.3465) offered resistance on Tuesday, turning the candles towards the descending triangle’s (between 1.4349 and 1.3855) take-profit base at 1.3332 (black arrows).
Moving across to the H4 timeframe, early European hours witnessed price reclaim 1.34, climbing to highs at 1.3488 before retreating to 1.34 into the closing stages of the session. South of 1.34 we’re likely to see the pair address Quasimodo support coming in at 1.3343.
Areas of consideration:
With buyers and sellers battling for position around weekly support at 1.3434, along with daily price holding things south of the 200-day SMA, combined, this might be sufficient to overturn 1.34 today and approach H4 Quasimodo support at 1.3343 and the daily descending triangle’s take-profit base at 1.3332. Traders may, therefore, witness a bounce from here.
USD/CHF:
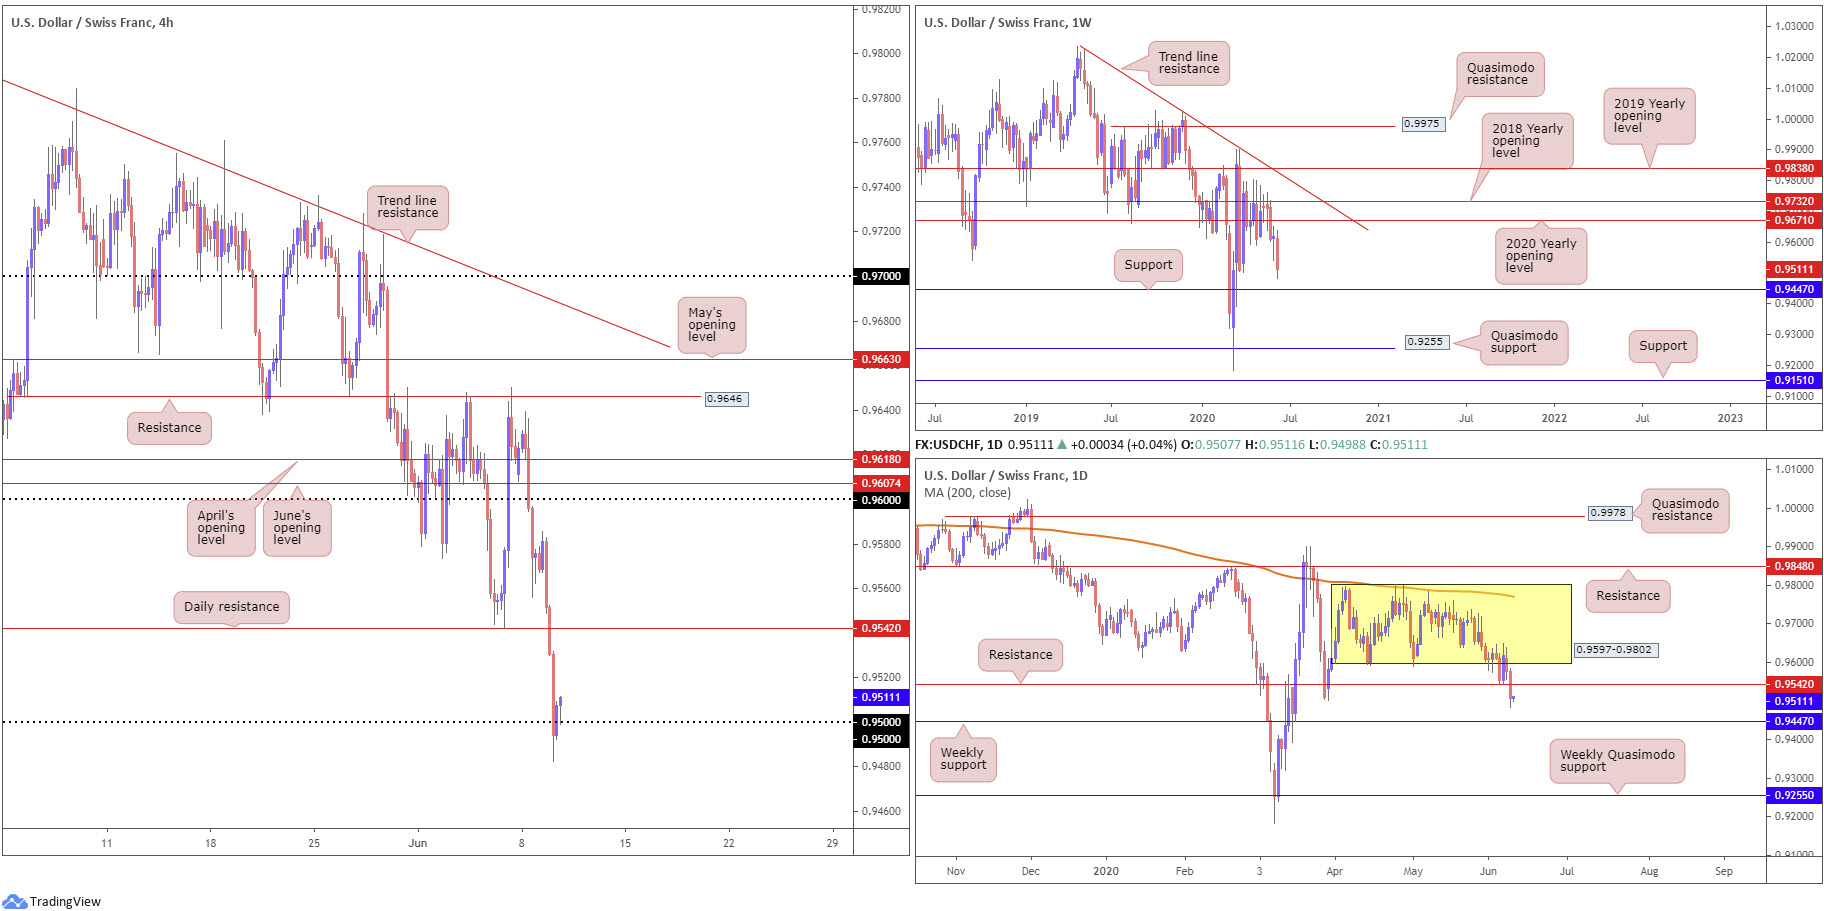
The safe-haven Swiss franc established firm demand Tuesday, as global equities trekked lower ground.
Down 0.7% on the day, USD/CHF took on daily support at 0.9542, slam dunking into 0.95 based on the H4 scale, which, for now, holds as support. South of this angle threatens a continuation move to the 0.94 handle.
Elsewhere, weekly price, after breaching the 2020 yearly opening level at 0.9671, appears poised to cross swords with support at 0.9447. The picture on the daily timeframe reveals price action recently penetrated the lower boundary of 0.9802/0.9597, a consolidation area since early April. Interestingly, the lower boundary came under fire into the tail end of last week, forged in the shape of a 2-candle fakeout off nearby support from 0.9542. As you can see, little emerged from this in the form of additional buying, sending Tuesday under the said support (now a serving resistance) and shifting focus to weekly support mentioned above at 0.9447.
Areas of consideration:
Weekly price continues to hint at lower levels, according to its current position, until reaching support at 0.9447. This is further confirmed following daily price overthrowing support at 0.9542, consequently placing a question mark on 0.95 as a H4 support.
As a result, a H4 close under 0.95 today may see breakout selling towards weekly support priced in at 0.9447 and, with a little energy, maybe even the 0.94 handle. Conservative traders are likely to seek a retest at 0.95 before engaging, given round numbers being prone to fakeouts.
The accuracy, completeness and timeliness of the information contained on this site cannot be guaranteed. IC Markets does not warranty, guarantee or make any representations, or assume any liability regarding financial results based on the use of the information in the site.
News, views, opinions, recommendations and other information obtained from sources outside of www.icmarkets.com.au, used in this site are believed to be reliable, but we cannot guarantee their accuracy or completeness. All such information is subject to change at any time without notice. IC Markets assumes no responsibility for the content of any linked site.
The fact that such links may exist does not indicate approval or endorsement of any material contained on any linked site. IC Markets is not liable for any harm caused by the transmission, through accessing the services or information on this site, of a computer virus, or other computer code or programming device that might be used to access, delete, damage, disable, disrupt or otherwise impede in any manner, the operation of the site or of any user’s software, hardware, data or property.


