
EUR/USD:
With the US dollar seen extending gains on Tuesday against the majority of its trading peers, this exerted additional downside pressure on the EUR/USD. H4 support at 1.1944 saw a rather muted response, and is, for that reason, now regarded as resistance. Further selling on the H4 timeframe would place the unit around the 1.19 handle, which, as you can see, is shadowed closely by December’s opening level plotted at 1.1898.
Weekly structure, as noted in previous reports, continues to reflect a bearish position. Last week’s trade chalked up a weekly bearish selling wick around both a weekly resistance level at 1.2044 and a 127.2% weekly Fib ext. point at 1.2081. So far this week, we’ve seen weekly price breach nearby support in the form of the 2018 yearly opening level at 1.2004.
Consequent to this recent bout of selling, though, it is also worth noting that the daily candles are seen closing in on a particularly interesting daily demand base at 1.1817-1.1874. Besides the converging daily support level pegged at 1.1878, we can also see a daily trendline taken from the high 1.2092 merging with these areas alongside a 61.8% daily Fib support level at 1.1862.
Market direction:
According to higher-timeframe price action, further selling is possible down to at least the 1.1878 neighborhood. Due to the surrounding confluence of this number we expect active buyers to make an appearance from here.
Is this confluence enough to warrant a long entry? Of course, this would be down to whether the structure being presented here is in accordance with your own trading strategy. Technically speaking, though, there is a possibility that weekly sellers could run through the daily area. Therefore, to be on the safe said, waiting for a full or near-full-bodied daily bull candle to form from the noted zone may be a better path to take. That way, you’ll know there are interested buyers, thus helping confirm the area as a potential buy zone.
Data points to consider: US import prices m/m at 1.30pm GMT.

Areas worthy of attention:
Supports: 1.19 handle; 1.1898; 1.1878; 1.1817-1.1874; 1.1862.
Resistances: 1.1944; 1.2081; 1.2044.
GBP/USD:
The bullish pulse continued to beat in the US dollar market on Tuesday, consequently placing the British pound under pressure. What’s more, UK PM Theresa May’s attempt to restructure her government faced strong resistance, consequently adding weight to the recent selloff.
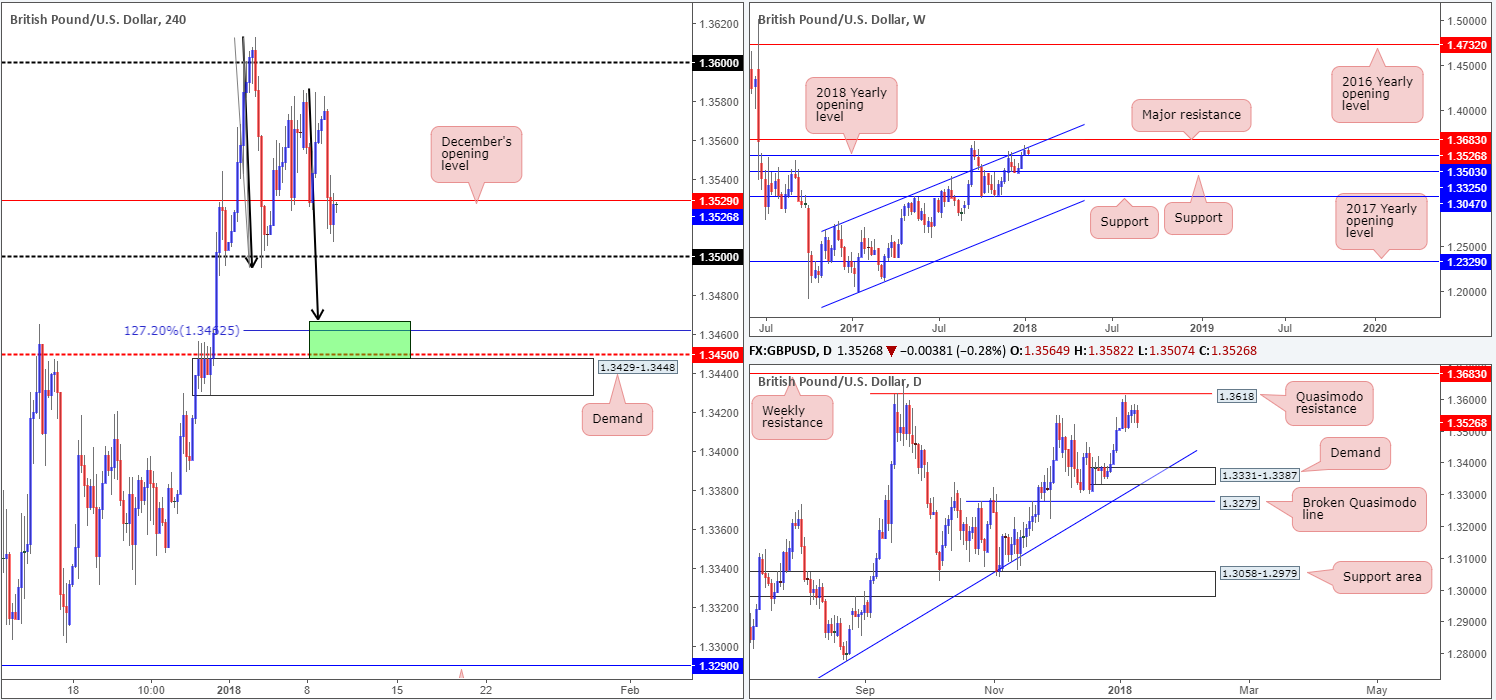
Through the lens of a technical trader, we can see that December’s opening level on the H4 timeframe at 1.3529 was engulfed amid yesterday push lower. The 1.35 handle is the next line of support on the radar. Beyond 1.35, there’s space for the H4 candles to challenge the green area located at 1.3448-1.3467 (comprised of a H4 AB=CD [see black arrows] 127.2% ext. point at 1.3462/1.3467, a H4 mid-level support at 1.3450 and the top edge of a H4 demand at 1.3429-1.3448).
A quick look at the higher timeframes shows that there is resistance in sight. The GBP/USD advanced for a third consecutive session during the course of last of last week’s trading, lifting the pair to a weekly high of 1.3612 and enabling the unit to shake hands with a weekly channel resistance extended from the high 1.2673. In the case that this channel is engulfed, the path north should be clear up to a nearby weekly resistance plotted at 1.3683. A rejection of the channel, however, could face opposition from the 2018 yearly opening level seen on the weekly timeframe at 1.3503. Turning our focus to the daily timeframe, a daily Quasimodo resistance at 1.3618 can be seen providing additional mettle for the aforementioned weekly channel resistance. Further selling on this scale could see price approach a daily demand printed at 1.3331-1.3387, which happens to merge with a daily trendline support taken from the low 1.2108.
Market direction:
A deep fakeout below 1.35 is a possibility. This could, with a little elbow grease, see H4 price test the aforesaid green H4 zone and rebound higher. It’s important to remember that we’re not only dealing with the 1.35 level here; we’re also working with the 2018 yearly opening level mentioned above. And considering this level is of the higher timeframes, a 30-pip fakeout is minor league in the grand scheme of things.
Conservative traders, however, might want to wait for the fakeout to take place, and also postpone pulling the trigger until a H4 break above December’s opening level is seen, since this could prove a troublesome resistance. This would, in our book of technical setups, be considered a strong indication that price is headed higher. From this point, we’d be eyeing the 1.36 handle/daily Quasimodo resistance at 1.3618 as an initial take-profit target.
Data points to consider: UK manufacturing production m/m and goods trade balance at 9.30am; US import prices m/m at 1.30pm GMT.
Areas worthy of attention:
Supports: 1.3503; 1.35 handle; 1.3331-1.3387; daily trendline support.
Resistances: Weekly channel resistance; 1.3683; 1.3618; 1.3529.
AUD/USD:
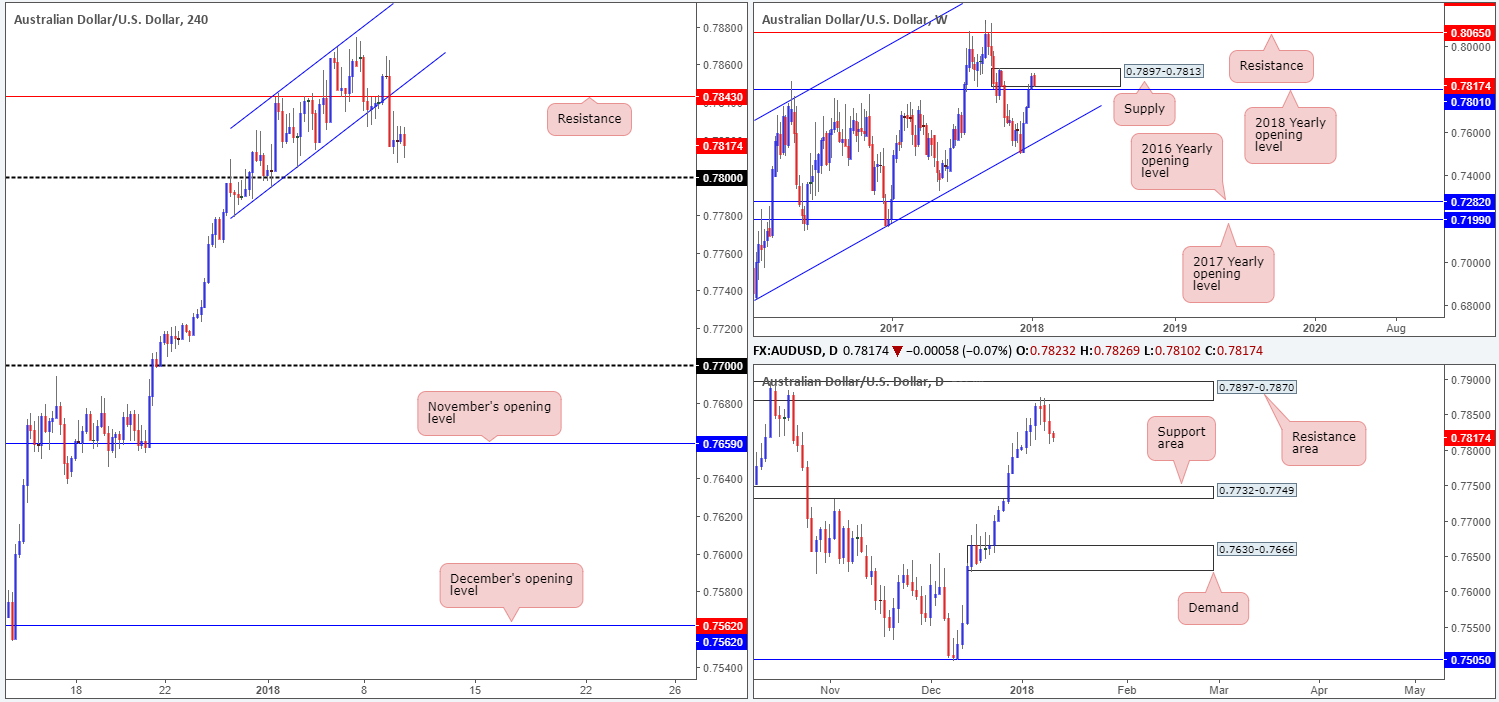
The Aussie dollar took to the downside in early London hours on Tuesday, following a modest push to highs of 0.7864 on the back of stronger-than-expected AUD building approvals m/m. The move, as you can see on the H4 timeframe, posted a nice-looking H4 selling wick and a dominant full-bodied H4 bearish candle that swallowed both H4 support at 0.7843, and a H4 channel support extended from the low 0.7778.
Over on the bigger picture, we can see that weekly price is beginning to show signs of weakness within weekly supply seen at 0.7897-0.7813. In spite of this, a break beyond the 2018 yearly opening level at 0.7801 will need to be seen before a bearish bias is confirmed.
A closer look at price action on the daily timeframe reveals that the unit formed a reasonably strong-looking daily bearish candle after connecting with a daily resistance area seen at 0.7897-0.7870 on Monday, which was extended on Tuesday. Not only is this zone positioned within the upper limits of the weekly supply area highlighted above, downside is reasonably clear on the daily scale until the daily support area seen at 0.7732-0.7749.
Market direction:
In view of the unit’s close proximity to the 0.78 handle and the 2018 yearly opening level mentioned above at 0.7801, selling may not be the path to take just yet. Once, or indeed if, a clean H4 break of 0.78 takes place, then, as far as we can see, downside is free to challenge the aforementioned daily support area.
Waiting for a break/retest of 0.78, targeting 0.7750 could be something to consider. The break could take place following Chinese inflation figures due at 1.30am GMT, so remain vigilant.
Data points to consider: Chinese inflation data y/y at 1.30am; US import prices m/m at 1.30pm GMT.
Areas worthy of attention:
Supports: 0.7801; 0.7732-0.7749; 0.78 handle.
Resistances: 0.7897-0.7813; 0.7897-0.7870; 0.7843.
USD/JPY:
The US dollar index (USDX) rose against the majority of its trading peers on Tuesday, reaching highs of 92.64. The USD/JPY failed to benefit, however, as the Japanese yen appreciated after the BoJ announced the cut back of its bond purchases in the long end of the curve.
In recent trading, we can see that the pair has eased off and breached December’s opening level seen on the H4 timeframe at 112.58, a level that held nicely as support during Tuesday’s segment. While this move may motivate breakout sellers, it might be worth noting that there is currently a daily demand in play at 111.99-112.57 that has held firm on two occasions over the past month or so.
Market direction:
With limited space seen to the downside right now, as well as little technical confluence seen on the H4 timeframe for either a buy or a sell, opting to stand on the sidelines may be the best route to take today.
Data points to consider: US import prices m/m at 1.30pm GMT.
Areas worthy of attention:
Supports: 112 handle; 112.65; 111.99-112.57.
Resistances: 115.50-113.85; 113.91-113.45; 112.58 (potentially).
USD/CAD:
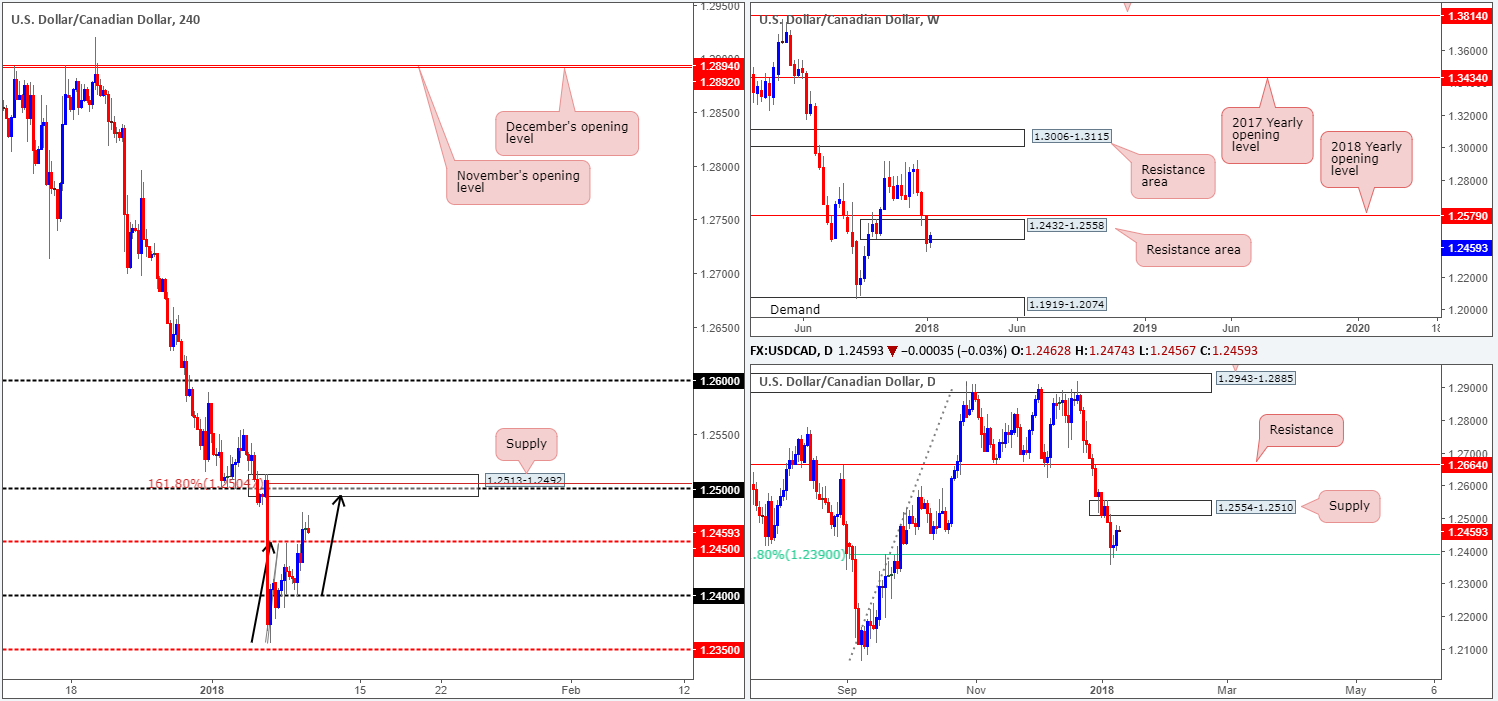
Broad-based US dollar buying helped lift the USD/CAD higher on Tuesday, consequently breaking above the H4 mid-level point at 1.2450 and clocking a high of 1.2477. Directly above here is an interesting H4 supply zone noted at 1.2513-1.2492. Besides housing a H4 AB=CD 161.8% Fib ext. point at 1.2504 and a psychological handle seen at 1.25, the H4 supply area is also seen positioned within the walls of a weekly resistance area coming in at 1.2432-1.2558 and glued to the underside of a daily supply zone at 1.2554-1.2510.
Market direction:
The aforesaid H4 supply is one of interest. The confluence seen on both the H4 timeframe and the higher timeframes is likely appealing to price action traders. Should a rejection be seen from the H4 supply zone today, the next port of call is likely to be 1.2450. Though, given that there are higher-timeframe levels in the mix, the 1.24 handle, which aligns with the 61.8% daily Fib support at 1.2390, is likely to also see some action.
Data points to consider: US import prices m/m at 1.30pm; Canadian building permits m/m at 1.30pm; Crude oil inventories at 3.30pm GMT.
Areas worthy of attention:
Supports: 1.2390; 1.2450; 1.24 handle.
Resistances: 1.25 handle; 1.2513-1.2492; 1.2504; 1.2432-1.2558; 1.2554-1.2510.
USD/CHF:
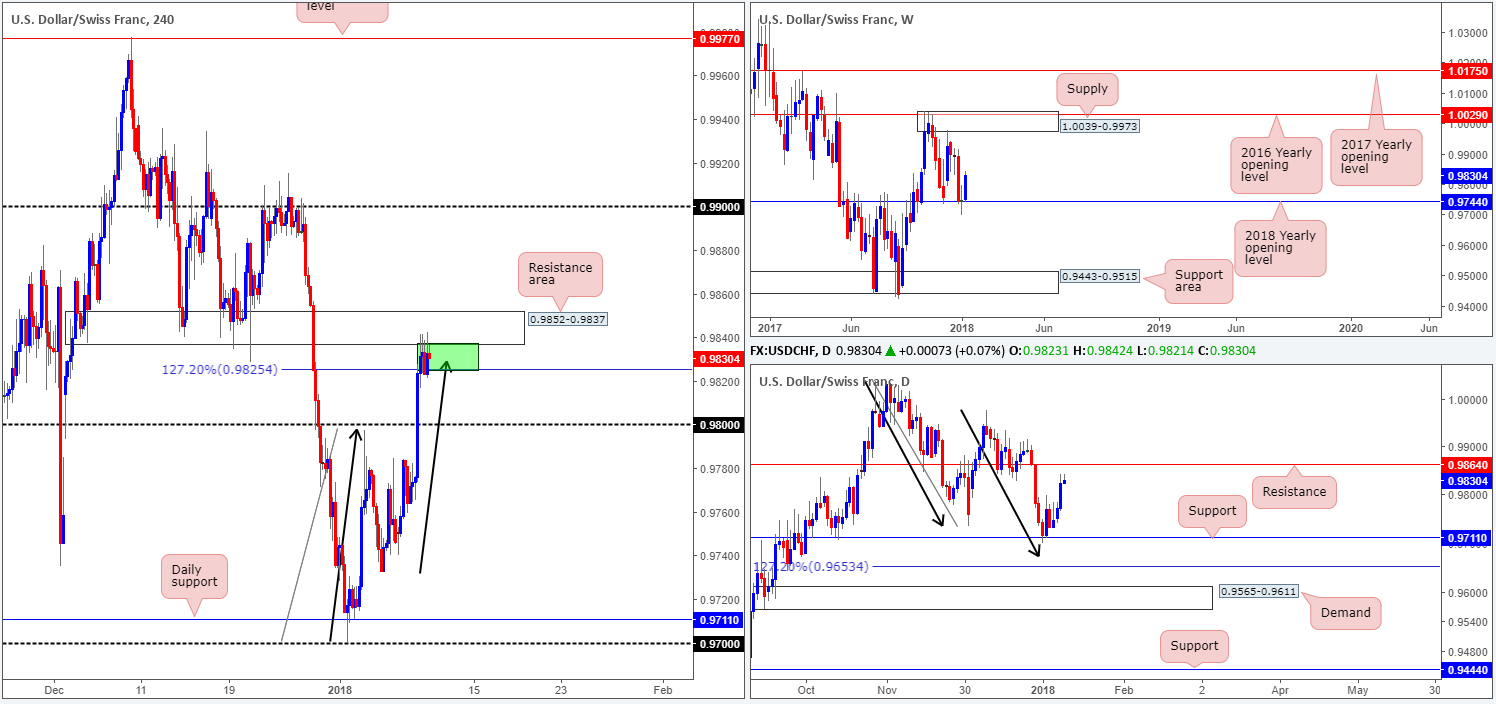
The USD/CHF continued to gain traction during the course of yesterday’s sessions, chomping through the 0.98 handle and eventually testing a H4 resistance area plotted at 0.9852-0.9837. The green H4 zone seen at 0.9837-0.9825, which comprises of the underside of the noted H4 resistance area and a H4 AB=CD (see black arrows) 127.2% Fib completion point at 0.9825, has so far contained price.
As highlighted in Tuesday’s morning report, the only grumble with selling the green H4 zone is the fact that there is little higher-timeframe resistance bolstering the area. Directly above the H4 resistance zone sits a daily resistance level at 0.9864 that could potentially encourage a fakeout. So trade carefully if you are considering a sell from here!
Market direction:
An ideal trade scenario, technically speaking, would be for H4 price to chalk up a selling wick that penetrates the upper edge of the said H4 resistance and connects with the daily resistance. However, do keep in mind that although the trade would then have daily resistance backing it, weekly price still shows room to extend beyond this region! According to the weekly scale, upside is reasonably free until the weekly supply zone painted at 1.0039-0.9973.
Should one enter into a short position at current prices, reducing risk to breakeven around the 0.98 handle could be an option. A violation of 0.98 clears the path south down to at least the 0.9780 region.
Data points to consider: US import prices m/m at 1.30pm GMT.
Areas worthy of attention:
Supports: 0.98 handle; 0.9780.
Resistances: 0.9852-0.9837; 0.9864; 0.9825; 1.0039-0.9973.
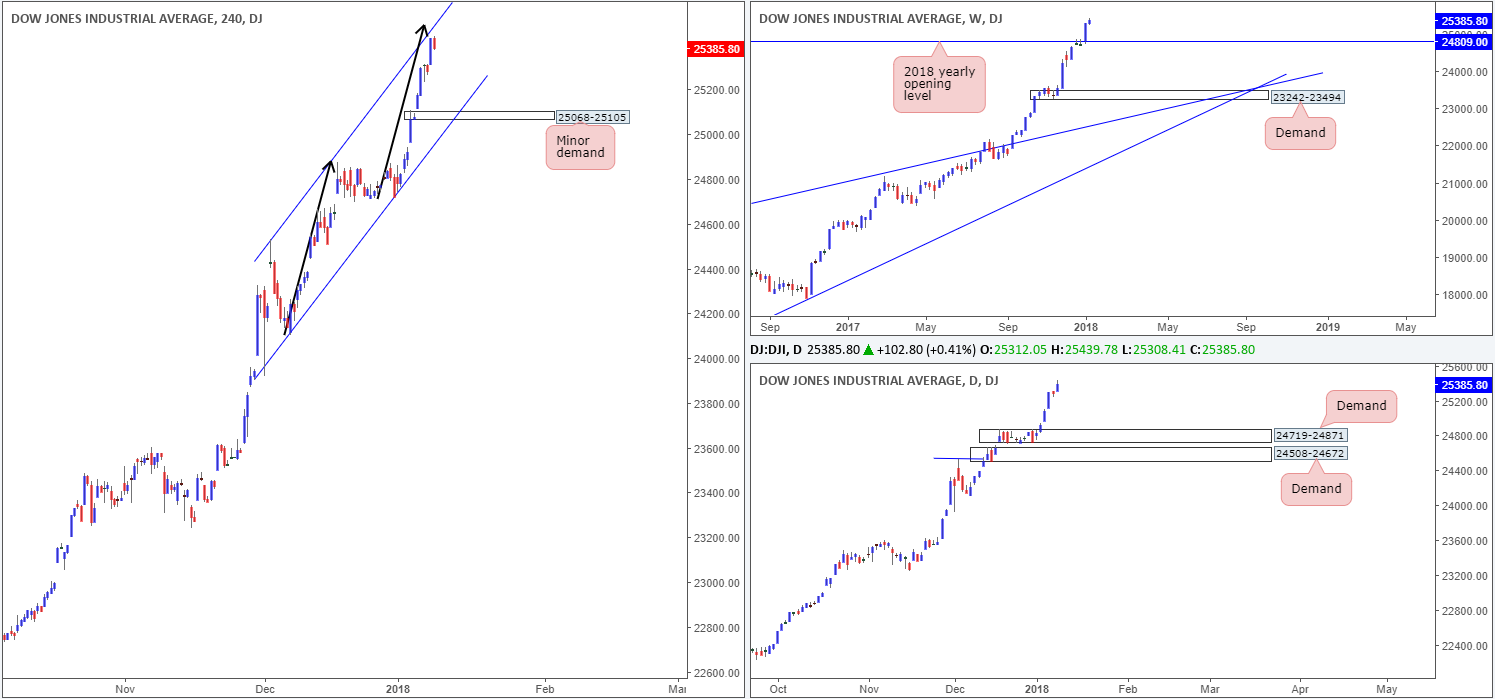
DOW 30:
The DJIA refreshed its record high on Tuesday at 25439. In order for the index to continue pumping higher, the H4 channel resistance extended from the high 24535 would need to be engulfed.
Before this happens, nevertheless, traders need to be prepared for the possibility of a pullback to a minor H4 demand base coming in at 25068-25105. Beyond this area, there’s little stopping the market from dropping down to challenge the daily demand at 24719-24871, which houses the 2018 yearly opening level at 24809.
Market direction:
Although the trend remains strong, this is still not a buyers’ market right now, in our view. Once/if H4 price engulfs the H4 channel resistance, however, then we do not see much stopping prices from moving higher, at least from a technical standpoint.
Buying on a dip seen down to the current minor H4 demand is also a possibility. However, as briefly touched on above, there is a strong chance that this area could fail given that daily action may want to test the demand seen below it at 24719-24871.
Data points to consider: US import prices m/m at 1.30pm GMT.
Areas worthy of attention:
Supports: 25068-25105; 24719-24871; 24809.
Resistances: H4 channel resistance.
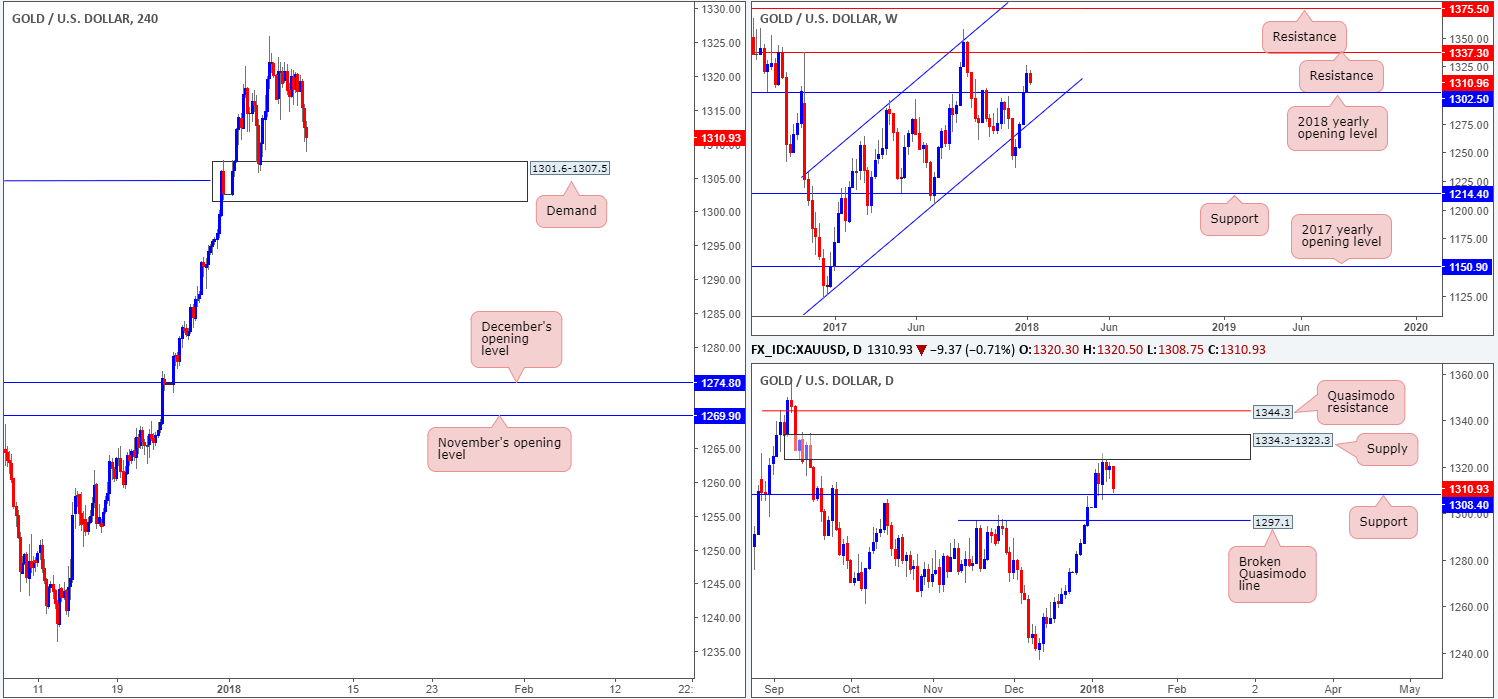
GOLD:
The yellow metal pulled back on Tuesday as the US dollar printed another healthy day of gains. On the H4 timeframe, this placed the candles within striking distance of a H4 demand area penciled in at 1301.6-1307.5. As emphasized in Tuesday’s morning report, this zone warrants attention. Not only was the area formed on the break of a H4 Quasimodo resistance logged at 1304.4 (keep an eye on these type of demand areas as they frequently deliver at least a bounce), it also houses the 2018 yearly opening level marked on the weekly timeframe at 1302.5 and is situated directly beneath a daily support at 1308.4. As you can see, the said daily support level is only a few pips from being tested. A fakeout beneath this hurdle to fill stops would permit H4 buyers to begin bidding from the aforesaid H4 demand.
Market direction:
With weekly price showing no resistance up until 1337.3, a long from the noted H4 demand could be an option. Yes, by entering into a buy trade from here, you’d effectively be buying from daily sellers at supply drawn from 1334.3-1323.3. But, given the fact that the H4 zone is reinforced by a neighboring daily support and a yearly opening level, the odds of a rotation to the upside from the H4 area is high, in our opinion.
For those considering a long from this region, the aforementioned daily supply is a likely first take-profit target, followed by weekly resistance mentioned above at 1337.3.
Areas worthy of attention:
Supports: 1301.6-1307.5; 1302.5; 1308.4.
Resistances: 1337.3; 1334.3-1323.3.
Legal Disclaimer
This site has been designed for informational and educational purposes only and does not constitute an offer to sell nor a solicitation of an offer to buy any products which may be referenced upon the site. The services and information provided through this site are for personal, non-commercial, educational use and display. IC Markets does not provide personal trading advice through this site and does not represent that the products or services discussed are suitable for any trader. Traders are advised not to rely on any information contained in the site in the process of making a fully informed decision.
This site may include market analysis. All ideas, opinions, and/or forecasts, expressed or implied herein, information, charts or examples contained in the lessons, are for informational and educational purposes only and should not be construed as a recommendation to invest, trade, and/or speculate in the markets. Any trades, and/or speculations made in light of the ideas, opinions, and/or forecasts, expressed or implied herein, are committed at your own risk, financial or otherwise.
The use of the site is agreement that the site is for informational and educational purposes only and does not constitute advice in any form in the furtherance of any trade or trading decisions.
The accuracy, completeness and timeliness of the information contained on this site cannot be guaranteed. IC Markets does not warranty, guarantee or make any representations, or assume any liability with regard to financial results based on the use of the information in the site.
News, views, opinions, recommendations and other information obtained from sources outside of www.icmarkets.com.au, used in this site are believed to be reliable, but we cannot guarantee their accuracy or completeness. All such information is subject to change at any time without notice. IC Markets assumes no responsibility for the content of any linked site. The fact that such links may exist does not indicate approval or endorsement of any material contained on any linked site.
IC Markets is not liable for any harm caused by the transmission, through accessing the services or information on this site, of a computer virus, or other computer code or programming device that might be used to access, delete, damage, disable, disrupt or otherwise impede in any manner, the operation of the site or of any user’s software, hardware, data or property.
Past performance will not and does not guarantee future performance. Investors are advised to take the services of a competent ‘Investment Adviser’, before making any final decision.


