
A note on lower timeframe confirming price action…
Waiting for lower timeframe confirmation is our main tool to confirm strength within higher timeframe zones, and has really been the key to our trading success. It takes a little time to understand the subtle nuances, however, as each trade is never the same, but once you master the rhythm so to speak, you will be saved from countless unnecessary losing trades. The following is a list of what we look for:
- A break/retest of supply or demand dependent on which way you’re trading.
- A trendline break/retest. Buying/selling tails – essentially we look for a cluster of very obvious spikes off of lower timeframe support and resistance levels within the higher timeframe zone.
- Candlestick patterns. We tend to only stick with pin bars and engulfing bars as these have proven to be the most effective.
For us, lower timeframe confirmation starts on the M15 and finishes up on the H1, since most of our higher timeframe areas begin with the H4. Stops usually placed 5-10 pips beyond your confirming structures.
EUR/USD:
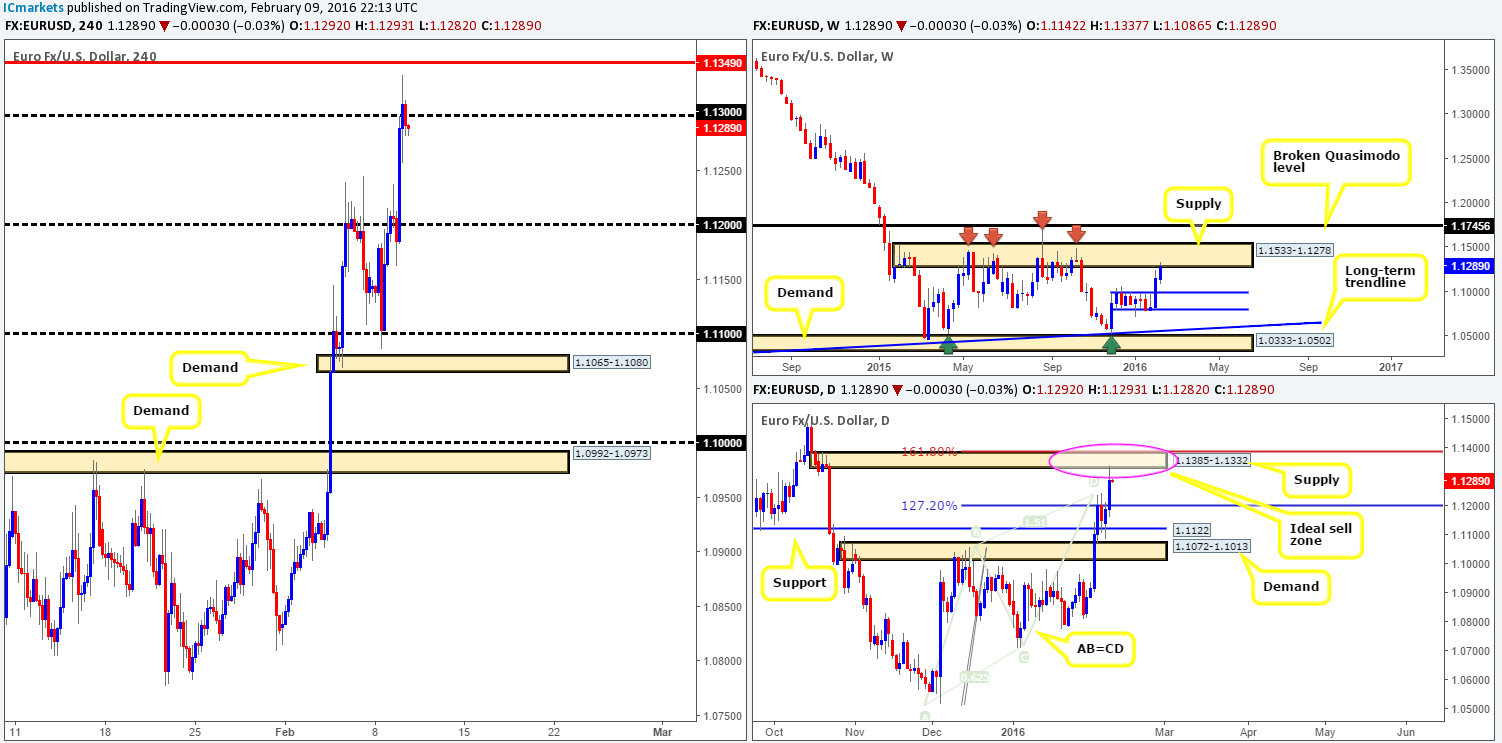
For those who have been following our EUR/USD reports lately, you may recall that we had a pending sell order set at 1.1330 (stop just above our daily supply zone at 1.1395) just below a daily supply zone at 1.1385-1.1332. As can be seen from the chart, our order was filled beautifully yesterday with as little as seven pips drawdown. Why this area, and why a pending order? Well, there were two main contributing factors to this trade:
- The daily supply zone itself sits within a weekly supply area at 1.1533-1.1278.
- On the daily timeframe a very clear Harmonic AB=CD bear pattern is in play right now. The sell zone (for us) can be seen between the 127.2% Fibonacci level at 1.1197 and the 161.8% at 1.1387 – the daily supply sits within the upper area of our Harmonic sell zone making it a perfect barrier in which to short.
With regards to our first take-profit target we’re eyeing the psychological support 1.1200. Looking at the H4 chart we can all see that price has closed below the 1.1300 figure, and we’re hoping it stays this way as this provides a ceiling of resistance for our trade today. The 1.1200 level also marks the top side of daily demand base (not marked on the chart) at 1.1086-1.1195, so a reaction here is very likely.
Levels to watch/live orders:
- Buys: Flat (Stop loss: N/A).
- Sells: 1.1330 [LIVE] (Stop loss: 1.1395).
GBP/USD:
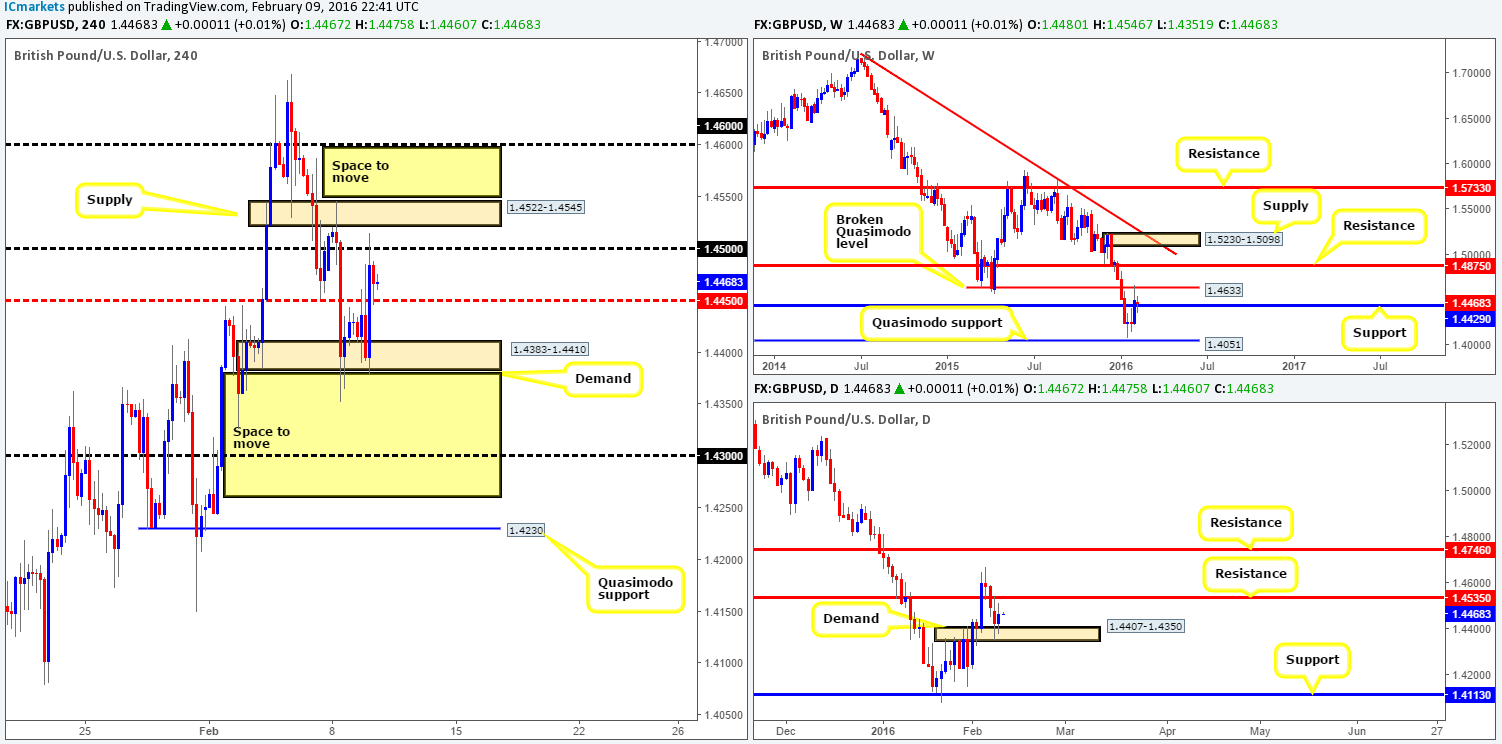
Kicking off our analysis with a quick look at the weekly chart this morning shows that following the sell-off from the broken Quasimodo level (BQM) at 1.4633, support taken from 1.4429 is still seen holding ground. Scrolling down to the daily chart, demand at 1.4407-1.4350 continues to bolster this market. However, before we place any significant weight on this daily zone, a break above near-term resistance at 1.4535 would need to take place as the path above here appears without limit up to resistance penciled in at 1.4746.
Zooming in and looking at the H4 chart, it is pretty clear that trading conditions are tight at the moment. Not only do we have demand at 1.4383-1.4410 capping downside, but we also have an already proven supply to the upside at 1.4522-1.4545. Furthermore, there are two psychological numbers (1.4500/1.4450) sitting in between these zones.
Given the points above, a break beyond either the H4 supply or demand zone would need to be seen before our team would consider this pair tradable. A break below demand has the psychological support 1.4300 to target, followed closely by a Quasimodo support at 1.4230. Conversely, a break above supply has at least the psychological resistance 1.4600 to reach. Both moves a tradable in our book should price retest the broken area (with confirmation) before hitting the respective targets.
Levels to watch/live orders:
- Buys: Watch for offers to be consumed around 1.4522-1.4545 and look to trade any retest seen thereafter (lower timeframe confirmation required).
- Sells: Watch for bids to be consumed around 1.4383-1.4410 and look to trade any retest seen thereafter (lower timeframe confirmation required).
AUD/USD:
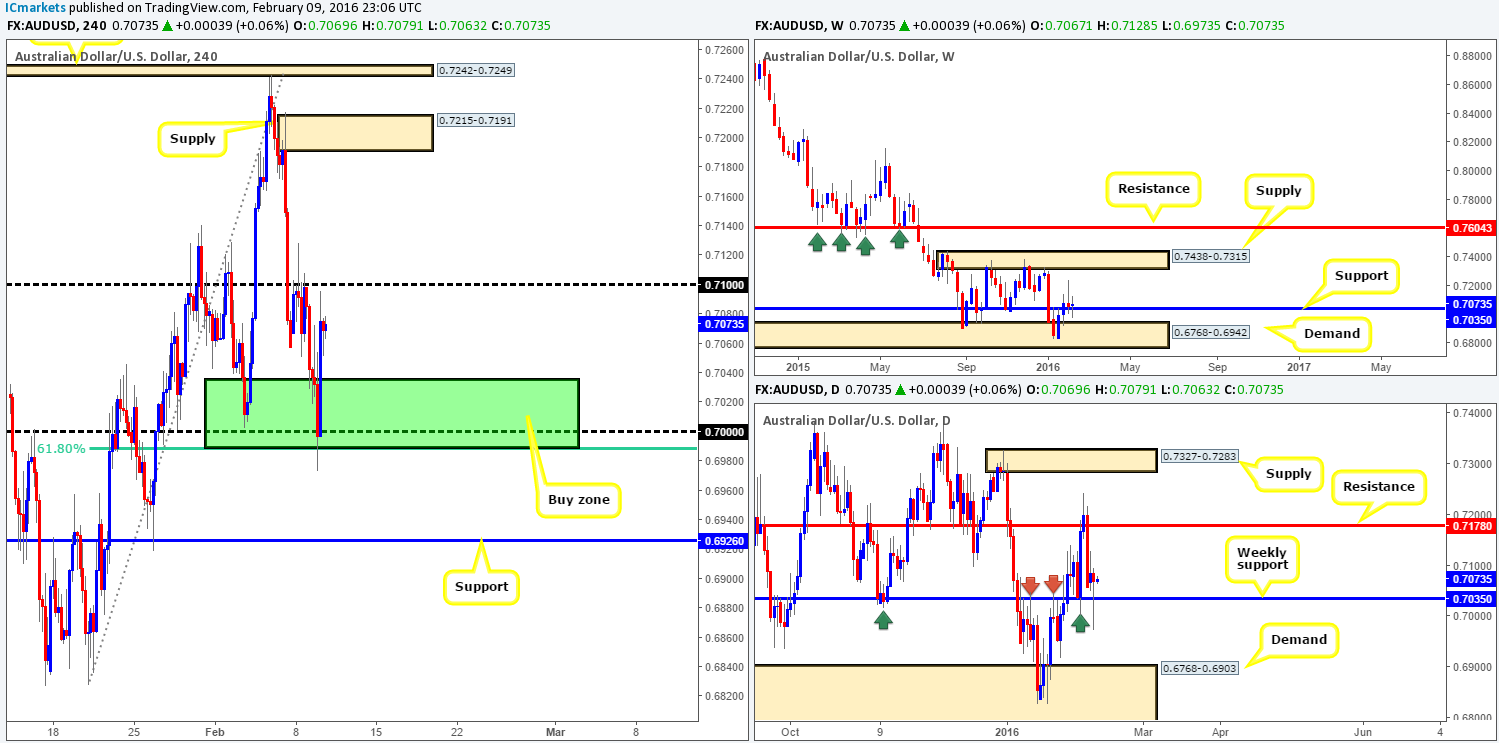
In our previous report (http://www.icmarkets.com/blog/tuesday-9th-february-daily-technical-outlook-and-review/) we noted that yesterday’s spotlight was on the green H4 buy zone drawn from 0.7035/0.6989. As show on the chart, price slightly pierced below our buy area before taking off north. What was interesting though, on the M15 there was a beautiful array of buying tails printed prior to the advance – this is exactly what we look for in confirmed trades. Well done to any of our readers who managed to jump on board this train!
Pushing forward, we’re ultimately looking for psychological resistance 0.7100 to be taken out today. Reason being is that above this hurdle there is little stopping the commodity currency from rallying up to H4 supply coming in at 0.7215-0.7191. Sponsoring this move is the fact that price is currently trading from weekly support at 0.7035 at the moment. Check out the clear daily buying tail printed from this region during yesterday’s session!
On the assumption that our above analysis is correct, we will be looking to trade the retest of 0.7100 following a close higher. Waiting for lower timeframe buying confirmation is something we insist on here since it is very difficult to know how deep 0.7100 will be retested.
Levels to watch/live orders:
- Buys: Watch for offers to be consumed around 0.7100 and look to trade any retest seen thereafter (lower timeframe confirmation required).
- Sells: Flat (Stop loss: N/A).
USD/JPY:
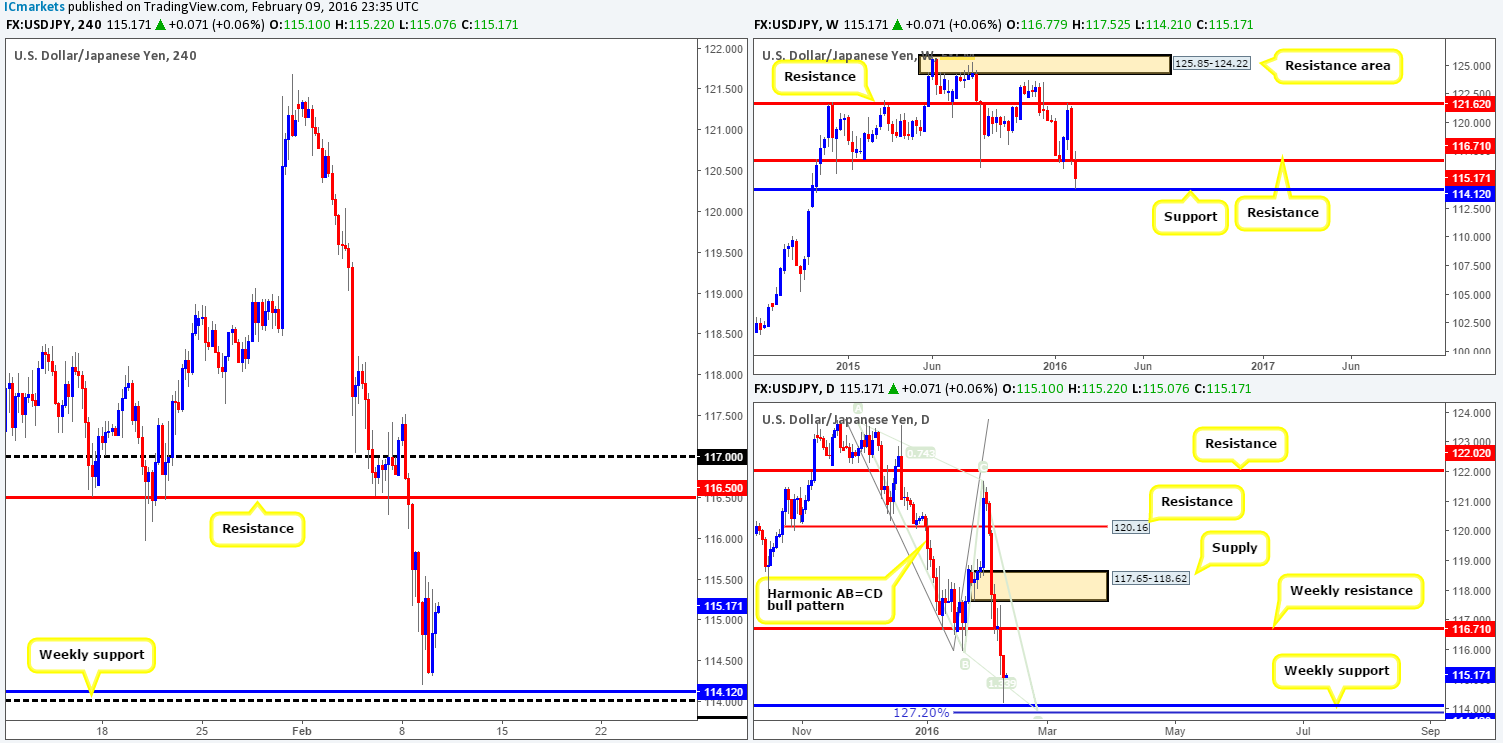
Another wet day for the USD/JPY yesterday brought the pair down to just above weekly support drawn from 114.12. In addition to this, the daily approach to this weekly level appears to have chalked up a Harmonic AB=CD bull pattern completing beneath the weekly support (127.2% at 113.81).
In view of the above points, we believe there is a possibility there will be further selling seen on this pair to connect with the AB=CD buy point, and more importantly connect with the weekly support. Granted, we could be wrong and the initial bounce seen yesterday was the beginning of a reversal maybe. Nevertheless, we’d much prefer to wait for these higher-timeframe zones to be hit before risking capital as we try to trade what we SEE and not what we FEEL!
In the event that price does indeed connect with the aforementioned higher-timeframe areas today, we would not consider trading this zone without confirming price action from the lower timeframes here. The reason for why is that the buy zone seen between the weekly support and the AB=CD 127.2% level is relatively small and is highly likely going to be faked prior to reversing.
Levels to watch/live orders:
- Buys: 114.12 region [Tentative – confirmation required] (Stop loss: dependent on where one confirms this area).
- Sells: Flat (Stop loss: N/A).
USD/CAD:
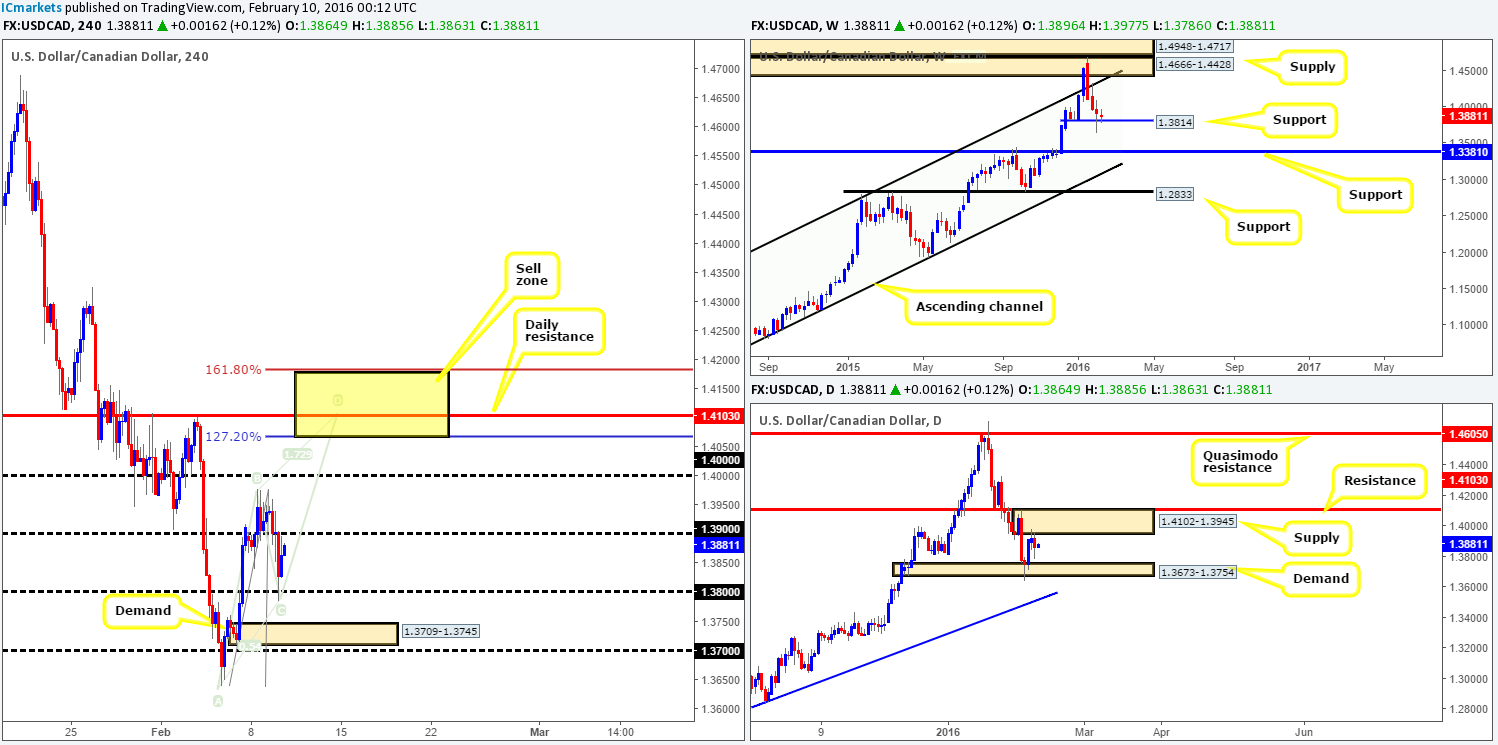
Throughout the course of yesterday’s sessions the Loonie pair sold off, breaking below psychological support 1.3900 and attacking psychological support 1.3800, which, as you can see, was strong enough to bounce prices back up to 1.3864 into the close.
Going forward, we can see that weekly price remains loitering just above support at 1.3814, whilst down on the daily chart, price is seen capped between supply at 1.4102-1.3945 and demand drawn from 1.3673-1.3754. Now, bearing this in mind, H4 action is currently seen painting a nice-looking AB=CD bearish pattern which completes between 1.4177/1.4067 (127.2%/161.8% Fibonacci extensions). This H4 pattern also terminates nicely at daily resistance coming in at 1.4103, which is parked one pip above the aforementioned daily supply.
Taking into account the recent selling this pair has seen, shorting the H4 AB=CD pattern is viable in our opinion. However, one must not forget that weekly action could springboard itself north from support at 1.3814 at any time and potentially take out this H4 zone. Therefore, we feel the best way to proceed is to simply set an alert at 1.4058, and then begin watching how the lower timeframe price action behaves. Ideally, a lower timeframe sell setup that forms around the above said daily resistance would be very nice as we could place our stop above 1.4177 (top-side of our H4 sell zone).
Levels to watch/live orders:
- Buys: Flat (Stop loss: N/A).
- Sells: 1.4177/1.4067 [Tentative – confirmation required] (Stop loss: dependent on where one confirms this area).
USD/CHF:
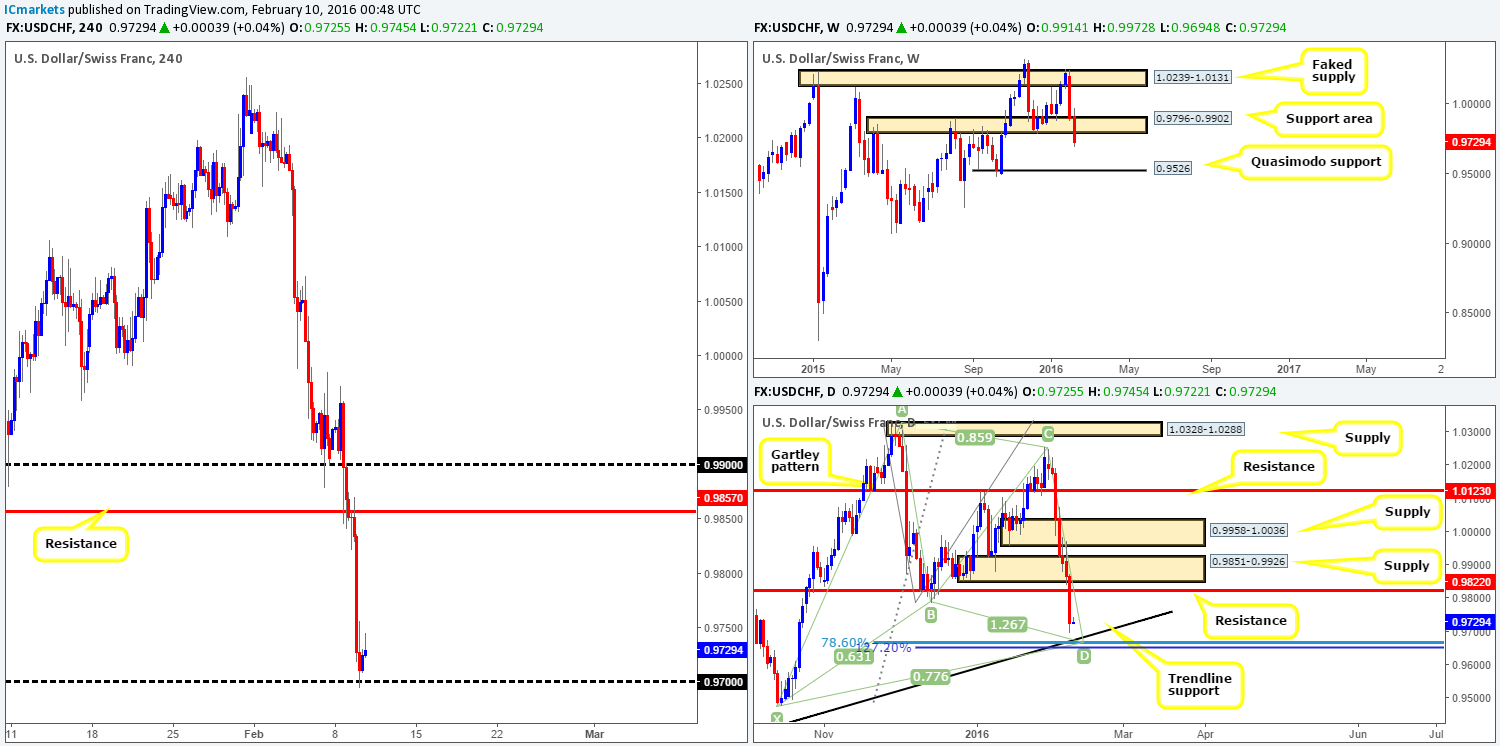
Consequent to yesterday’s 140-pip sell-off, we’ll begin looking at the weekly chart this morning. The support area at 0.9796-0.9902 was recently breached, potentially opening the path south for further selling down to a Quasimodo support level at 0.9526. However, it may be worth waiting for the weekly candle to close up shop before presuming that this weekly area is consumed.
Turning our attention to the daily chart, both demand (now supply) at 0.9851-0.9926 and support (now resistance) at 0.9822 were completely obliterated during yesterday’s bearish assault. This, as you can see, leaves the runway clear down to test trendline support extended from the low 0.9078 and the Harmonic Gartley reversal zone (78.6% Fibonacci level at 0.9669/127.2% Fibonacci extension at 0.9651).
Steeping down one more level to the H4, it’s clear to see that the bulls did not make an appearance yesterday until crashing into psychological support 0.9700. Looking to buy from 0.9700, when both the weekly and daily charts show room to move lower is not something we’d stamp high probability. This is, in our opinion, likely profit taking we’re seeing here. The level we have our eye on currently is the daily trendline support mentioned above since it converges beautifully with a Harmonic Gartley buy zone (see above). This is a little worrying for us since we’re currently short the EUR/USD! Nevertheless, traders should keep an eye on this area today as it will likely bounce prices higher – we would recommend waiting for lower timeframe confirmation here since the buy zone is relatively small and likely prone to a fakeout. With regards to targets, our first port of call would be the daily resistance level coming in at 0.9822.
Levels to watch/live orders:
- Buys: 0.9651/0.9669 [Tentative – confirmation required] (Stop loss: dependent on where one confirms this area).
- Sells: Flat (Stop loss: N/A).
DOW 30:
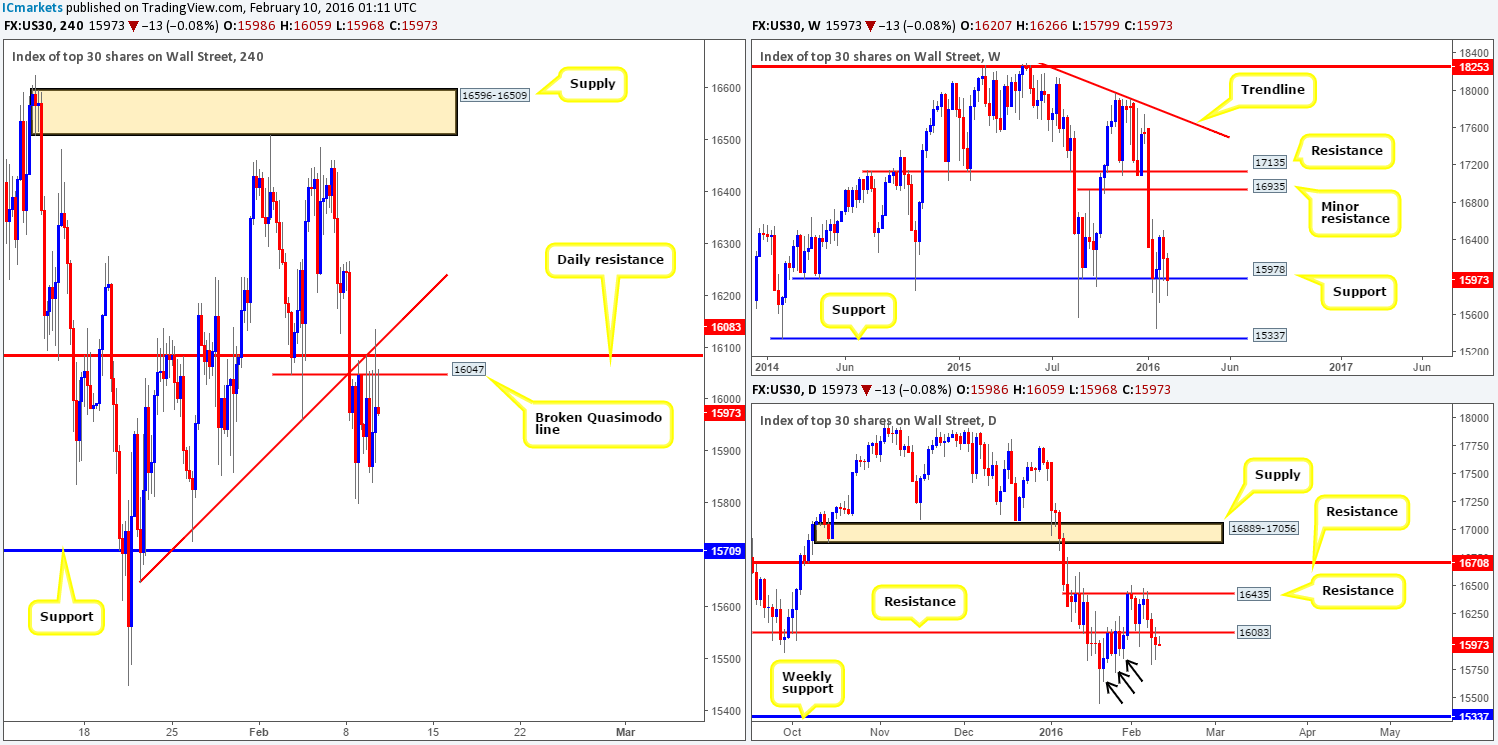
The DOW, as you can see, spent most of yesterday teasing the underside of the H4 broken Quasimodo level at 16047 – just look at all those selling wicks! Despite this, the market saw little follow-through selling. Consequent to yesterday’s rather quiet sessions, our outlook for the index remains the same as Tuesday’s report…
Weekly support at 15978 is still holding on in there but remains under pressure as far as we can see. In the event that this level does eventually cave in, price will likely look to cross swords with support formed at 15337. Branching down into the pits of the daily timeframe, support (now acting resistance) at 16083 was retested during yesterday’s session. Providing that this barrier holds firm, we see little active demand to the left of current price to stop this market from reaching the weekly support at 15337. Check out the demand consumption tails marked with black arrows at 15853/15725/15647. To us these indicate most of the buy orders here have already been filled.
Zooming in and looking at the H4 timeframe, we remain looking for lower timeframe confirmed sells between the aforementioned H4 broken Quasimodo level and the daily resistance level just above it at 16083. Unfortunately, we were not able to spot anything of value here yesterday, so we’ll continue hunting here for another day. The reason for requiring confirmation comes down to price still trading around the weekly support discussed above. Should this trade come to fruition, we’d be looking to target the H4 support 15709 first and foremost.
Levels to watch/live orders:
- Buys: Flat (Stop loss: N/A).
- Sells: 16047/16083 region [Tentative – confirmation required] (Stop loss: dependent on where one confirms this area).
XAU/USD: (Gold)
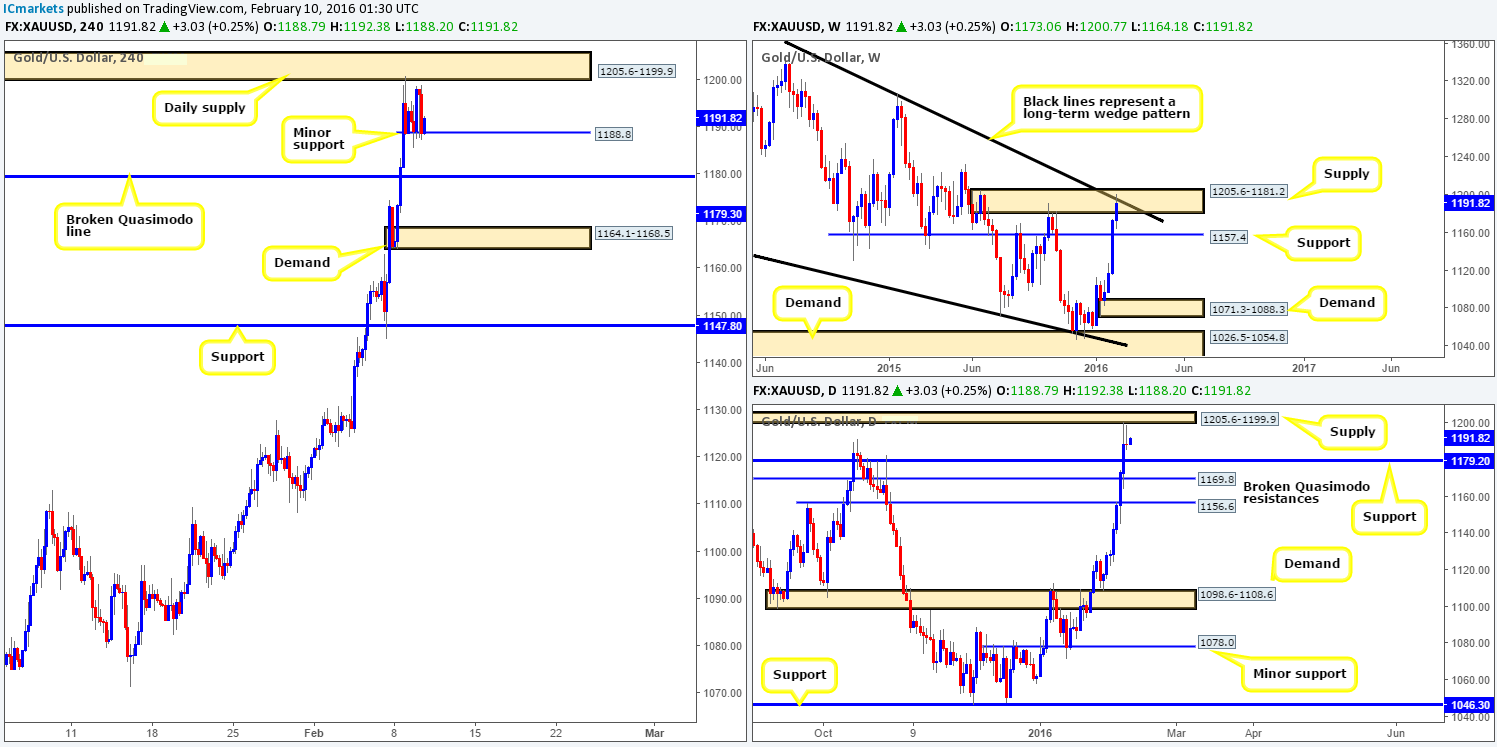
Following the recent drive into weekly supply at 1205.6-1181.2 (fuses together beautifully with the upper limit of a weekly wedge taken from the high 1488.0), a daily bearish selling wick printed around the underside of daily supply yesterday at 1205.6-1199.9. Could this be a sign that the yellow metal is heading south?
Looking to the H4 chart, it is clear to see that upside momentum has slackened off since reaching the above said daily supply area. Despite this, minor H4 support at 1188.8 is currently holding this market higher. Therefore, given this newly-formed support, we will not be taking any action until a H4 close beyond this barrier is seen. With a close lower, we can be relatively confident Gold is at least heading down to greet the broken H4 Quasimodo line at 1179.3 – just a few pips above daily support at 1179.2.
Ultimately, what we’re hoping for here is a close below the current H4 support, along with a small retest of this barrier as resistance. This, alongside lower timeframe confirmation, one can look to take advantage of this potential move down to the 1179.3 region.
Levels to watch/live orders:
- Buys: Flat (Stop loss: N/A).
- Sells: Watch for bids to be consumed around 1188.8 and look to trade any retest seen thereafter (lower timeframe confirmation required).


