A note on lower timeframe confirming price action…
Waiting for lower timeframe confirmation is our main tool to confirm strength within higher timeframe zones, and has really been the key to our trading success. It takes a little time to understand the subtle nuances, however, as each trade is never the same, but once you master the rhythm so to speak, you will be saved from countless unnecessary losing trades. The following is a list of what we look for:
- A break/retest of supply or demand dependent on which way you’re trading.
- A trendline break/retest. Buying/selling tails – essentially we look for a cluster of very obvious spikes off of lower timeframe support and resistance levels within the higher timeframe zone.
- Candlestick patterns. We tend to only stick with pin bars and engulfing bars as these have proven to be the most effective.
For us, lower timeframe confirmation starts on the M15 and finishes up on the H1, since most of our higher timeframe areas begin with the H4. Stops usually placed 5-10 pips beyond your confirming structures.
EUR/USD:
Much of the following analysis is similar Monday’s report.
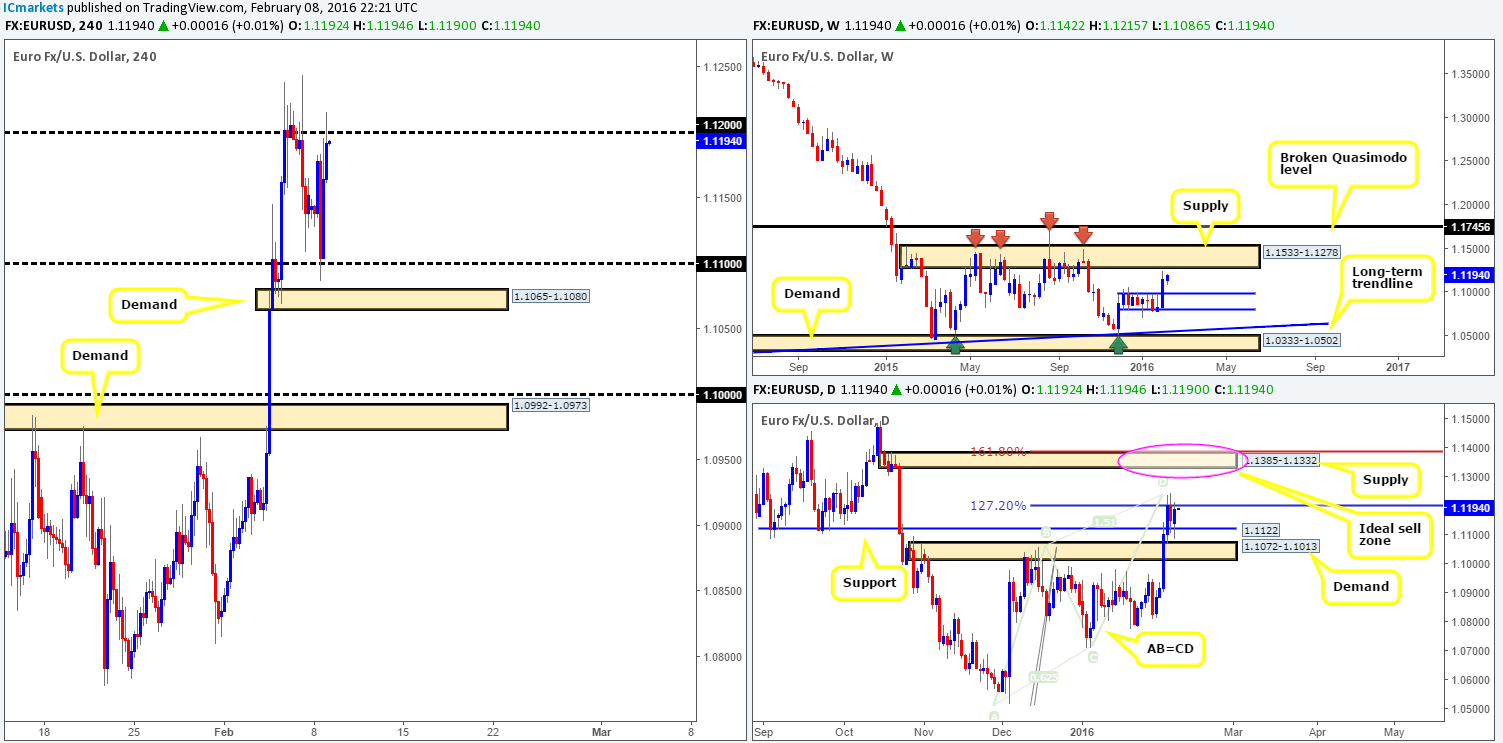
During the course of Monday’s sessions, the pair remained locked between two psychological boundaries 1.1100/1.1200. As we mentioned in yesterday’s report, the weekly timeframe can be seen trading within shouting distance of a major area of supply at 1.1533-1.1278. Meanwhile, down on the daily timeframe we can see that a very clear Harmonic AB=CD bear pattern is in play right now. What we also discussed in our previous analysis was that our sell zone from here comes in between the 127.2% Fibonacci level at 1.1197 and the 161.8% at 1.1387.
There has already been a slight reaction to the underside of this area, forcing the single currency to test support below it at 1.1122. Despite this small sell-off, we still believe this bearish pattern is in play as it has not yet fully completed in our opinion. With that being the case, we firmly believe that the daily supply zone painted above at 1.1385-1.1332 (the upper area of our Harmonic sell zone which also sits within the above said weekly supply) is by far the more logical sell area at the moment. Shorting from the 127.2% was not for us since it would have required an enormous stop loss.
Therefore, what we’re looking for today is a cut above 1.1200 as this will likely confirm the EUR wants to trade higher. This could potentially open up the path north to psychological resistance 1.1300 and possibly into our pending sell placed at 1.1330 (stop just above our daily supply zone at 1.1395).
Right now there is little else that interests us on this pair other than the aforementioned daily supply. Trading long on the break of 1.1200, even though prices may want to climb higher is not something that we would label high probability due to the aforementioned higher-timeframe supplies (see above). Should the market close below the small H4 demand at 1.1065-1.1080, however, we can pretty much conclude that our daily zone will not likely come into the picture this week and then begin looking into shorting down to H4 demand drawn from 1.0992-1.0973.
Levels to watch/live orders:
- Buys: Flat (Stop loss: N/A).
- Sells: 1.1330 [Pending order] (Stop loss: 1.1395).
GBP/USD:
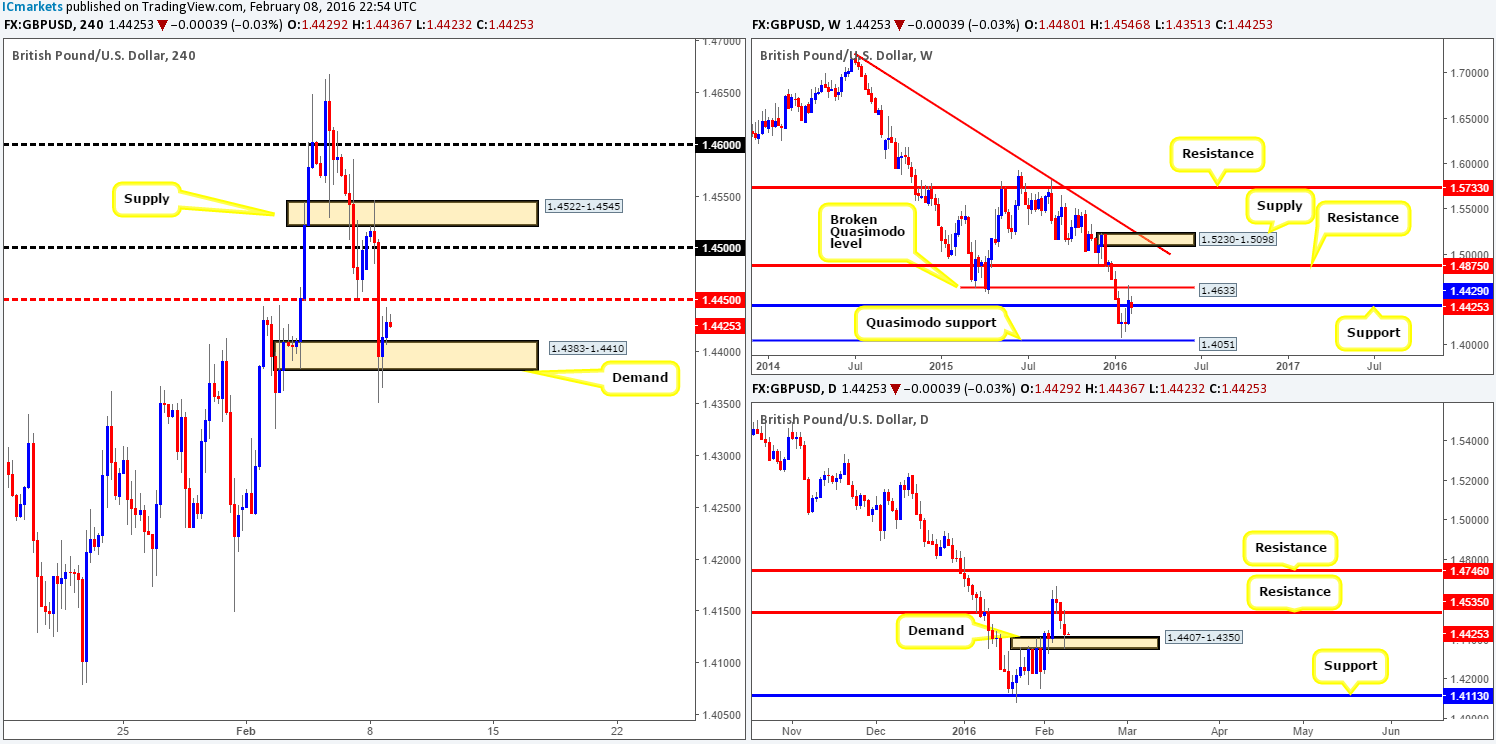
Following Sunday’s open 1.4480, Cable squeezed out any offers from psychological resistance 1.4500 and slightly jabbed above H4 supply at 1.4522-1.4545, before aggressively selling off. This bearish assault ended with price whipsawing through H4 demand at 1.4383-1.4410, and reversing back up to the 1.4430 region into the day’s close.
In light of this recent selling, how do things stand on the higher timeframes? Well, up on the weekly chart, the sell-off from the broken Quasimodo level (BQM) at 1.4633 continues to weigh down on price at current support drawn from 1.4429. Down on the daily timeframe, nevertheless, market action punched itself deep into demand painted at 1.4407-1.4350, which sits just below the aforementioned weekly support barrier.
As far as we can see from the points made above, technical elements are just too mixed for us to be confident trading this pair today. For example: will weekly buyers be able to defend against the current selling? Has stops from the H4 demand been taken out? Daily demand looks soft despite being tested at its extremes – further selling? When one is unsure, it is best, at least from our experience, to stay on the sidelines as it would not likely do your account any favors.
Levels to watch/live orders:
- Buys: Flat (Stop loss: N/A).
- Sells: Flat (Stop loss: N/A).
AUD/USD:
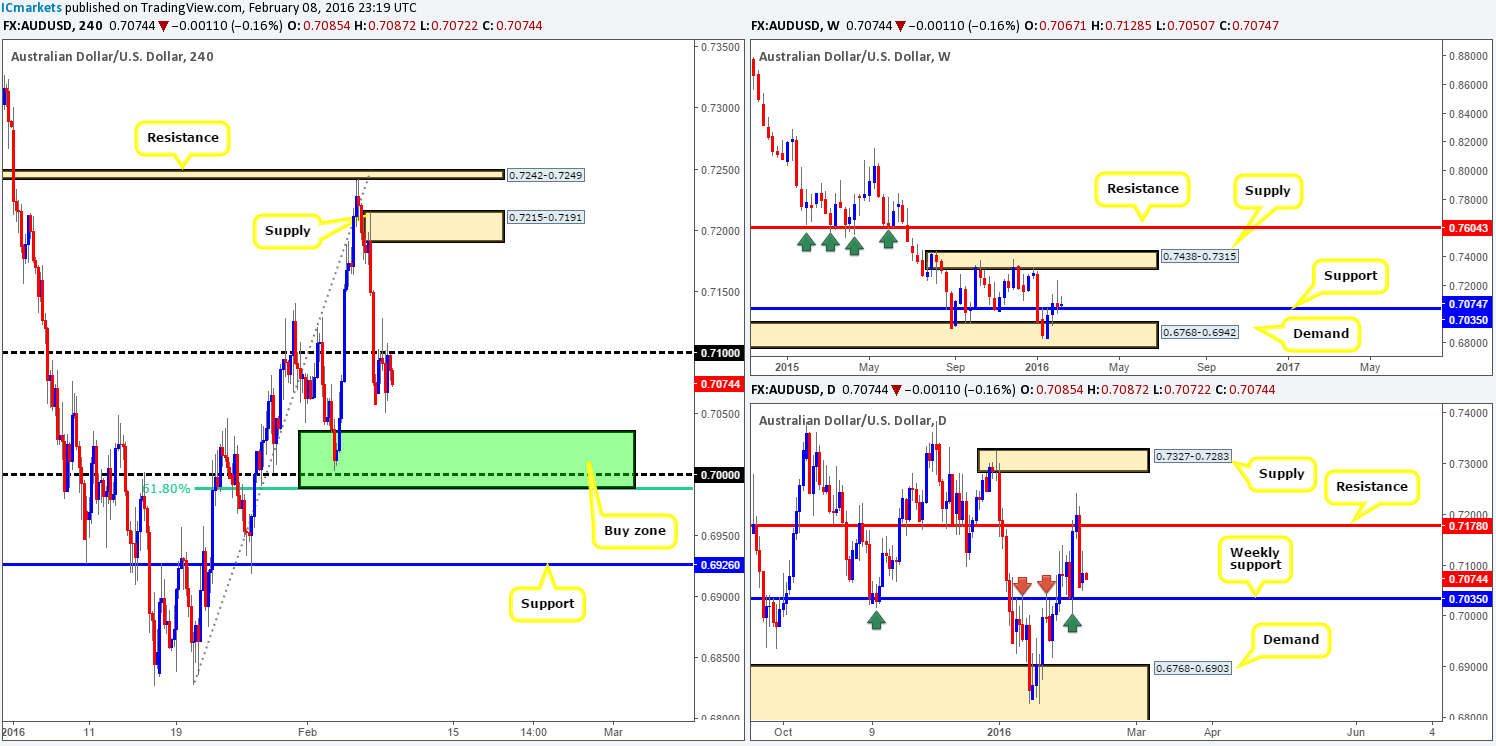
The Aussie dollar began the week well-bid from 0.7061. However, shortly after price entered into a phase of consolidation within a relatively tight range between psychological resistance 0.7100 and the 0.7065 region. Consequent to this rather lackluster performance our outlook for this pair remains unchanged.
As such, today’s spotlight continues to be focused on the green H4 buy zone fixed between 0.7035/0.6989. The reasons for choosing this particular area come from the following converging structures:
- The large psychological support 0.7000.
- Just beneath this 0.7000 sits a 61.8% Fibonacci level at 0.6989.
- And finally, the weekly support barrier which lurks 35 pips above 0.7000 at 0.7035. Check out how responsive the aforementioned weekly support has been in the past on the daily timeframe (see arrows). Each time price visited this barrier, a sizable reaction was seen.
The bounce from this barrier could potentially be large so we’re willing to be patient here. One could enter at market within this zone without waiting for confirmation in our opinion, but for us personally we have chosen to look to the lower timeframes for our entry since we want to get in as low as possible on this one.
Levels to watch/live orders:
- Buys: 0.7035/0.6989 [Tentative – confirmation preferred] (Stop loss: dependent on where one confirms this area).
- Sells: Flat (Stop loss: N/A).
USD/JPY:
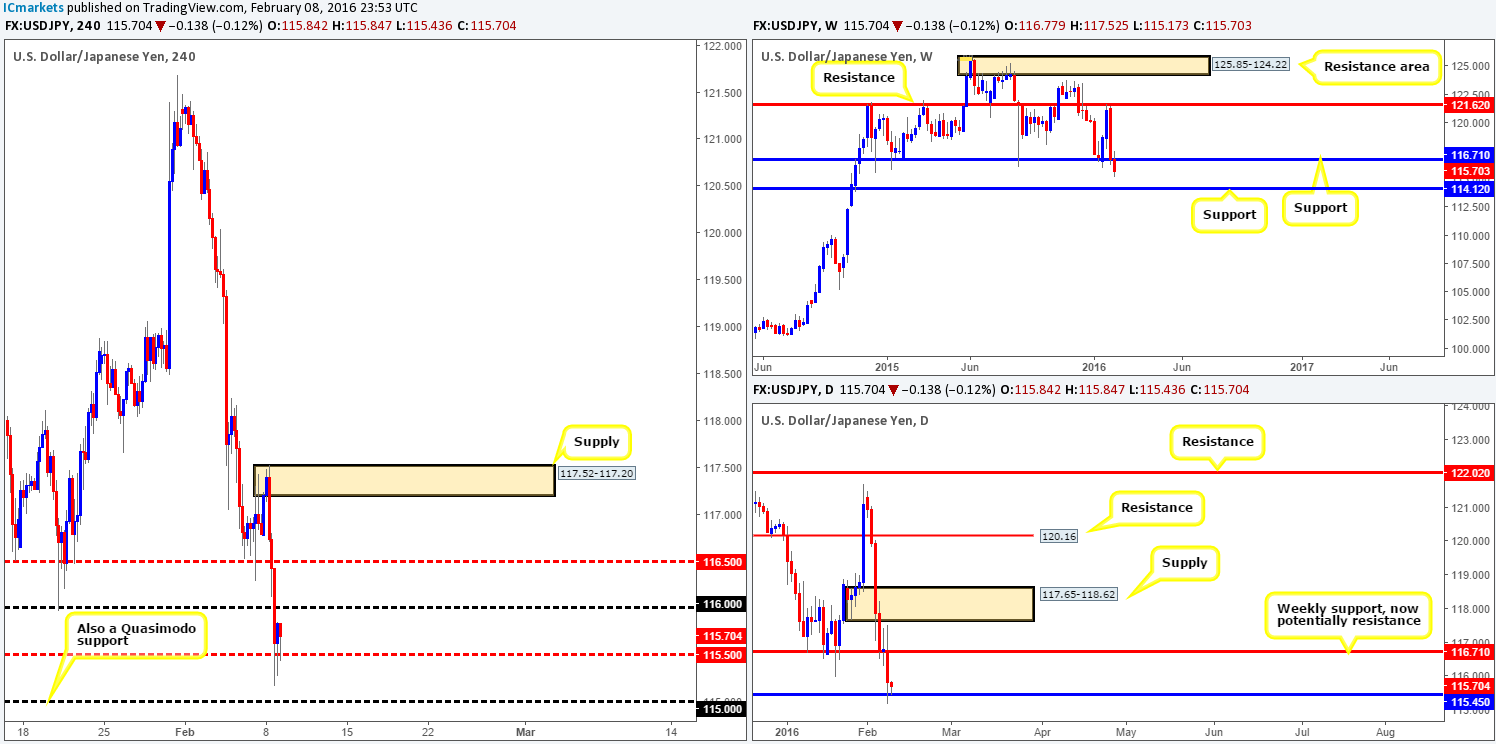
Beginning with the weekly timeframe this morning, support at 116.71 has been breached with price now looking as though it’s headed for support drawn from 114.21. Zooming in to the daily timeframe, we can see that there is support now in play from the 115.45 region, which could halt further selling today. Between the weekly and daily timeframes, this current daily support is all that stands in the way of price reaching the weekly support mentioned above at 114.21.
Looking at this pair from the H4 chart, it was clearly not a good day for the buyers yesterday! Several technical supports were taken out with price ending the session testing mid-level support 115.50. Given the H4 buying tails recently printed at this number along with clear higher lows and the fact that daily action is trading from support, there could be a bounce higher from here up to at least psychological resistance 116.00. Be that as it may, by entering long from this region you are potentially going up against weekly flow (see above in bold). Given this, we’re not overly keen on this setup and will remain flat. For those that have confidence in this level, we would advise only trading this barrier if corresponding lower timeframe confirmation is seen.
Levels to watch/live orders:
- Buys: Flat (Stop loss: N/A).
- Sells: Flat (Stop loss: N/A).
USD/CAD:
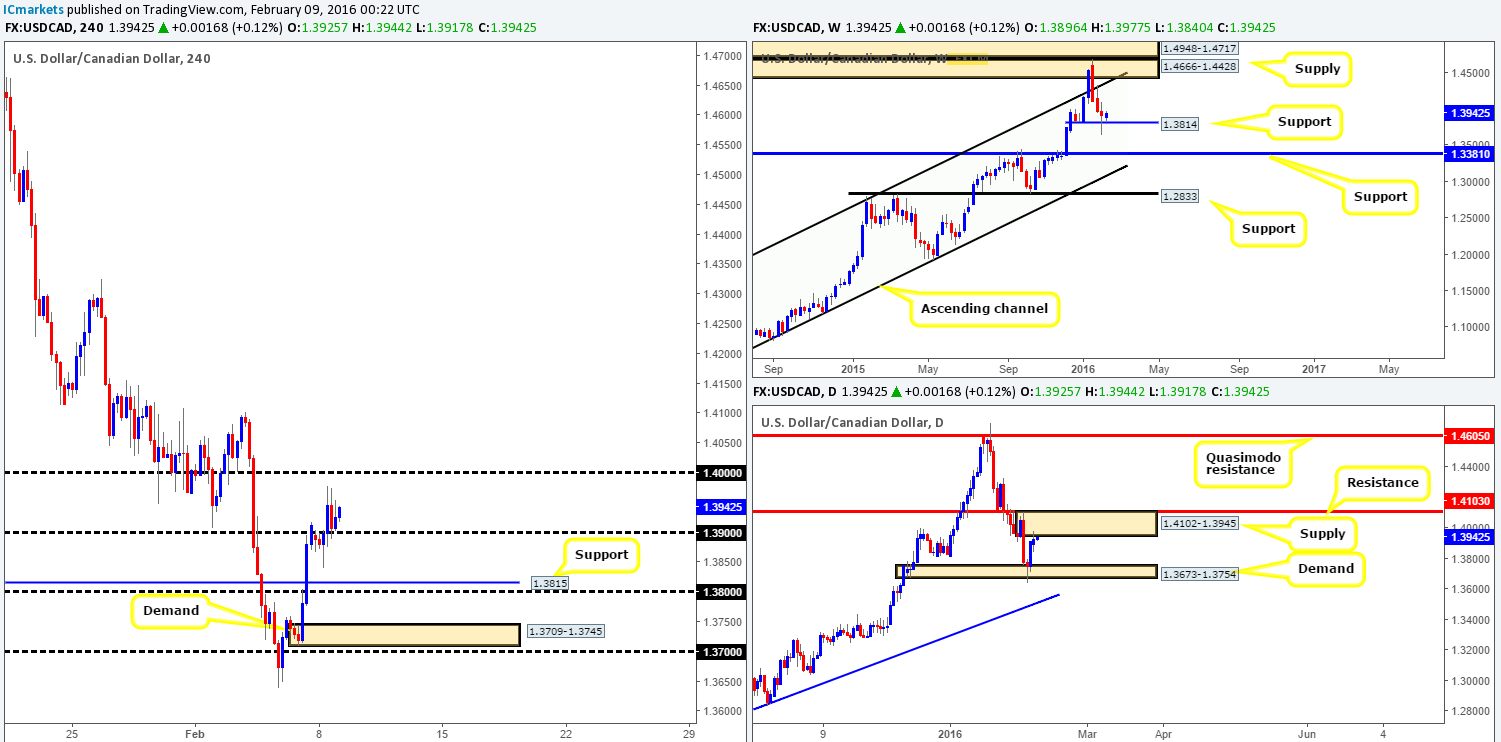
Mid-way through London trading yesterday, the USD/CAD pair forcefully closed above psychological resistance 1.3900 and shortly after was retested as support. At this point, we have yet to see any lower timeframe price action telling us to enter long from this number, which is a shame since this market is likely heading to shake hands with the large psychological resistance 1.4000 today.
At this point you may be thinking why are they looking to enter long when price is trading around the underside of a daily supply at 1.4102-1.3945? The answer simply comes from seeing weekly action trading from support at 1.3814. And besides, should a long position be taken from 1.3900 the 1.4000 target is still housed within the current daily supply, so we’re not looking for it to be consumed, just tested to the extreme.
In the event that 1.3900 caves in, however, then all eyes would be on the H4 support coming in at 1.3815 as the next target objective. A close below 1.3900 would, in our opinion, confirm strength from the daily supply and possible weakness around the weekly support hurdle. To trade a move below 1.3900, we’d need to see this number retested as resistance alongside lower timeframe selling confirmation.
Levels to watch/live orders:
- Buys: 1.3900 [Tentative – confirmation required] (Stop loss: dependent on where one confirms this level).
- Sells: Watch for bids to be consumed around 1.3900 and look to trade any retest seen thereafter (lower timeframe confirmation required).
USD/CHF:
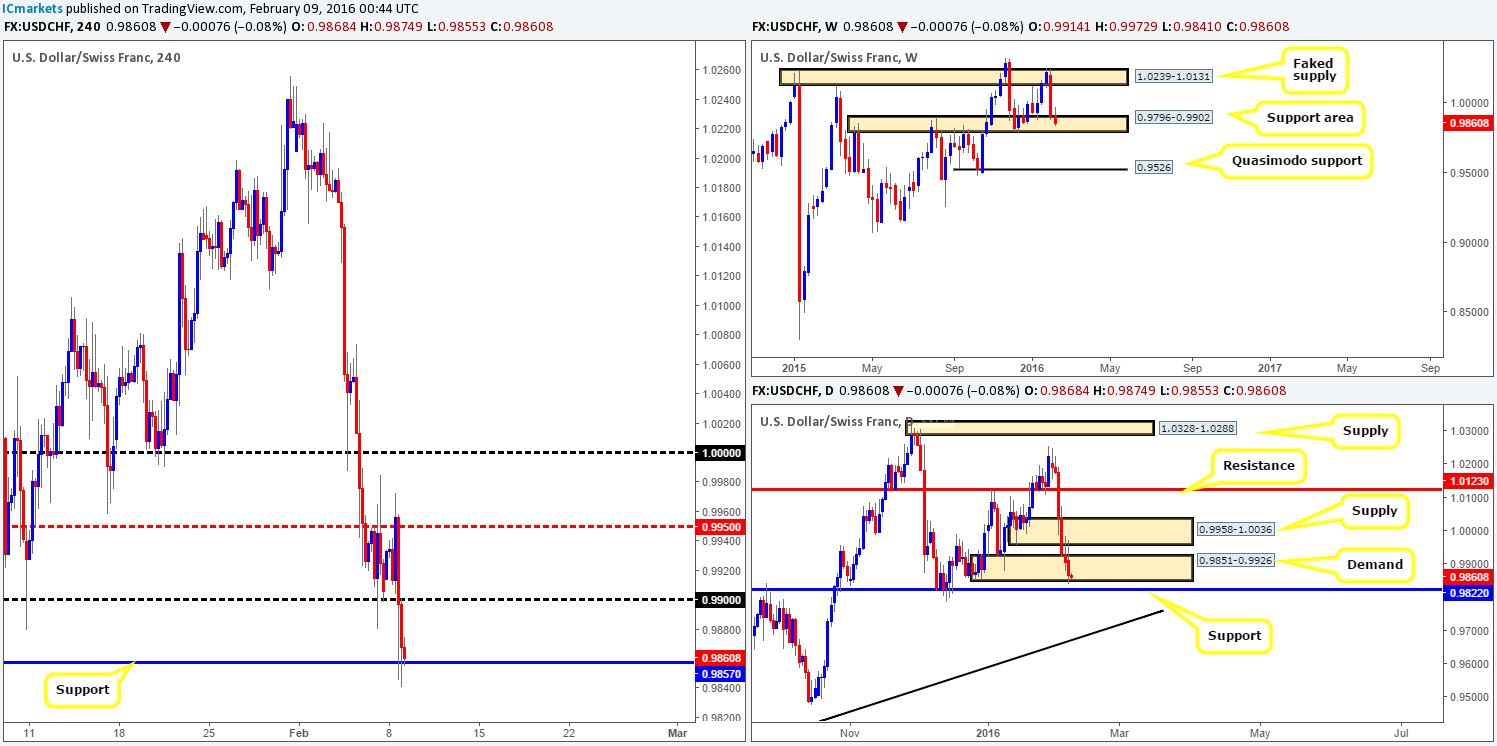
Coming at you directly from the weekly timeframe this morning, we can see that the USD/CHF is diving deeper into the support area painted between 0.9796-0.9902. Moving down into the daily timeframe, however, demand at 0.9851-0.9926 came under pressure recently, but still remains intact for now. The next downside target to reach from here comes in at support drawn from 0.9822.
The recent selling saw price wipe out psychological support 0.9900 yesterday and aggressively clash with H4 support at 0.9857. Check out the H4 buying tails printed at this level, this at least to us shows that there are interested buyers here.
In view of the above, our prime focus today will be on the current H4 support barrier for confirmed longs. The first take-profit target from here comes in at 0.9900, followed closely by mid-level resistance 0.9950 and then depending on how price action behaves here, the final take-profit is set at 1.0000 (parity). Supposing that 0.9857 gives way, nonetheless, then the daily support mentioned above at 0.9822 will be next on our radar.
Levels to watch/live orders:
- Buys: 0.9857 [Tentative – confirmation required] (Stop loss: dependent on where one confirms this level).
- Sells: Flat (Stop loss: N/A).
DOW 30:
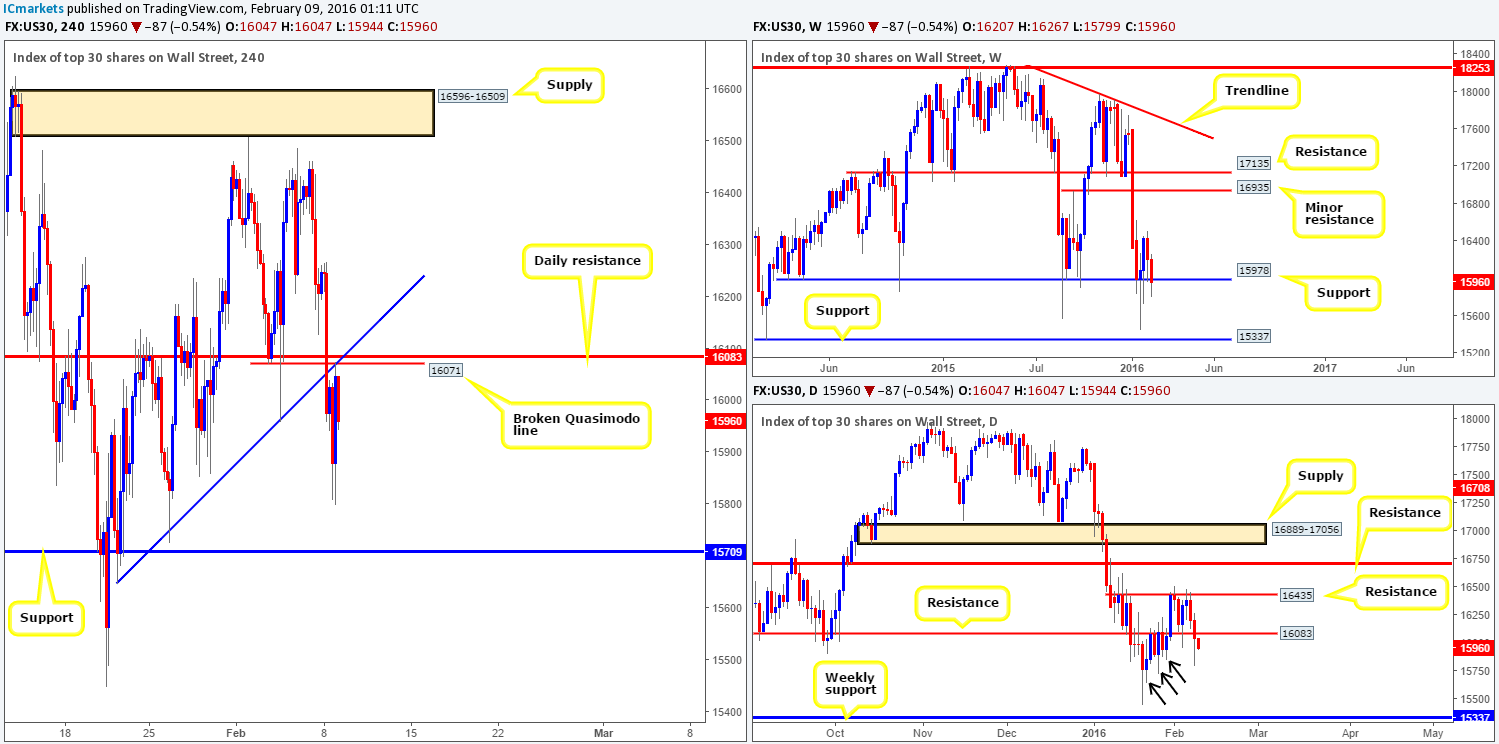
The DOW’s weekly support at 15978 seems to be struggling at the moment, as over the past month there’s been very little registered from this barrier. In the event that this continues, we might see price break lower and potentially look to cross swords with support formed at 15337. Branching down into the pits of the daily timeframe, support (now acting resistance) at 16083 was taken out during yesterday’s session. Beyond this level, we see little active demand to the left of current price to stop this market from reaching the weekly support at 15337. Check out the demand consumption tails marked with black arrows at 15853/15725/15647. To us these indicate most of the buy orders here have already been filled.
Stepping down into the H4 arena, our buy trade taken from 16083 yesterday was a complete failure as we were stopped out at 15950. Reasons for looking to enter long here were as follows:
- H4 Quasimodo support (now resistance) level is seen drawn from 16047.
- A H4 trendline support (now resistance) extended from the low 15647.
- Daily support (now resistance) at 16083.
However, going into yesterday’s close the underside of our buy zone was retested as resistance and is, at the time of writing, holding firm. It appears we may have missed the boat for a touch trade (pending order) here, but we may be able to jump in this one later on should lower timeframe action chalk up a setup. The reason for requiring confirmation here comes down to price still trading around the weekly support discussed above. Should this trade come to fruition, we’d be looking to target the H4 support 15709 first and foremost.
Levels to watch/live orders:
- Buys: Flat (Stop loss: N/A).
- Sells: 16083 region [Tentative – confirmation required] (Stop loss: dependent on where one confirms this area).
XAU/USD: (Gold)
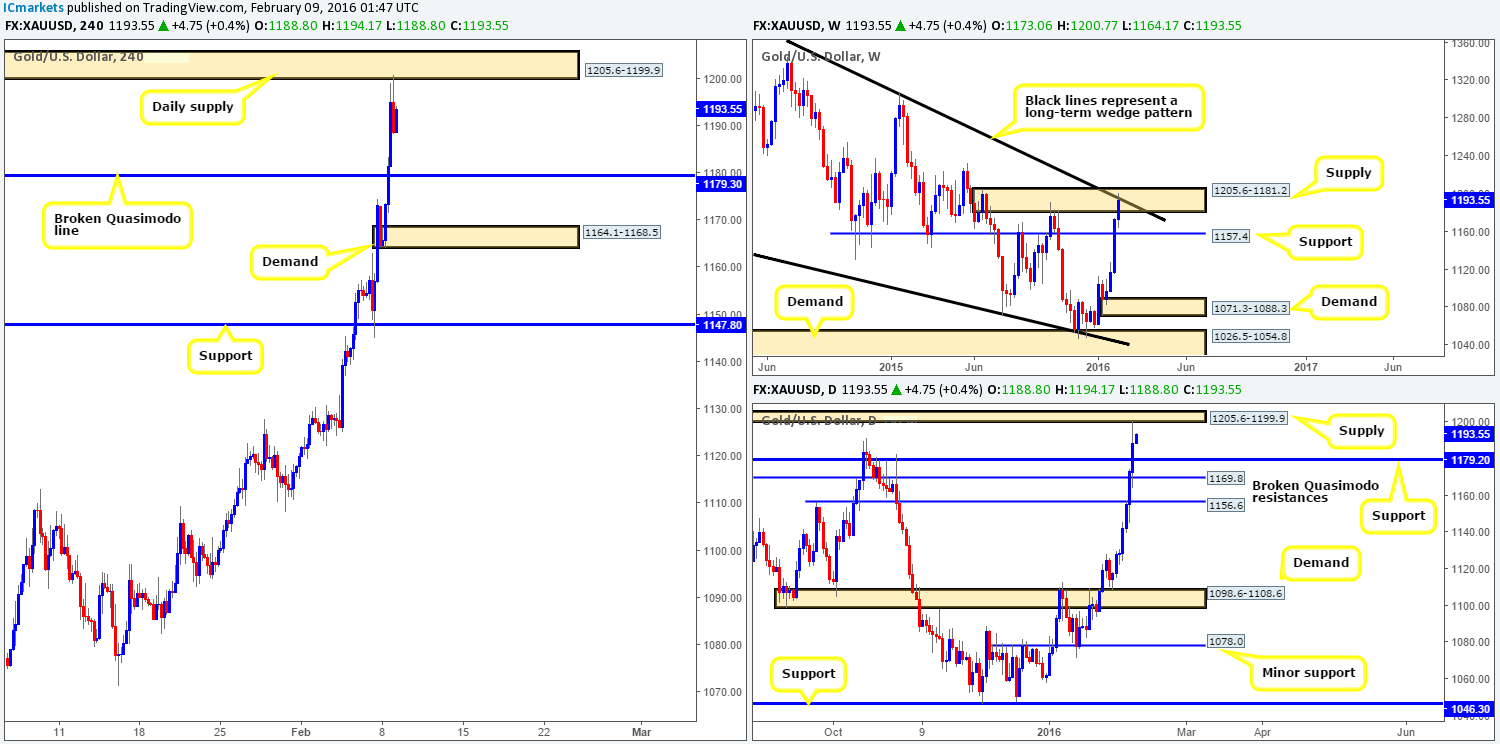
As we can all see the yellow metal continues to advance higher on the weekly timeframe, consequently breaking into supply at 1205.6-1181.2 (fuses together beautifully with the upper limit of a weekly wedge taken from the high 1488.0).This, at least from a technical standpoint, is a seriously strong-looking ceiling of resistance.
Turning our attention to the daily timeframe, it’s clear to see that Gold has already rebounded from supply penciled in at 1205.6-1199.9. This is an extreme area of supply located high within the aforementioned weekly supply area. Should this barrier hold the next downside target to be aware of falls in at support drawn from 1179.2.
As we move down into the H4 timeframe, one can see just how precise the rebound was from the underside of daily supply at 1205.6-1199.9. Considering that all three timeframes now show price trading from supply, our team’s attention will be driven toward shorts today. Looking to the M30 timeframe, the low 1189.3 has been taken out, thus potentially opening the path south for further selling down to H4 support at 1179.3. Ultimately for us to sell here though, we’d need to see Gold retrace back up to the aforementioned daily supply which is where we’d enter the market to get the best price, with our stop above at 1207.5, and our take-profit target set at 1179.3. It will be interesting to see how this plays out.
Levels to watch/live orders:
- Buys: Flat (Stop loss: N/A).
- Sells: 1199.9 [Market entry (Stop loss: 1207.5).