Employed by traders and investors globally, Fibonacci analysis helps identify future price movements within the framework of technical analysis.
Arguably the most talented western mathematician of the middle ages was Leonardo Pisano – also known as Leonardo of Pisa or Fibonacci – the gentleman who unearthed Fibonacci relationships.
The Fibonacci sequence
0, 1, 1, 2, 3, 5, 8, 13, 21, 34…
The Fibonacci sequence forms by way of a series of numbers starting from 0 and 1. The next number is found by adding the two numbers before it. 3 is found by adding 1 and 2, for example, 5 is found by adding 2 and 3 and 55, the next number in the sequence displayed above, is found by adding 21 and 34.
A distinguishing fact is each number in the series is approximately 61.8% of the next number. As an example, divide 21 by 34 and you have 0.617, divide 2 by 3 and we get 0.666 and dividing 34 by 55 equates to 0.618. The higher the values, the closer the ratio to 61.8%.

It might also interest Fibonacci fans that 38.2%, another important ratio within the Fibonacci family, is found by dividing a Fibonacci value by the value two places to the right. Using the Fibonacci sequence above, dividing 3 by 8 equates to 0.375, and dividing 13 by 34 you’ll get 0.382. In addition, 23.6%, another Fibonacci value, is found by dividing a Fibonacci value by the value sited three places to the right.
The universe may be unpredictable, but it’s also a highly organised physical realm bound by the laws of mathematics. One of the most fundamental ways these laws manifest is through the ‘golden ratio’, or ‘golden proportion’. The golden ratio is 1.618, called ‘phi’. The exact inverse of 1.618 is 0.618.
Interestingly, the golden ratio is a phenomenon commonly expressed in nature, music, art and even human bodies.
A seashell is one of the most well-known examples of the golden ratio in nature. Ocean waves are another example, as are snail shells. The human mouth and nose are, on average, positioned at golden sections of the distance between the eyes and the bottom of the chin.
Within the financial markets, nevertheless, the 38.2% and 61.8% are key Fibonacci ratios. Some traders also use the 50.0% ratio to trade, although not a Fibonacci ratio, as it has proven useful. Often price action retraces 50% of its preceding move before continuing its original direction. In addition to this, 78.6% and 88.6% are also popular Fibonacci ratios, found by calculating the square root of 0.618 and 0.786, respectively.
Fibonacci retracements
Fashioned by two extreme points on a chart, Fibonacci retracements are levels used to identify probable reversal points on all timeframes. Fortunately, today’s modern charting software simplifies the application process, allowing traders the ability to plot Fibonacci levels in seconds. To apply the Fibonacci retracement tool, simply select the chart‘s low point, in the case of an uptrend, and drag the cursor to the chart’s high price. The indicator will then overlay key horizontal lines to work with.
Arguably, basic Fibonacci retracement levels are the cornerstone behind most Fibonacci readings, with widespread appreciation for 61.8% and 38.2% values. The general idea is to enter long on a pullback at a Fibonacci retracement ratio when the market is trending north, and to sell in a correction within a downtrend.
Figure 1.1 demonstrates the 88.6% Fibonacci ratio in motion. This is a ‘deep’ level, enabling traders the option of entering the market at an incredibly cheap zone (overbought). This was a relatively easy Fibonacci level to place, using the major swing high and swing low (red and green arrows).
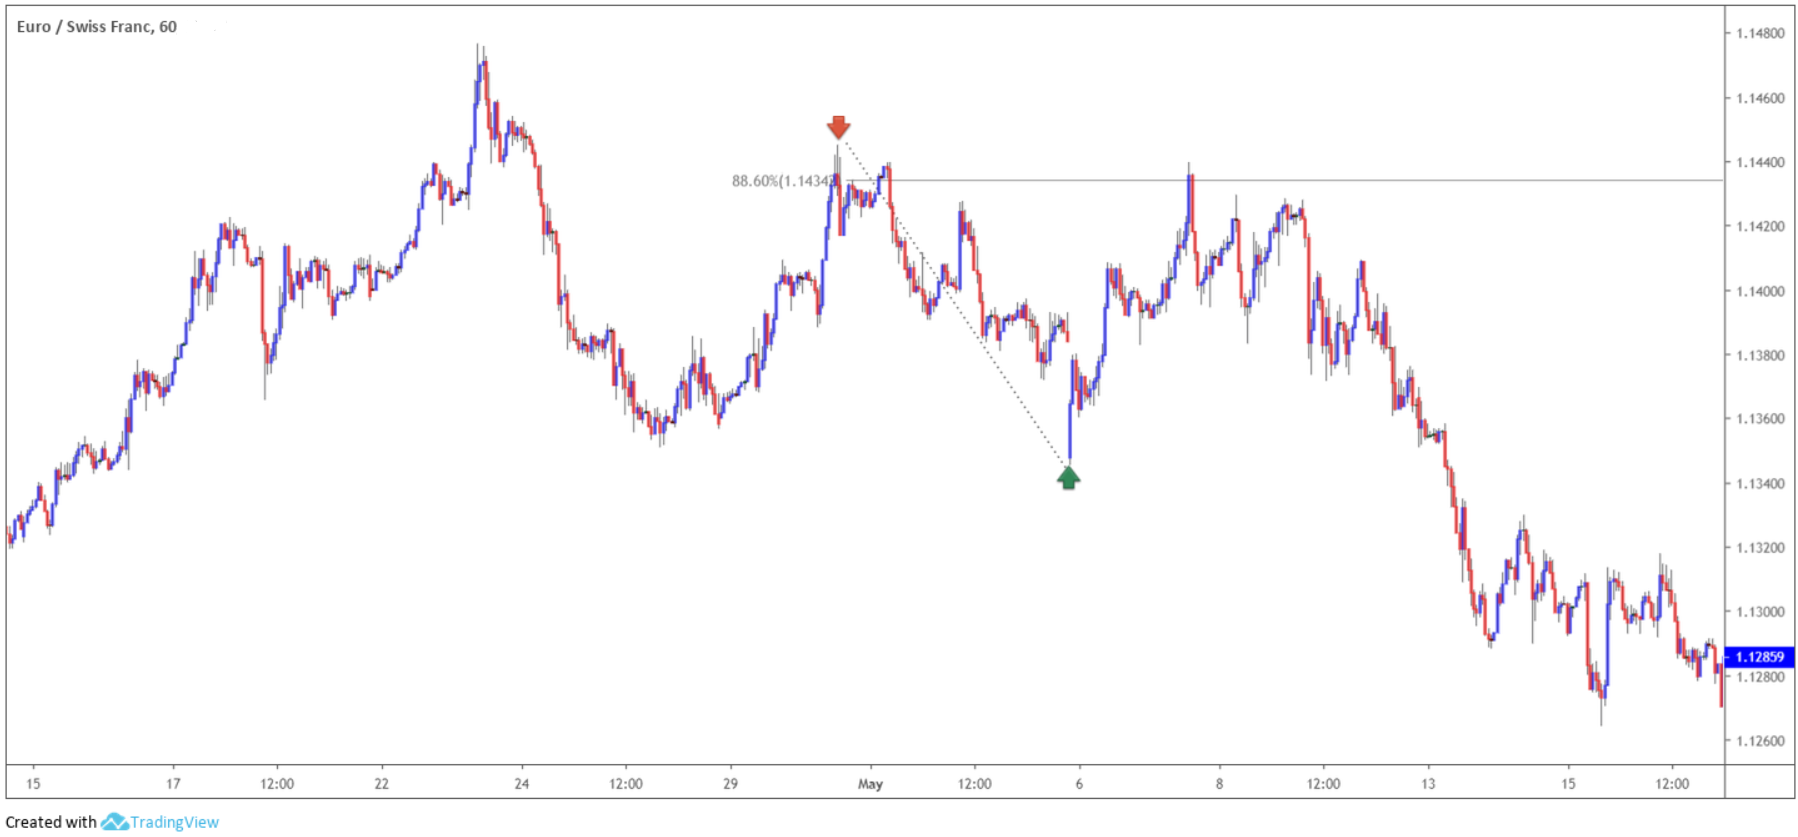
(Figure 1.1)
Figure 1.2, on the other hand, shows a buy zone (or oversold area) created using the 78.6% and 61.8% Fibonacci ratios. This is a popular combination. In this example, the swing low marked with a green arrow was selected as this was the clear low preceding the high, though some traders may opt for the extreme low further to the left. Neither is right or wrong, it is trader dependent.
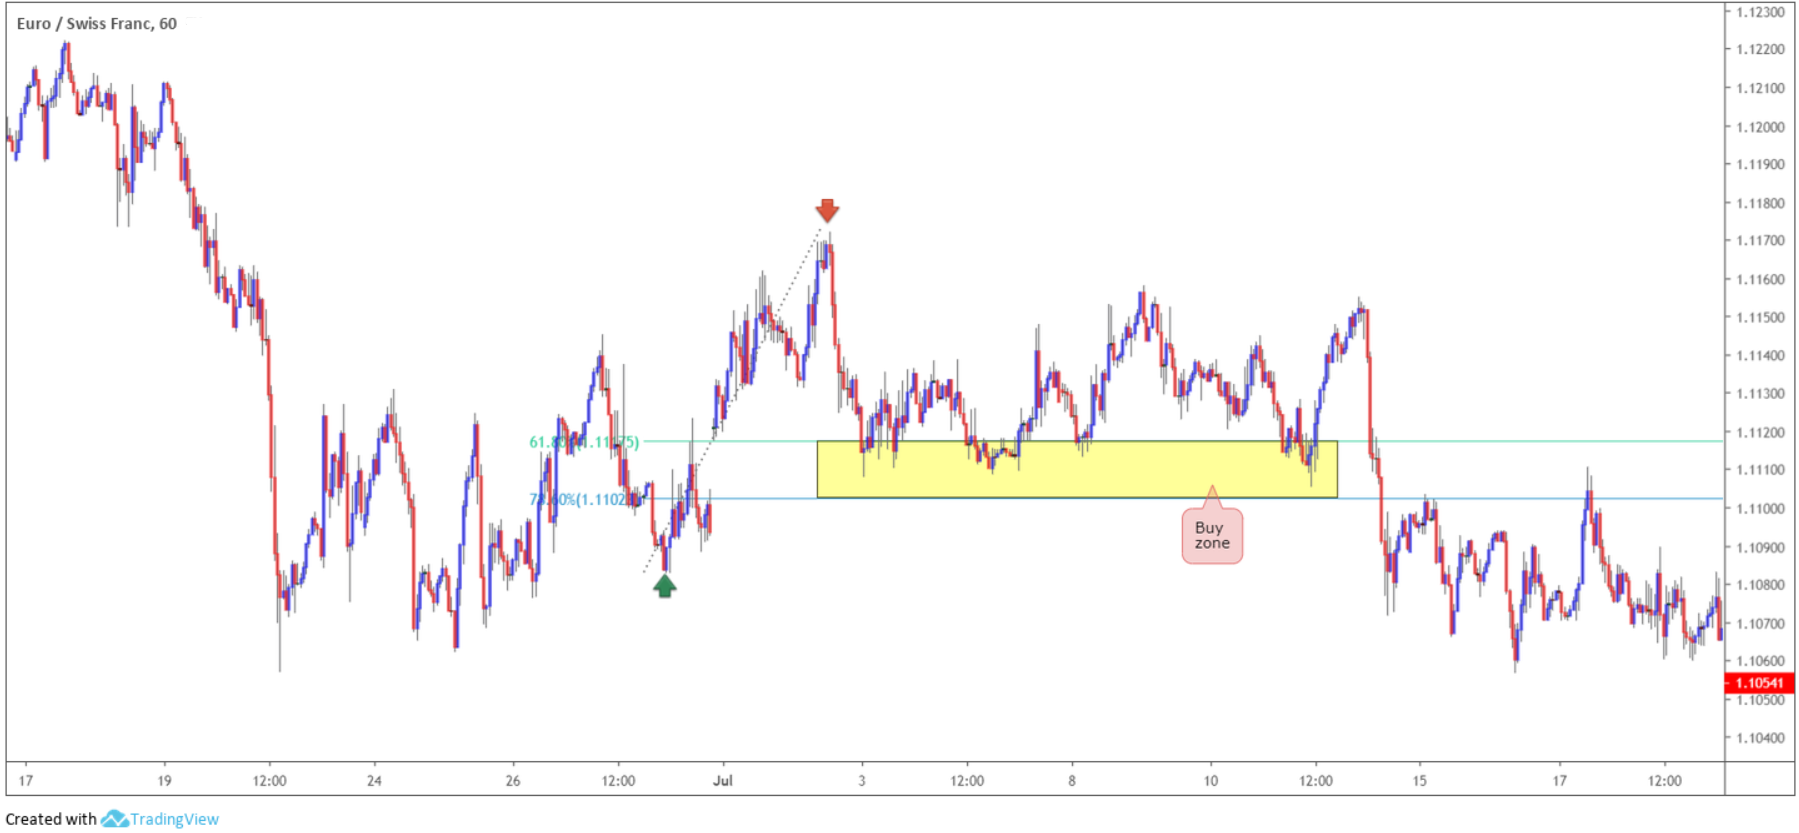
(Figure 1.2)
As highlighted above, 50.0% is not a Fibonacci ratio, though has proven useful for some traders. Often price action retraces 50% of its preceding move before continuing its original direction as shown in figure 1.3, using the clearest high that formed prior to the low (red and green arrows).
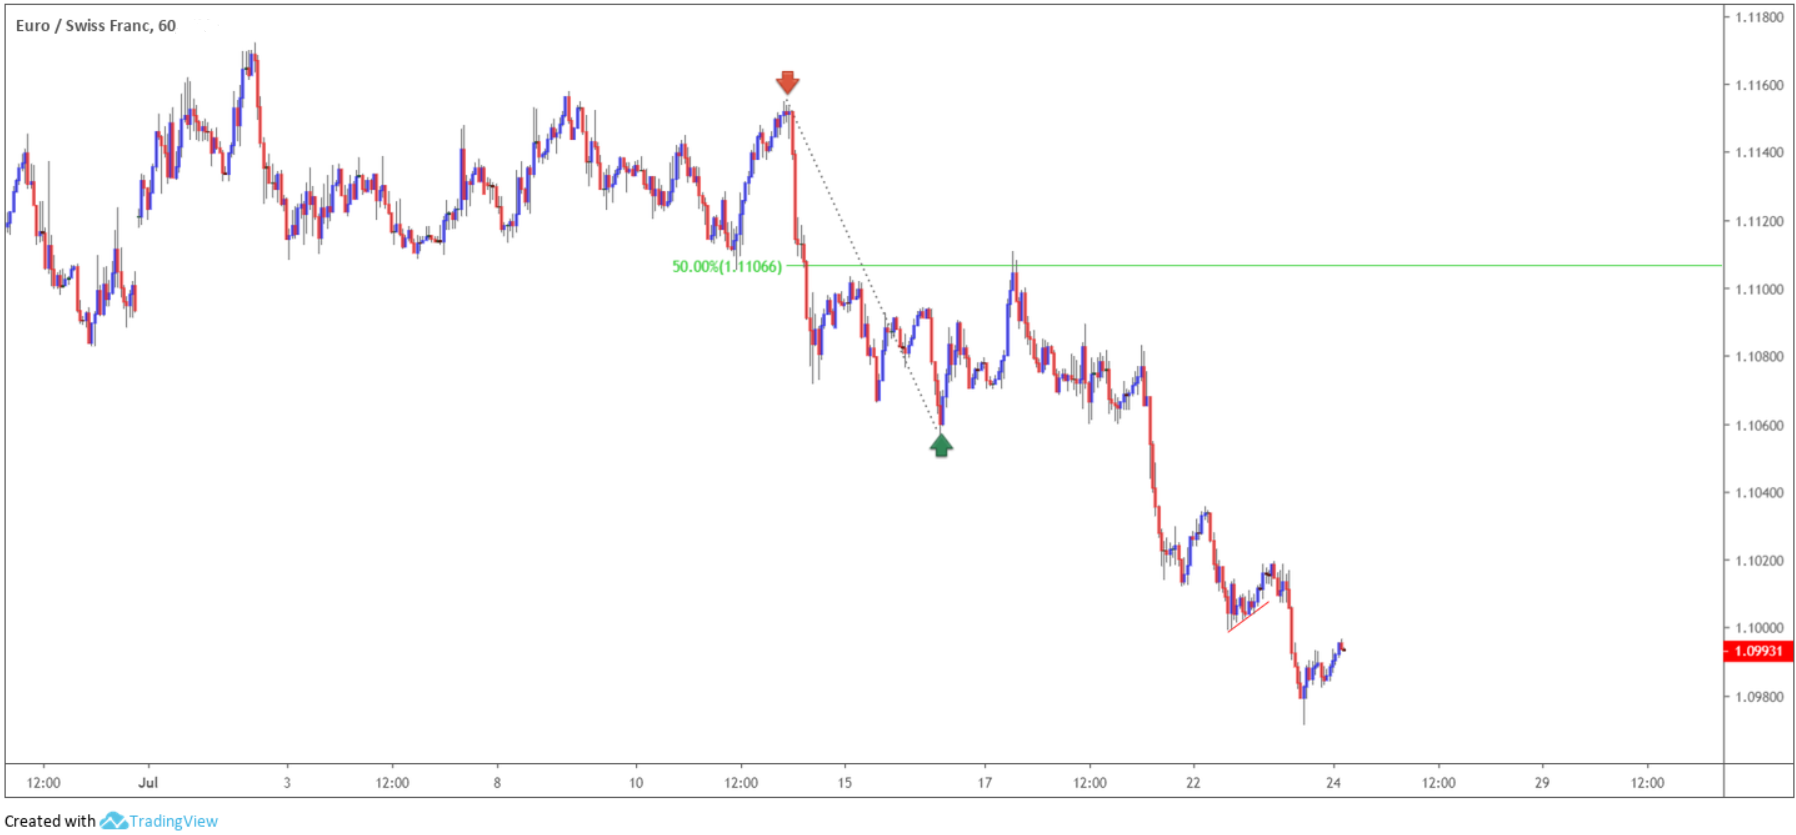
(Figure 1.3)
Fibonacci extension
Fibonacci extensions, similar to Fibonacci retracements, are based on the mathematical relationships between the numbers in the Fibonacci summation series. Unlike Fibonacci retracements, though, Fibonacci extensions pursue levels at more than 100% of the previous price movement.
Available on the majority of modern trading platforms and used on all timeframes, the Fibonacci extension tool helps determine profit targets as well as potential areas of support and resistance. Common Fibonacci extensions are: 127.2% (the square root of 1.618) and 161.8%, though 261.8% and 423.6% are also employed regularly.
Returning to the subject of the golden ratio, or golden proportion, where it was stated the exact inverse of 1.618 is 0.618, you may recall a distinguishing fact that each number is approximately 61.8% of the next number in the series. Dividing the number by the prior value, nevertheless, produces an inverse ratio. For example, dividing 13 by 8 equates to 1.625 or dividing 34 by 21 gives 1.619.
Applying Fibonacci extension levels to the charts is achieved easily using three points. The first is at the start of a move, be it a low or high. The second is the end of the said move, while the third point tends to differ between traders. Some opt to use the end of the retracement against the move, whereas others select the origin of the move. While many traders may disagree, neither is right or wrong with both approaches proving valuable.
As shown in figure 1.4, the Fibonacci extension tool finds a strong area of support using the 127.2% and 161.8% Fibonacci ratios, which not only is used as a take-profit zone, but also an area of potential support to enter long from. Notice here, the Fibonacci tool was applied using the origin of the move, as opposed to the retracement against the origin (red arrow).
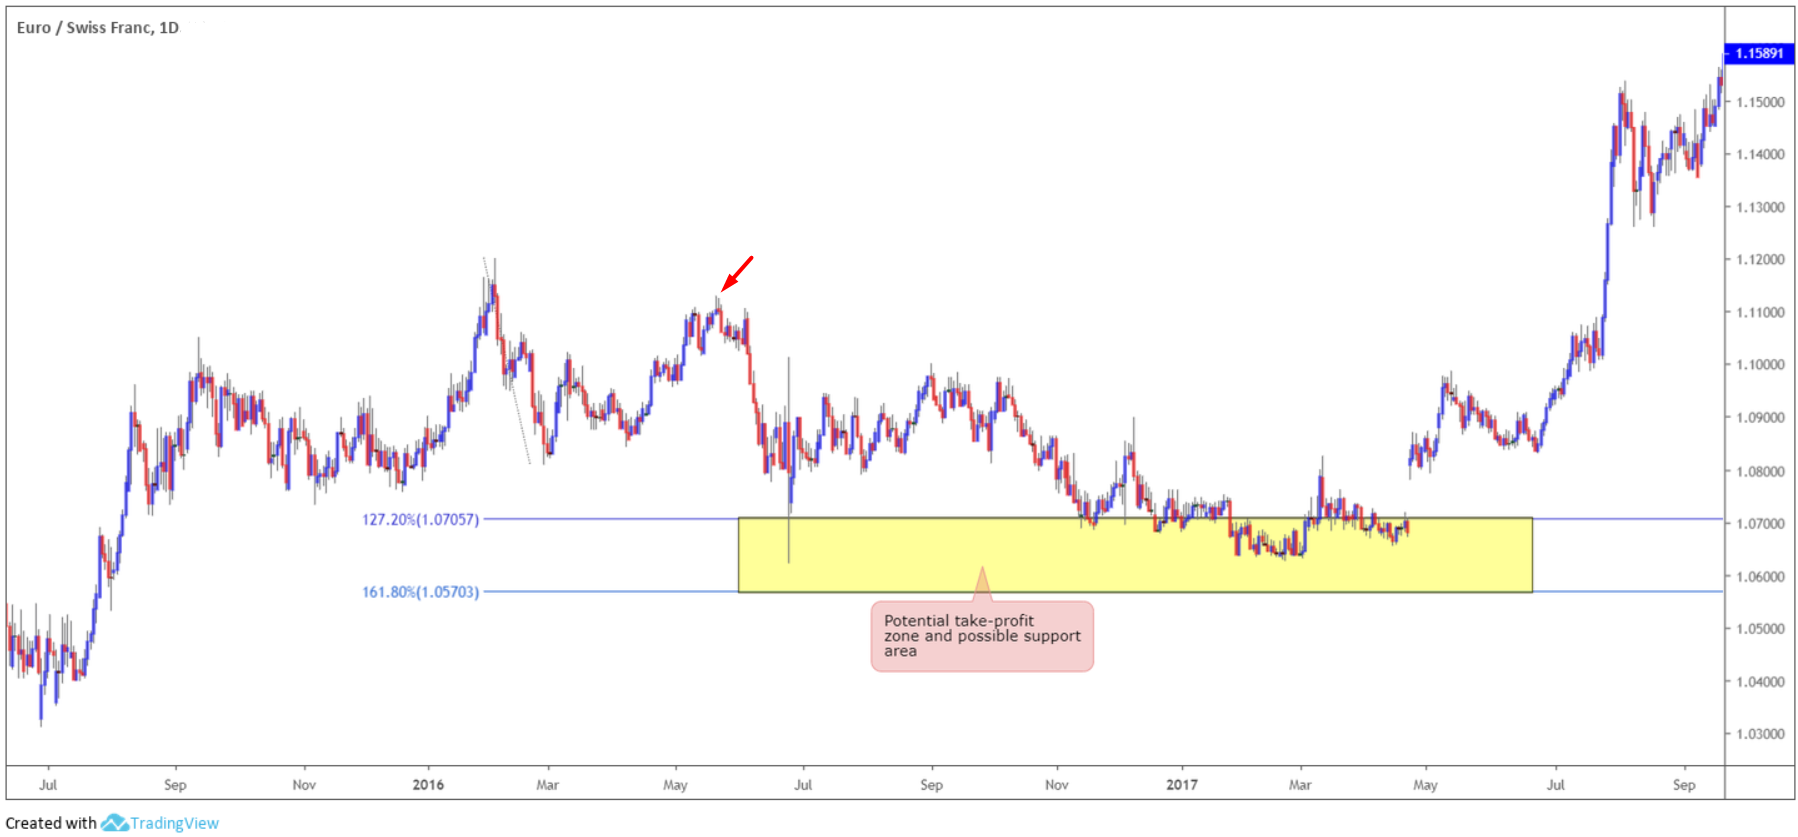
(Figure 1.4)
In the case of figure 1.5, however, the Fibonacci extension area of support using the 127.2% and 161.8% Fibonacci ratios was applied using the retracement against the origin (red arrow). Here, price found a floor of support but ultimately pierced the lower edge of the zone before driving higher. This would have left the trader, using the zone as a take-profit area, potentially liquidating the position too early, and traders using the zone as a means of entry likely suffering a loss.
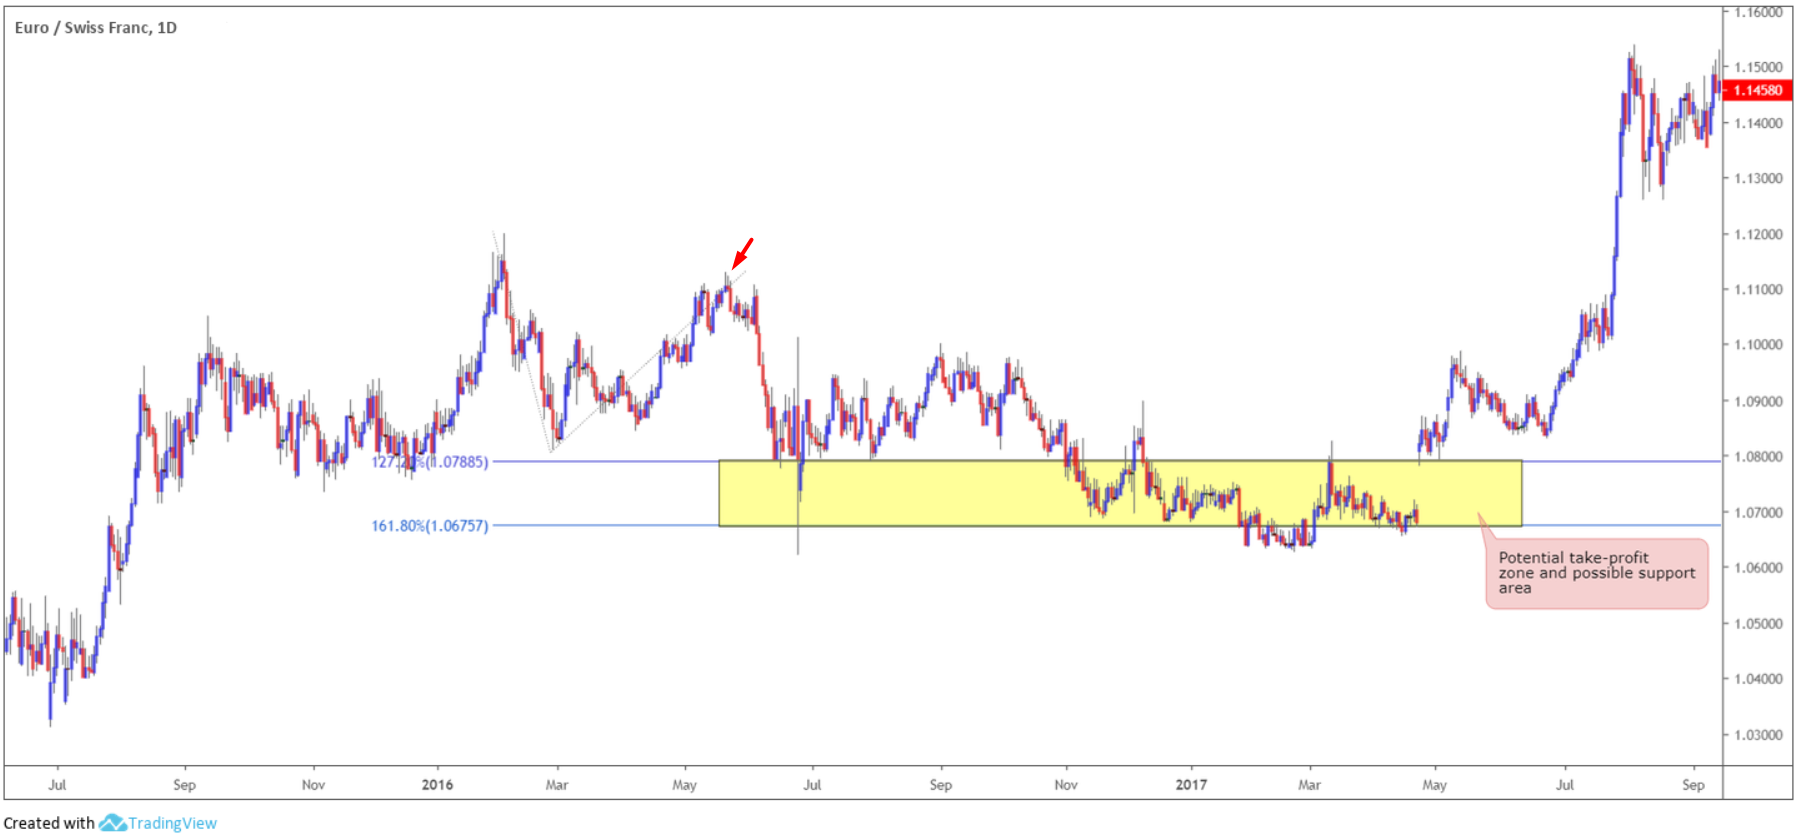
(Figure 1.5)
Fibonacci trading strategies
Using Fibonacci studies in isolation is a chancy approach. Combining the ratios alongside additional technical indicators and price action analysis certainly enhances the odds of success.
An example of notable resistance aligning with a 127.2%/161.8% Fibonacci extension point can be seen in figure 1.6. Note the corresponding Fibonacci zone (yellow) provided traders an area to enter short from in April 2018. With stop-loss orders positioned above the zone, and if you trailed the position, this long-term trade could still be running as of current price for amazingly attractive risk/reward.
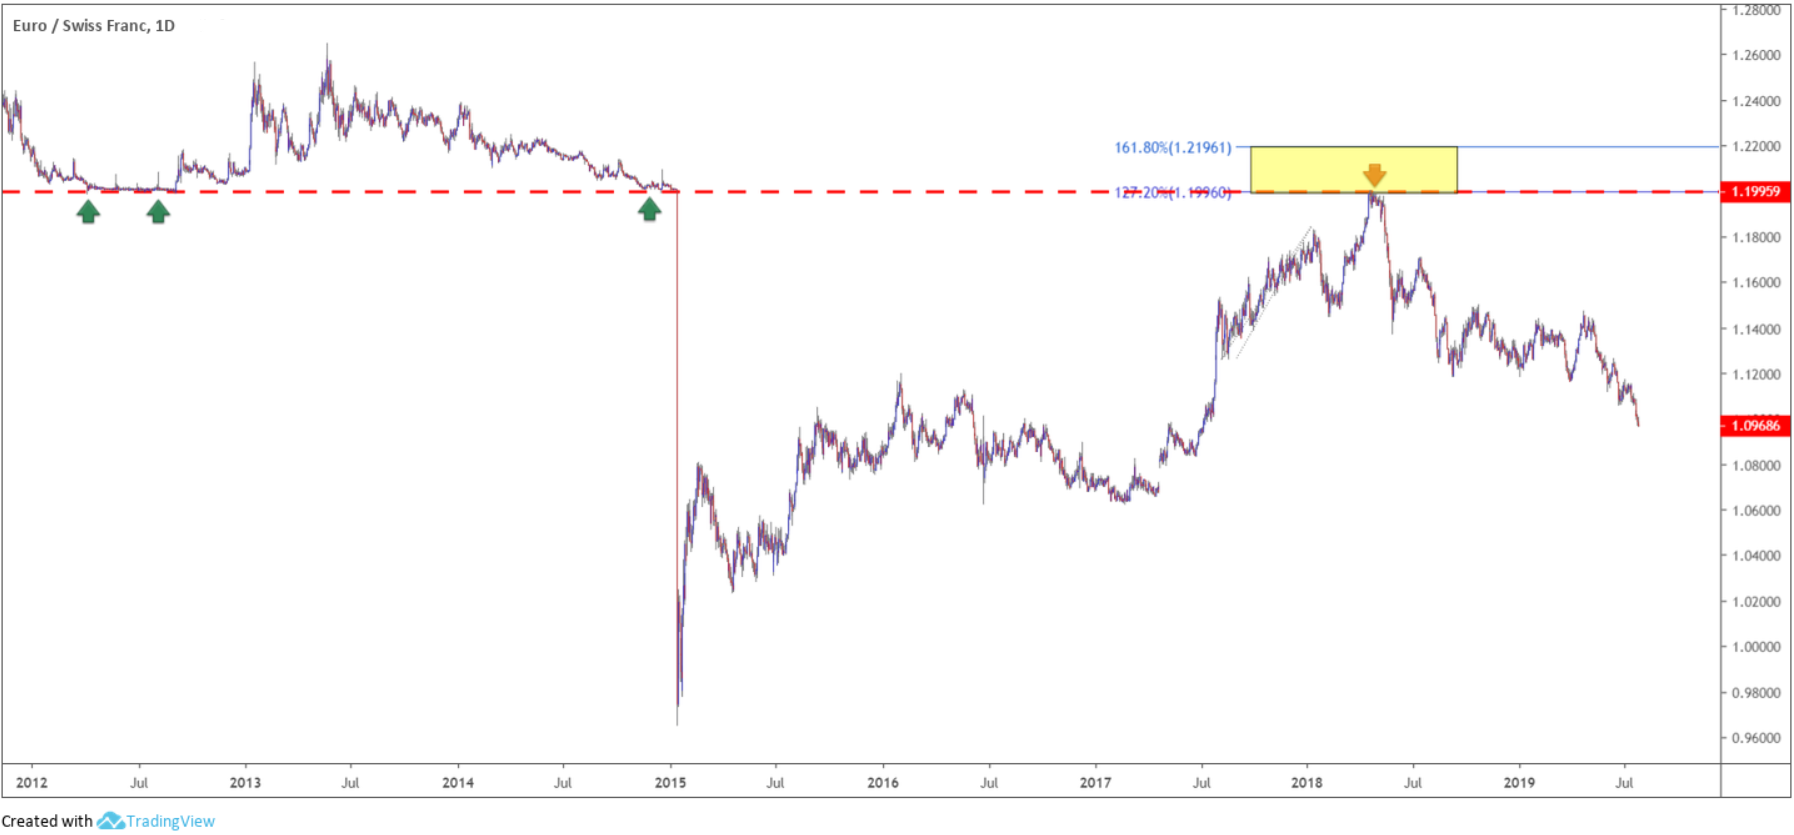
(Figure 1.6)
Traders may also want to acknowledge the said resistance area brought with it clear negative divergence within overbought territory on the Relative Strength Index (RSI) – see figure 1.7.
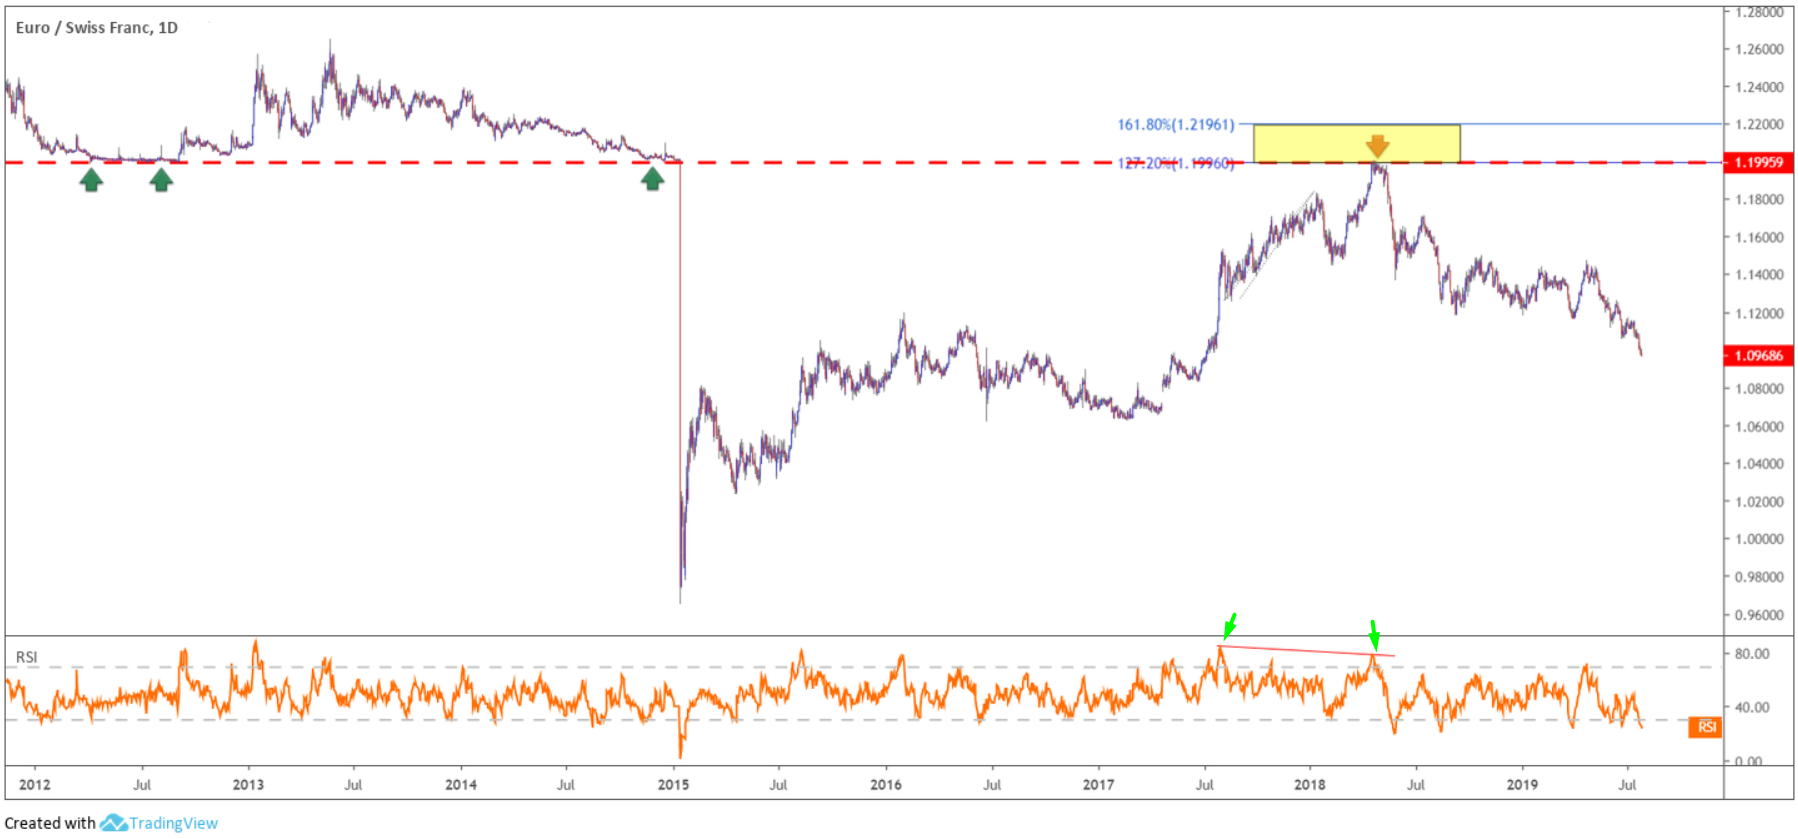
(Figure 1.7)
In addition to the above, several well-known trading strategies employ Fibonacci ratios within their construction. Harmonic patterns, for instance, uses Fibonacci extensively.
Although harmonics feature a diverse selection of chart patterns, the harmonic bat pattern is one of the more popular patterns. Developed by Scott Carney, the harmonic bat pattern is a 5-point retracement structure comprised of Fibonacci ratios used to create a potential reversal zone, or more commonly referred to as a ‘PRZ’. According to Carney, it is one of the more accurate patterns in the harmonic family, exhibiting a high success rate.
Figure 1.8 shows a harmonic bat pattern:
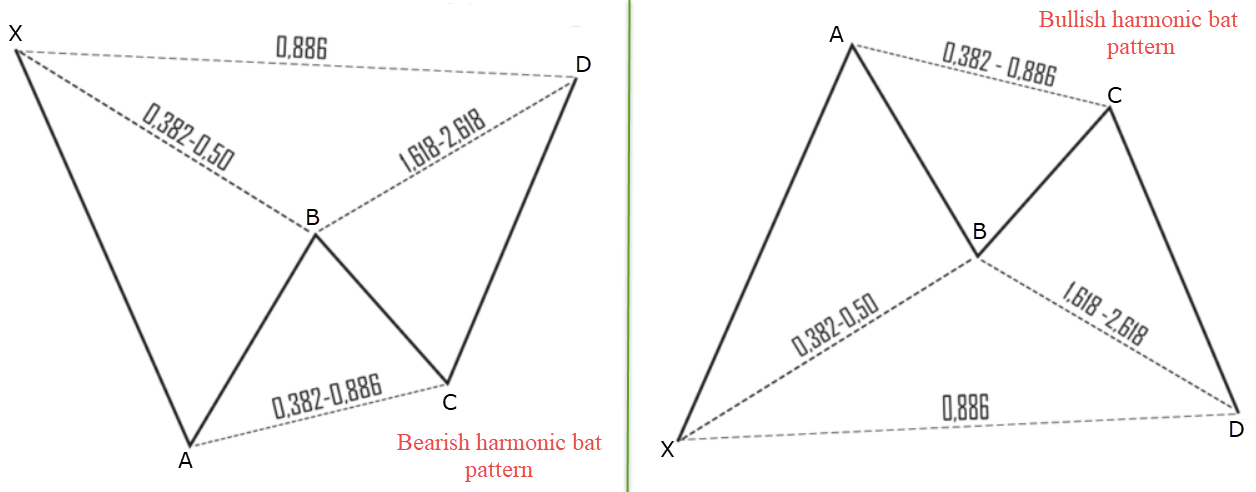
(Figure 1.8)
Elliot wave analysis also adopts key Fibonacci relationships. Like Harmonic studies, Elliot wave can become somewhat complicated, particularly for newer traders, so the following will be no more than an introduction to Fibonacci retracements within impulse waves. The basic wave principle (or pattern) involves a five-wave count and forms as market prices travel up or down. The overall pattern forms an uninterrupted configuration in that the end of one wave marks the beginning of another wave.
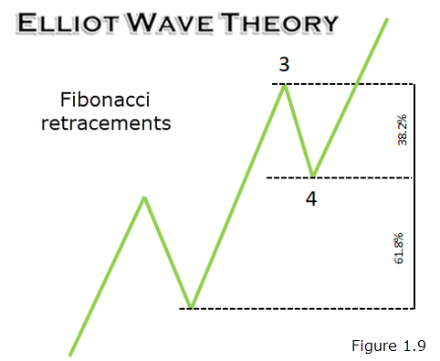
As demonstrated in figure 1.9, impulse waves have the second wave (a corrective wave) typically correct into deep territory of its preceding wave, near the 61.8% Fibonacci retracement value. Fourth waves (another corrective wave) tend to be shorter, generally correcting towards the 38.2% Fibonacci retracement value of wave 3.
Fibonacci: a powerful tool in the right hands
When combined with other indicators, Fibonacci numbers help traders identify and profit in the markets. Unless using a proven methodology that incorporates Fibonacci studies, such as Elliot wave or Harmonics, trading Fibonacci levels in isolation is often a challenge.
As demonstrated in this article, Fibonacci levels/areas perform best when merging with additional technical trading tools, be it price action analysis, an indicator-based approach, or a combination. For that reason, testing several combined strategies is probably the safer, and more profitable, route to take going forward. With that in mind, this could be a good opportunity to think about opening a demo account here at IC Markets: https://www.icmarkets.com/open-new-demo-account/. That way, you can test without financial risk and be confident when transitioning into live trading conditions.
