
EUR/USD:
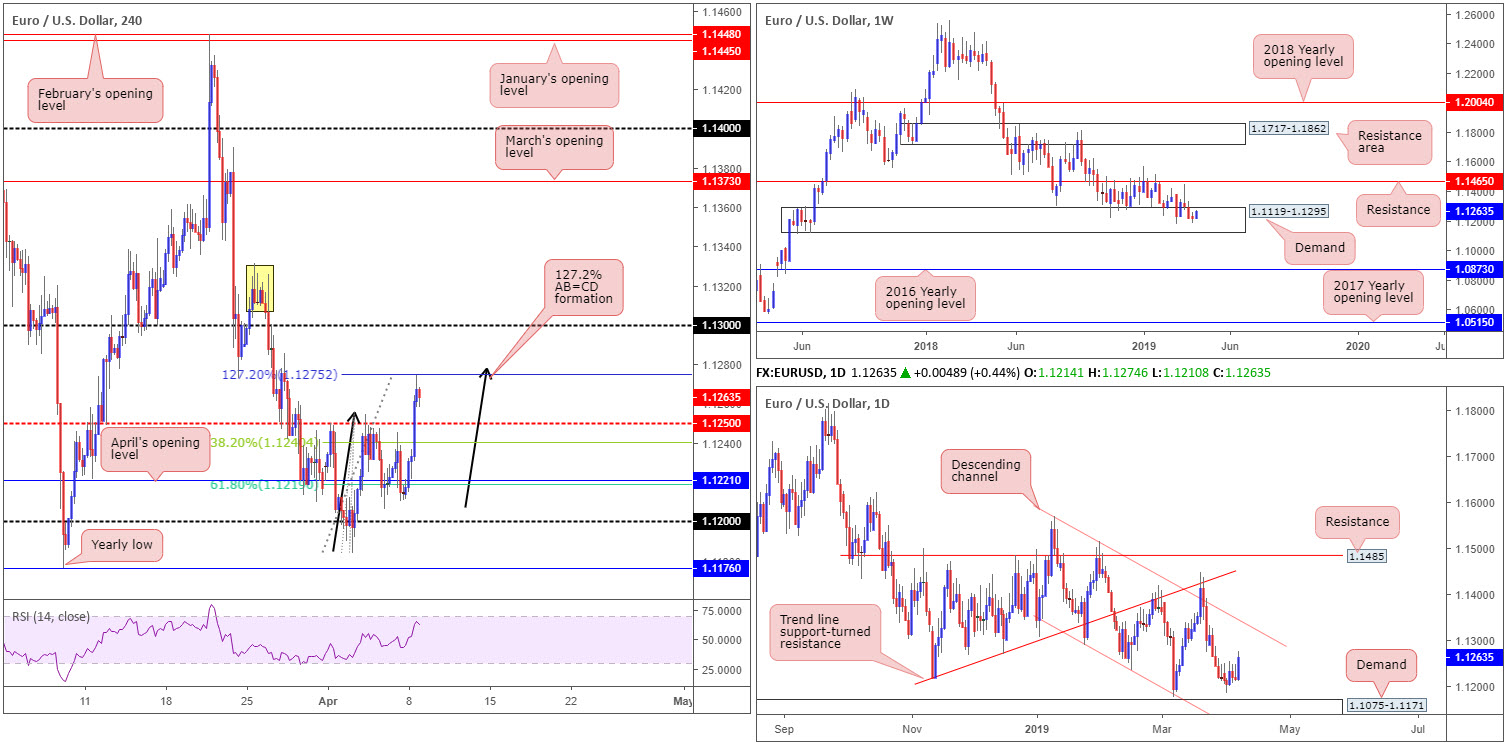
A fragile dollar (down 0.33% according to the US dollar index) increased demand for the euro Monday, consequently guiding the EUR/USD’s H4 candles beyond its 1.1250 resistance into a completed 127.2% AB=CD (black arrows) bearish pattern around 1.1275. Thus far, as you can see, sellers have maintained a reasonable defence from here, though according to widely accepted rules for take-profit targets, an AB=CD completion has the 38.2% Fibonacci support value of legs A-D at 1.1240 set as the initial target zone (the second take-profit target falls in around the 61.8% Fibonacci support at 1.1219, two points below April’s opening level at 1.1221).
On a wider perspective, weekly flow remains within the parapets of demand at 1.1119-1.1295. Since early February, the unit has struggled to gain much traction out of the zone. Overall, the long-term trend on the weekly timeframe continues to face a southerly direction, with traders’ crosshairs now likely fixed on 1.1176 as the next viable support: the 2019 yearly low. The next area of interest beyond the current demand, however, falls in around the 2016 yearly opening level priced in at 1.0873.
Leaving demand at 1.1075-1.1171 (an area glued to the underside of the current weekly demand) unchallenged on the daily timeframe, yesterday’s daily candle was certainly full of vigour. Continued buying from this point has channel resistance (taken from the high 1.1569) to target.
Areas of consideration:
As pretty as the current H4 AB=CD bearish formation is, the lack of higher-timeframe resistance decreases the chances of a successful trade, and could lead to a move being seen towards the 1.13 handle. In the event a H4 bearish candlestick signal is seen at current price, nonetheless, a short-term sell may still be considered, targeting the corresponding 38.2% Fibonacci support at 1.1240.
In terms of long opportunities, traders are urged to tread carefully, despite coming from weekly demand. Above 1.13 – a likely area traders have their eyes on for breakout setups – H4 supply at 1.1331/1.1310 (yellow) is visible, which happens to coincide with the aforementioned daily channel resistance.
Today’s data points: Limited.
GBP/USD:
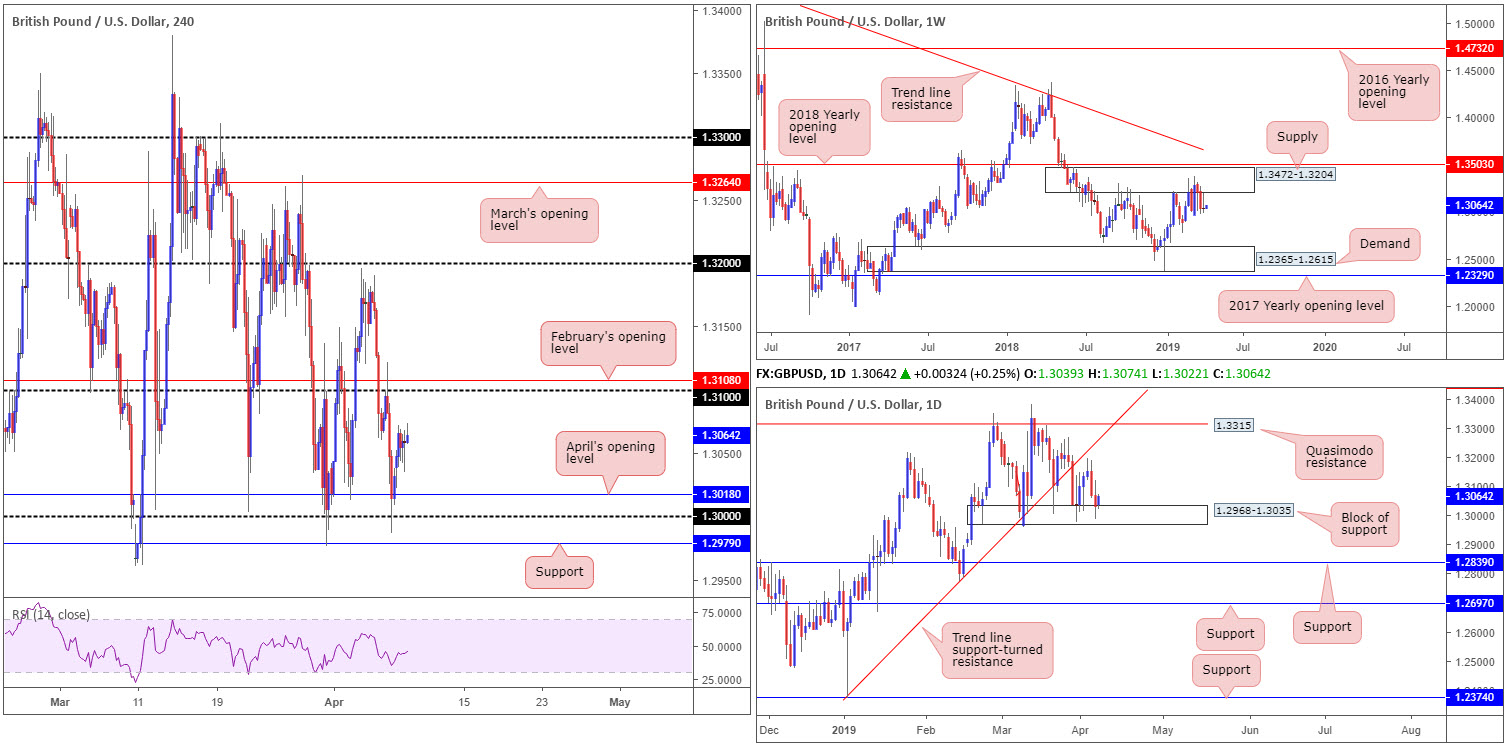
Despite UK PM May hitting the airwaves on Sunday defending her strategy to reach out to opposition Labour, GBP/USD movement hesitated Monday, oscillating between 1.3121/1.2986.
With limited macroeconomic drivers scheduled on the docket today, and recent price action airing a somewhat lacklustre vibe, much of the following piece will echo thoughts put forward in Monday’s report.
From the weekly timeframe, supply falls in around 1.3472-1.3204. Since the end of February this area has been home to many traders as price flips between gains/losses. According to structure, recent selling should not have come as a surprise, with the next obvious downside target not realised on this timeframe until demand coming in at 1.2365-1.2615. The flip side to this, daily action remains teasing a block of support at 1.2968-1.3035. Buying from here is likely to find resistance around trend line support-turned resistance (extended from the low 1.2373), closely followed by a Quasimodo resistance plotted at 1.3315.
A closer analysis of price action on the H4 timeframe has the candles fluctuating between two psychological numbers: 1.31 (shadowed closely by February’s opening level at 1.3108) and key figure 1.30 (pinned closely to support coming in at 1.2979). Note in between the range we also have April’s opening level drawn from 1.3018 to take into account.
Areas of consideration:
Traders interested in entering long from the 1.30 region this week, according to our technical studies, bring with them a clear block of daily support at 1.2968-1.3035 backing up the trade. Though this is likely to encourage buyers, the main concern remains on the weekly timeframe: supply at 1.3472-1.3204. This area is proving a troublesome beast to overcome and, therefore, could weigh on any longs this week. Aggressive traders may already be long from 1.30. If so, expect potential selling to emerge from 1.31 if we overcome 1.3060ish (a H4 resistance number noted in Monday’s report to be aware of).
In the event weekly selling pressures the market lower and the H4 candles overthrow 1.30 and nearby support at 1.2979, nevertheless, the next area of interest can be seen around demand (not seen on the screen) pencilled in at 1.2891-1.2926 (also holds the 1.29 handle within its walls).
Today’s data points: Limited.
AUD/USD:
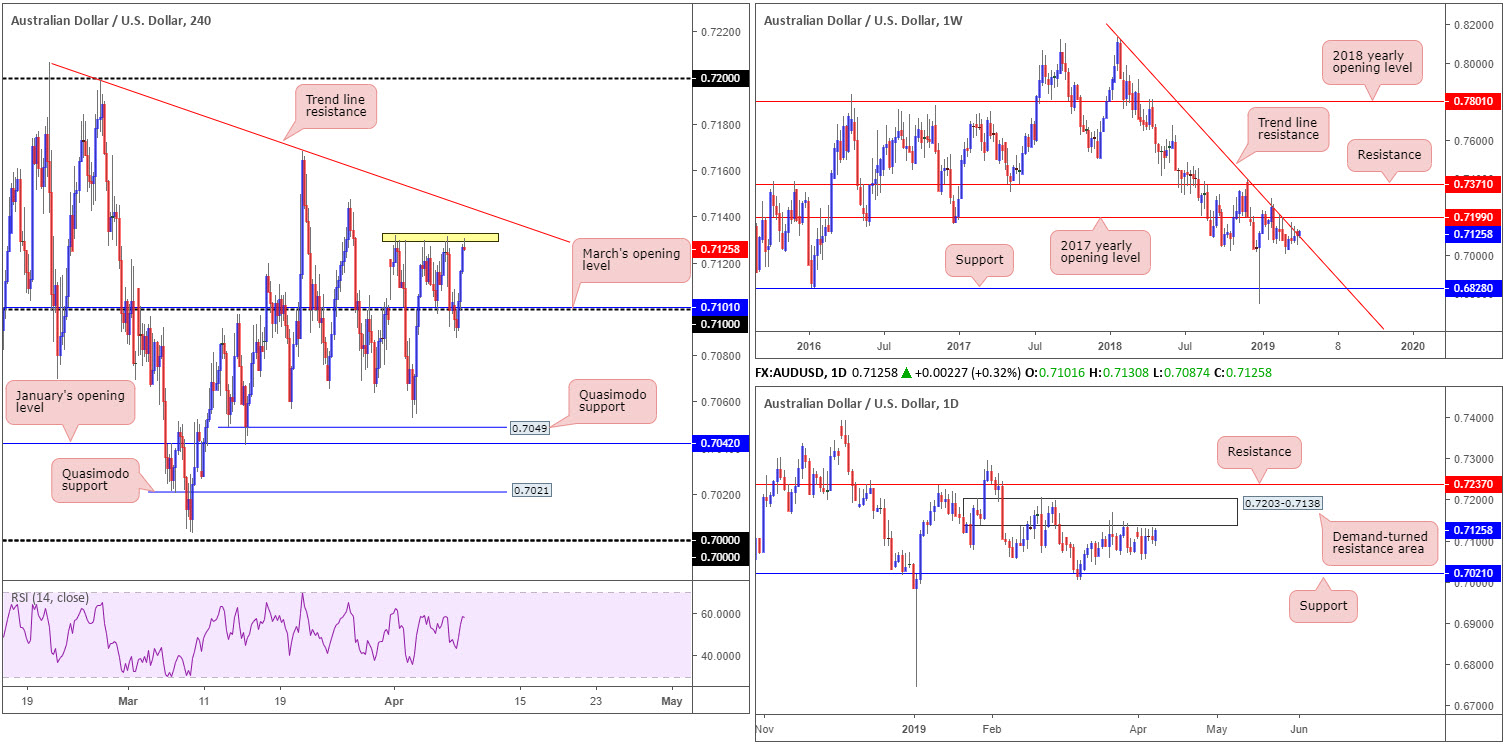
The AUD/USD, despite briefly sweeping beneath its 0.71 handle in early trade Monday, explored higher ground. The primary driver behind the move is largely due to a waning US dollar across the board. Temporary resistance at around 0.7130 – a collection of short-term topping points – on the H4 timeframe (yellow) is, as you can see, in motion at the time of writing. This level, along with a nearby trend line resistance (extended from the high 0.7206), are likely to be problematic zones due to where we’re trading from on the bigger picture.
The weekly candles remain kissing the underside of a long-standing trend line resistance (etched from the high 0.8135). The market could eventually observe additional selling take shape from here as downside appears reasonably free until connecting with support coming in at 0.6828.
Following a modest rebound off support at 0.7021 early March, daily action, since March 20, has been clinging to the underside of a demand-turned resistance area at 0.7203-0.7138. A push higher from here may land the unit at resistance drawn from 0.7237.
Areas of consideration:
A sell from the H4 trend line resistance (drawn from the high 0.7206) is of interest today, in view of its connection with the aforementioned weekly trend line resistance and also the daily demand-turned resistance area.
Conservative traders will likely want to see the H4 candles chalk up a bearish candlestick formation (entry and risk parameters can then be defined according to this structure) before pulling the trigger, as trend lines, like round numbers, are prone to fakeouts. The initial take-profit target falls in around 0.71.
Today’s data points: Limited.
USD/CAD:
Robust oil prices and a lower US dollar across the board drove the USD/CAD pair southbound Monday, losing more than 0.50%.
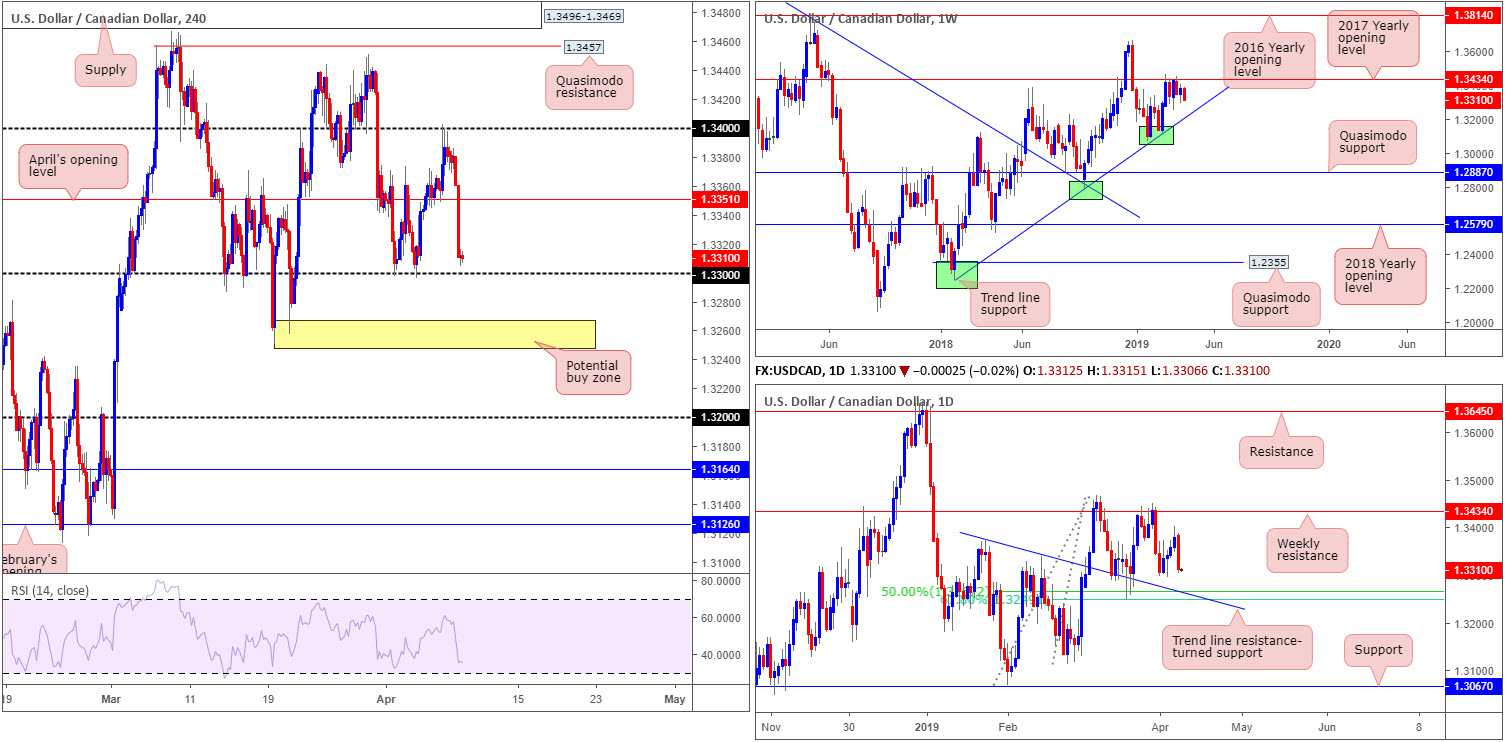
Following Friday’s rejection off 1.34 on the H4 timeframe, Monday witnessed the candles overthrow April’s opening level plotted at 1.3351 and bottom a few points north of the 1.33 handle. Note this psychological boundary held price action higher on two occasions last week, once on Monday and again on Wednesday. Below 1.33, however, we have the 1.3250 March 19 low as the next viable support, followed by the 1.32 base.
In recent weeks, the USD/CAD engaged with notable resistance at 1.3434 (the 2017 yearly opening level) on the weekly timeframe following a dominant push higher from a meaty trend line support (taken from the low 1.2247). Should we continue to push lower this week, there’s a strong chance we’ll be seeing the said trend line support re-enter the fold.
Daily flow, on the other hand, found a ‘floor’ ahead of a 50.0% support at 1.3267 last week. Note this barrier happens to merge closely with a 61.8% Fibonacci support at 1.3248 and a trend line resistance-turned support (extended from the high 1.3375). In view of yesterday’s strong push lower, the noted daily supports are certainly areas to have on the watchlists this week.
Areas of consideration:
Daily traders likely have eyeballs on 1.3248/1.3267 today as possible support. A test of this potentially implies a stop run beneath 1.33 on the H4 timeframe and a likely test of the 1.3250 March 19 low. On account of this, the yellow zone on the H4 timeframe at 1.3248/1.3267, which not only incorporates the daily support, but also the H4 said low 1.3250, is a reasonably high-probability buy zone today. The only grumble, of course, is weekly price shows room to push beneath this area to bring in the aforementioned weekly trend line support.
Today’s data points: Limited.
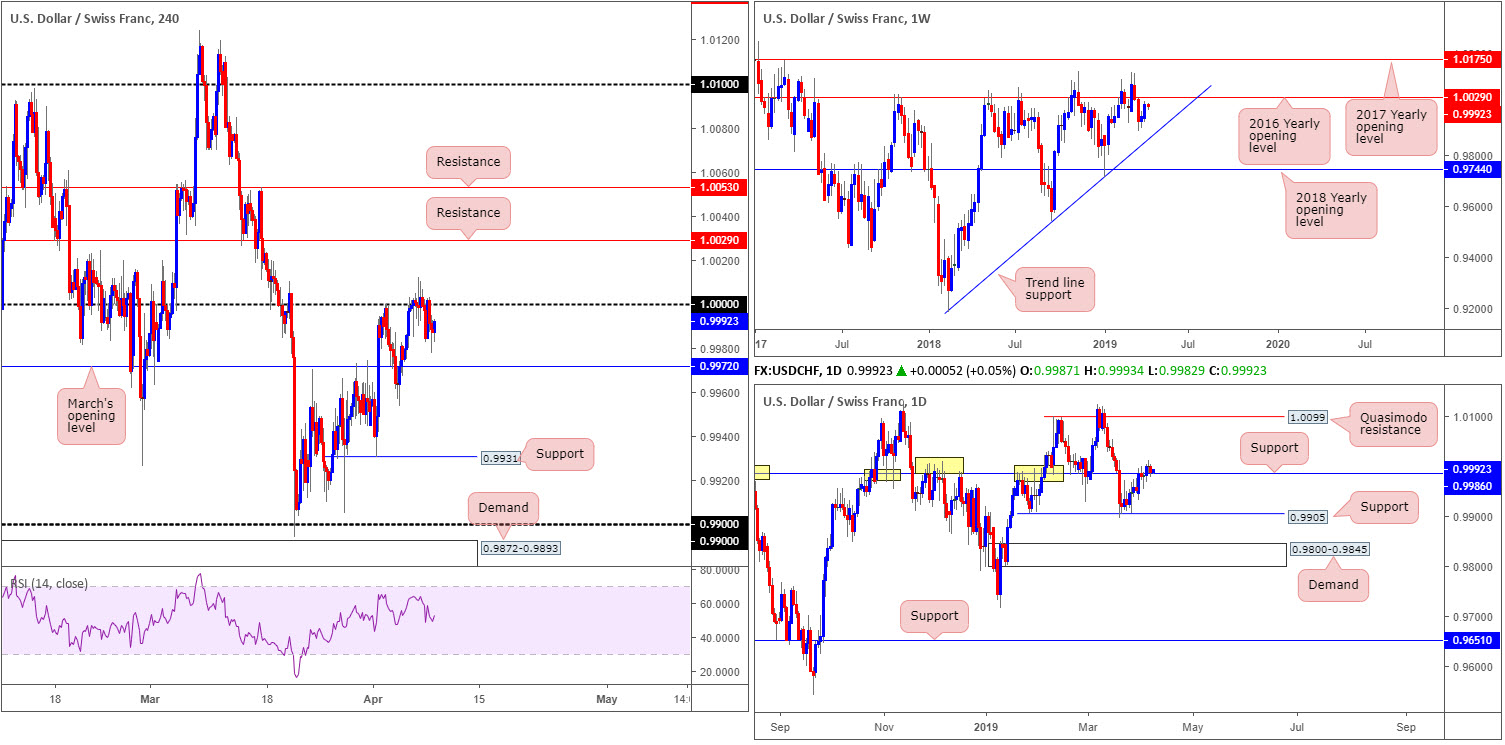
USD/CHF:
Key figure 1.0000 (parity) applied to the H4 timeframe, as you can see, served reasonably well as resistance Monday. Likely weighed on by the US dollar index revisiting its 97.00 mark, the pair tested lows of 0.9977, a few points ahead of March’s opening level at 0.9972.
In the event we push for higher ground today/early week, two layers of resistance are visible on the H4 timeframe at 1.0053 and 1.0029. Traders may want to acknowledge the lower of the two levels also represents the 2016 yearly opening level on the weekly timeframe.
The story on the daily timeframe, thanks to recent buying, witnessed the candles overthrow notable resistance at 0.9986 (now acting support). Note this support and resistance level boasts strong historical significance dating as far back as November 2017. Should the buyers continue bidding this market higher from here, the next area of resistance in sight falls in around a Quasimodo resistance base at 1.0099.
Areas of consideration:
Should the pair eventually conquer 1.0000 to the upside, short-term buying opportunities may emerge, targeting 1.0029 as an initial upside target. Traders considering this move are urged to ensure risk/reward conditions are favourable before pulling the trigger, as the likelihood of selling materialising from 1.0029 this week is reasonably strong, despite daily flows showing room to press higher.
Today’s data points: Limited.
The accuracy, completeness and timeliness of the information contained on this site cannot be guaranteed. IC Markets does not warranty, guarantee or make any representations, or assume any liability with regard to financial results based on the use of the information in the site.
News, views, opinions, recommendations and other information obtained from sources outside of www.icmarkets.com.au, used in this site are believed to be reliable, but we cannot guarantee their accuracy or completeness. All such information is subject to change at any time without notice. IC Markets assumes no responsibility for the content of any linked site. The fact that such links may exist does not indicate approval or endorsement of any material contained on any linked site.
IC Markets is not liable for any harm caused by the transmission, through accessing the services or information on this site, of a computer virus, or other computer code or programming device that might be used to access, delete, damage, disable, disrupt or otherwise impede in any manner, the operation of the site or of any user’s software, hardware, data or property.


