
Key risk events today:
Australia NAB Business Confidence.
(Previous analysis as well as outside sources – italics).
EUR/USD:
In light of holiday-induced volatility, the euro concluded a shade lower against the US dollar on Monday.
From the weekly timeframe, little change has been seen, therefore here’s a reminder of Monday’s technical briefing (italics).
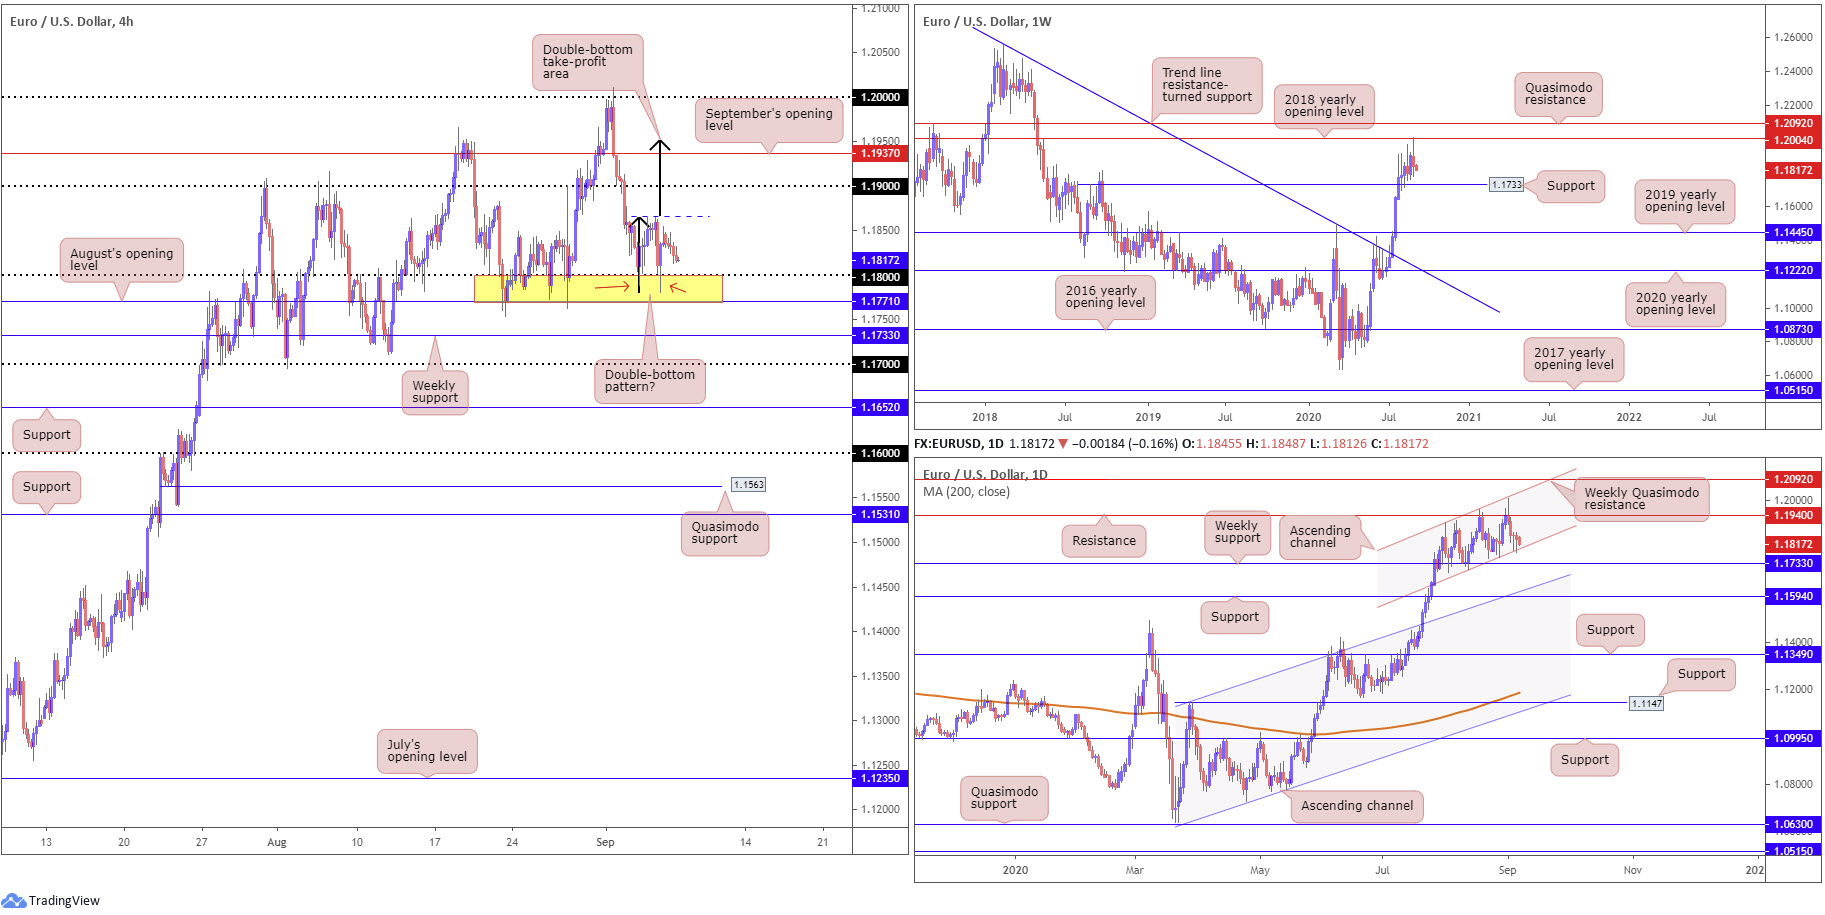
Last week welcomed the 2018 yearly opening level at 1.2004 into the fray as the pair refreshed YTD peaks at 1.2011. Support from here is not expected to enter play until 1.1733, a prior Quasimodo resistance level. Occupying 1.2004 this week, nevertheless, shines the spotlight on Quasimodo resistance at 1.2092. Traders will also acknowledge price has traded with a strong upside bias since March, a move that absorbed a reasonably notable trend line resistance, taken from the high 1.2555.
Also taken from Monday’s technical briefing is the daily timeframe’s position (italics):
Since kicking off the month of August, daily candles have been compressing within an ascending channel formation between 1.1909/1.1711. This – coupled with the inability to close above resistance at 1.1940 as well as the recent test of weekly resistance at 1.2004 – suggests buyers are perhaps losing steam and could eventually penetrate the noted channel formation.
Based on the H4 timeframe, the week wrapped up nursing losses off a familiar support area made up between August’s opening level at 1.1771 and the 1.18 handle (yellow). Some traders will also view the recent lows around 1.1786 as a double-bottom pattern (red arrows), with a neckline stationed around 1.1865. Traders with a focus on multi-timeframe analysis will also acknowledge the aforementioned support area joins together with channel support on the daily timeframe.
Further gains will likely pull in the 1.19 barrier, followed by September’s opening level at 1.1937, while brushing aside 1.1771/1.18 has weekly support to contend with at 1.1733.
Areas of consideration:
Although the possibility of reaching for 1.1733 support on the weekly timeframe is present, the H4 double-bottom pattern drawn from within the H4 support area at 1.1771/1.18 is, despite Monday’s mild pullback, still likely to interest buyers.
Gleaning additional impetus from channel support on the daily timeframe, a break of the H4 double-bottom pattern neckline at 1.1865 could be in the offing, a move that may persuade buyers to take action and target the 1.1950ish region. Not only does the 1.1950 area hold the double-bottom take-profit zone (black arrows), September’s opening level at 1.1937 on the H4 is also seen close by, together with daily resistance priced in at 1.1940.
GBP/USD:
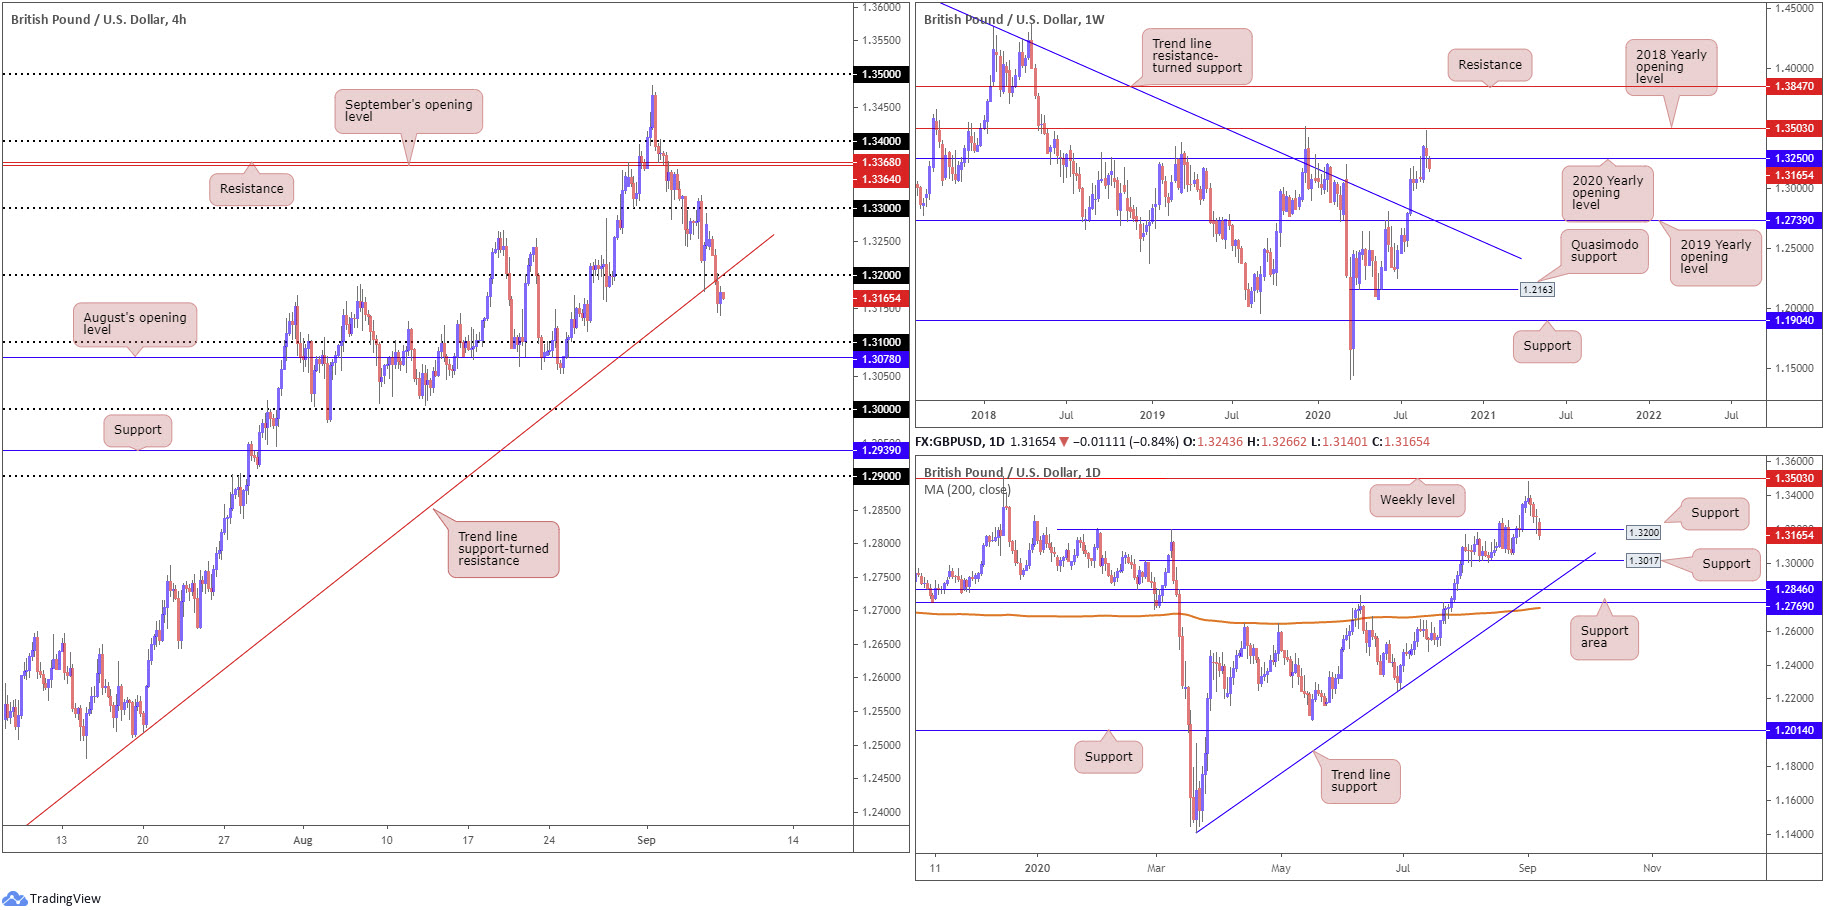
Pound sterling lost grip against the buck on Monday amid mounting concerns surrounding a no-deal Brexit. Following Friday’s impressive recovery off H4 trend line support, extended from the low 1.2257 (and 1.32 support), moves that scratched levels just ahead of 1.33, Monday reclaimed the aforementioned barriers and clocked a low at 1.3140. This moves 1.31 in view as the next possible support, closely shadowed by August’s opening level at 1.3078.
Further afield, we are, thanks to yesterday’s descent, also seeing higher timeframe action exploring waters under weekly support at 1.3250, the 2020 yearly opening level. Dropping to deeper water this week could see the beginning of a decline towards the 2019 yearly opening value at 1.2739 on the weekly timeframe, merging closely with trend line resistance-turned support, extended from the high 1.5930. Yet, on the daily timeframe, support can be found at 1.3017, a prior Quasimodo resistance level, which happens to also align closely with trend line support, taken from the low 1.1409.
Areas of consideration:
With weekly support at 1.3250 recently allowing price through, traders are possibly eyeing an extension lower today/mid-week. On account of this, a retest at 1.32/trend line support-turned resistance on the H4 may come to fruition, a setup that could appeal to sellers, targeting at least the 1.31ish region.
AUD/USD:
Holiday-thinned trading witnessed AUD/USD pencil in a meaningless range between 0.7298/0.7270 on Monday.
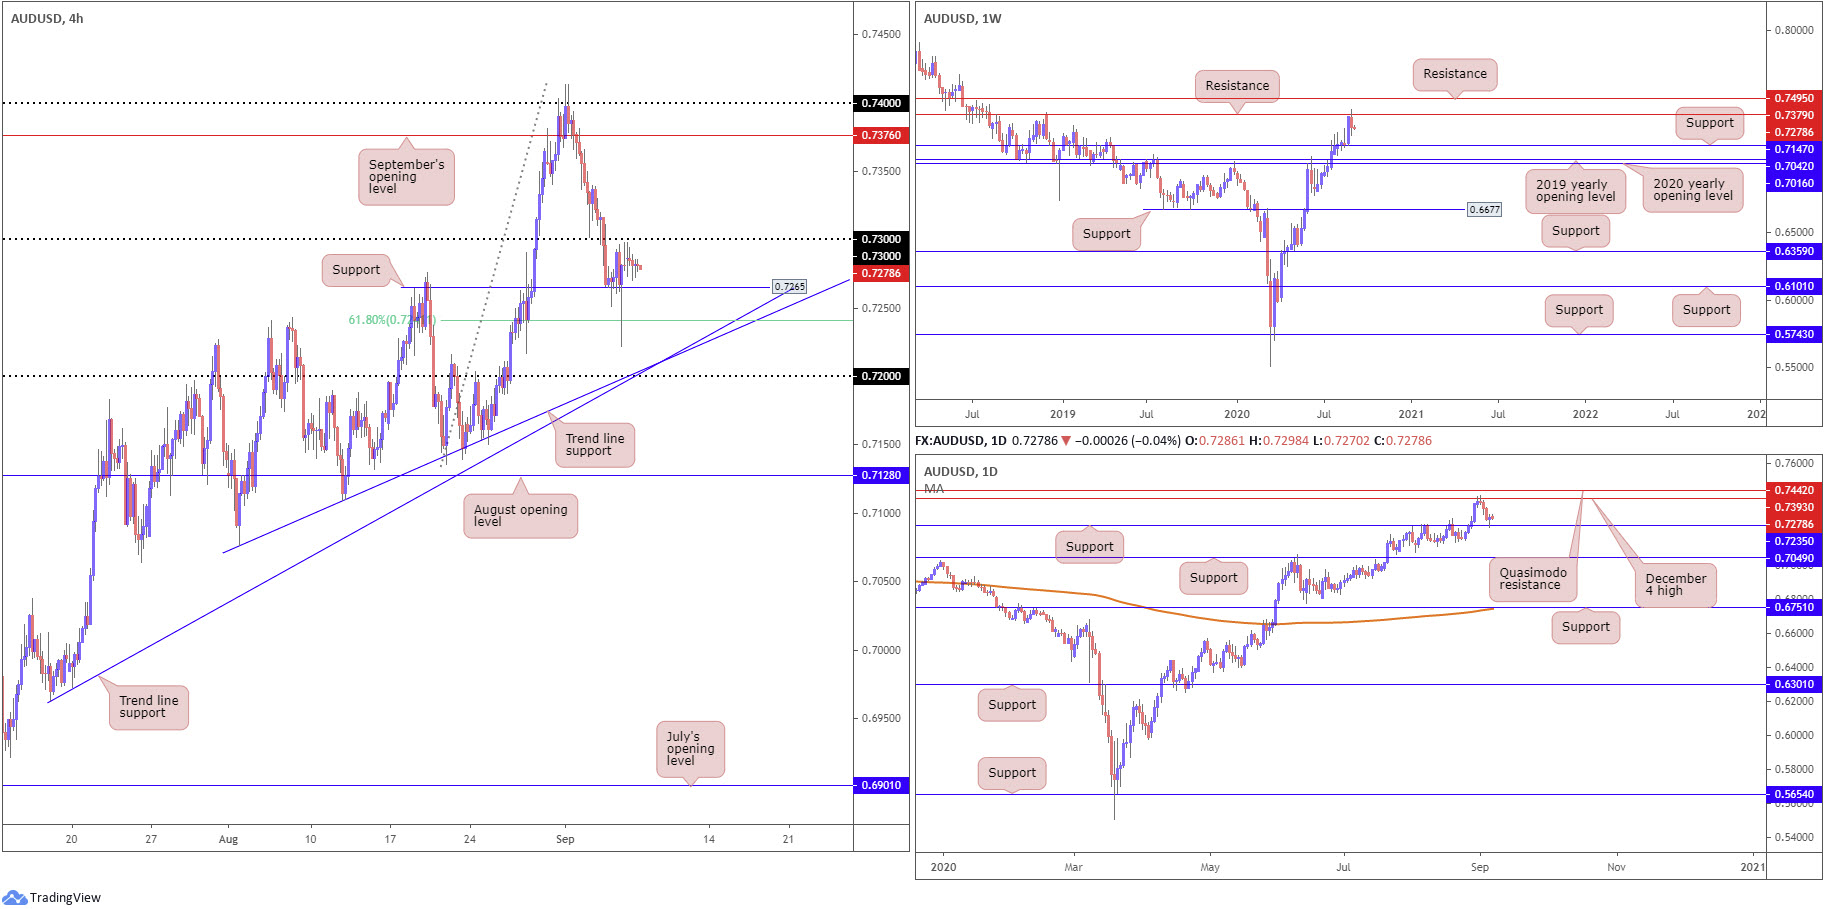
H4 support drawn from 0.7265 (prior Quasimodo resistance), despite Friday’s energetic spike to 0.7235 support on the daily timeframe (which also took on nearby 61.8% Fibonacci retracement at 0.7241 on the H4), remains in form. Above 0.73 on the H4, technical action displays limited resistance until reaching September’s opening level at 0.7376, whereas dropping to lower terrain could approach two trend line supports (0.7076/0.6963), followed by 0.72.
From the weekly timeframe, following an animated near-full-bodied push from support at 0.7147, longer-term activity recently crossed swords with resistance at 0.7379 and clocked fresh yearly highs at 0.7413. Given we only printed a moderate reaction from the aforementioned resistance, alongside the market trending northbound since early 2020, it’s difficult to determine whether sellers will strengthen their grip and attempt to retest the aforementioned support. Should buyers regain consciousness, 0.7495 echoes possible resistance.
A closer reading on the daily timeframe shows the response from the 0.7393 December 4 high (a level linking up closely with weekly resistance) had price work its way towards support coming in at 0.7235 on Friday. Should sellers take on lower levels from here, weekly support mentioned above at 0.7147, followed by a possible push for daily support located at 0.7049, could be seen.
Areas of consideration:
Absorbing selling interest around 0.73 would not only help confirm the current trend, it’d also signal bullish intent off daily support at 0.7235 and possibly set the stage for further buying to September’s opening value at 0.7376 on the H4. Note this level is shadowed by weekly resistance highlighted above at 0.7379 and daily resistance (Dec 4 high) at 0.7393.
In terms of bearish strategies, it’s unlikely we’ll see much calling for shorts until conquering 0.72, consequently clearing the rubble for an approach to weekly support at 0.7147, and August’s opening level at 0.7128.
USD/JPY:
USD/JPY movement exhibited a subdued state Monday amid holiday-induced trading conditions. As a result of the recent lacklustre performance, much of the following analysis will echo similar thoughts put forward in Monday’s technical briefing (italics).
Weekly timeframe:
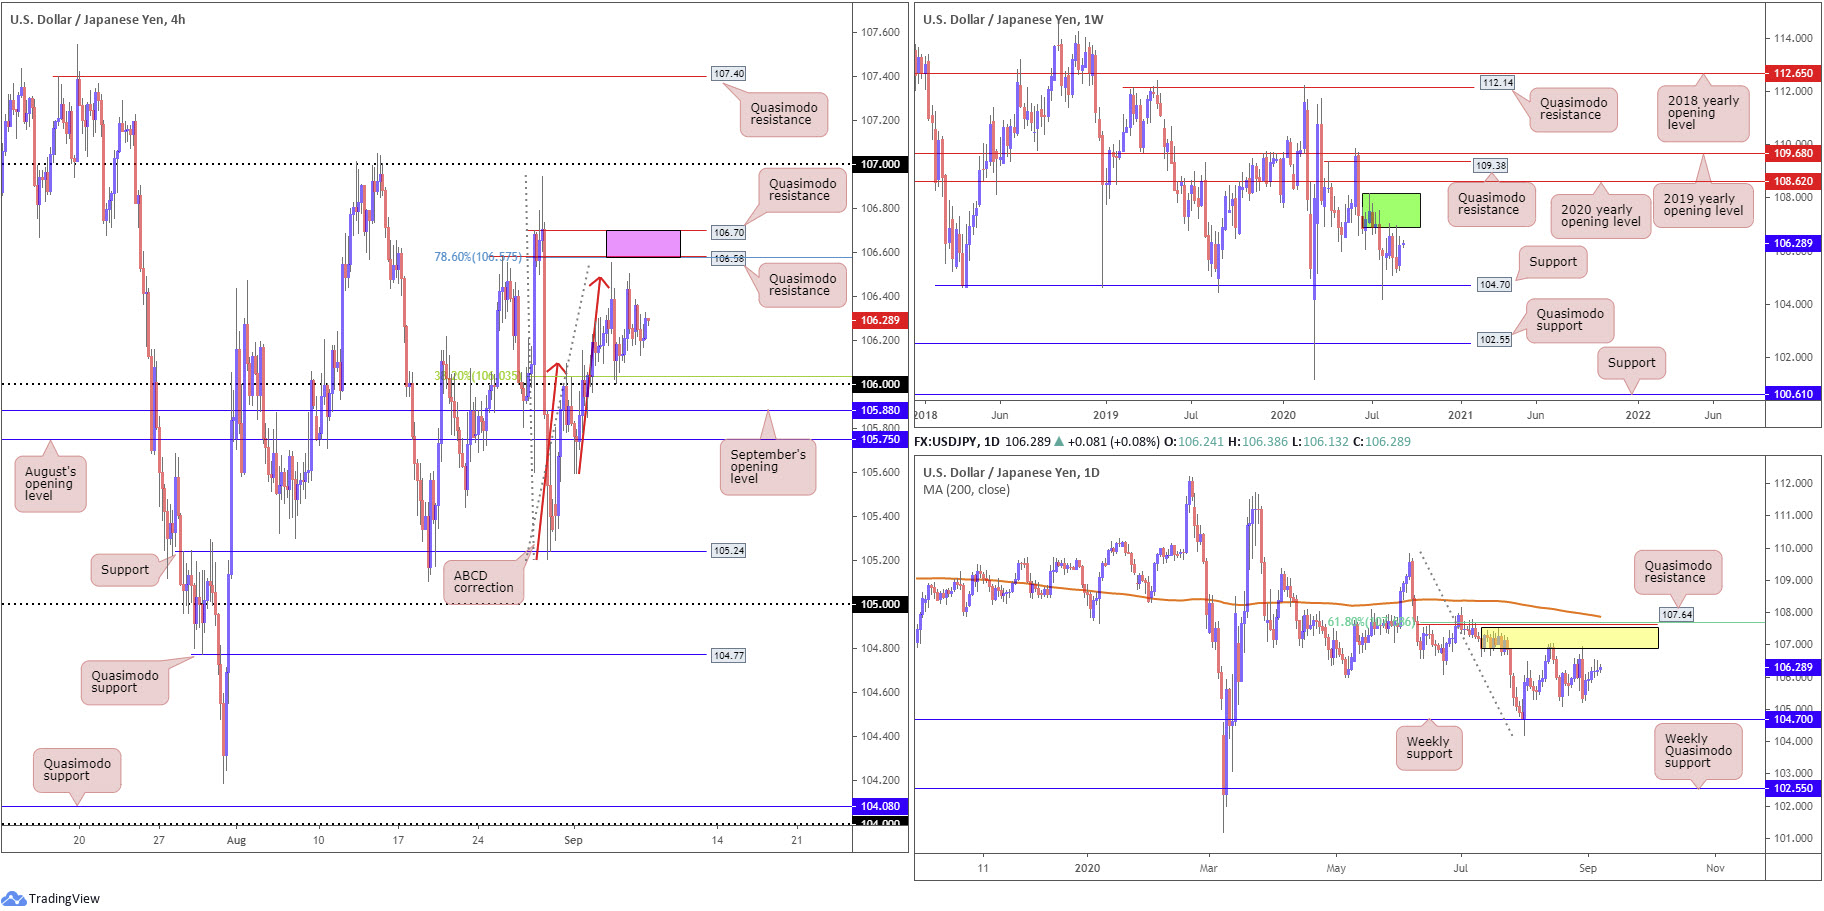
Snapping a two-week bearish phase, USD/JPY bulls went on the offensive last week and, despite leaving support at 104.70 unchallenged, added nearly 100 pips. Supply remains prominent on the weekly timeframe at 108.16-106.88 (dark green) after price made its way off support at 104.70 at the end of July. Should buyers hold recent upside, the 2020 yearly opening level at 108.62 may eventually enter view, closely tracked by Quasimodo resistance at 109.38.
Daily timeframe:
Supply at 107.55/106.89 (yellow), an area housed within the lower boundary of weekly supply mentioned above at 108.16-106.88, has proved a tough nut to crack. Downside from current price could target weekly support underlined above at 104.70. In the event buyers climb, Quasimodo resistance at 107.64 might enter play, reinforced by a 61.8% Fibonacci retracement ratio at 107.68 and 200-day SMA (orange – 107.87).
H4 timeframe:
Thursday fading ABCD resistance at 106.48 (red arrows) witnessed a retest at the 106 handle and a 38.2% Fibonacci retracement ratio at 106.03. Owing to the latter representing a common (initial) take-profit target out of ABCD patterns, and 106 being a watched figure, Friday responded to the upside and collided with peaks at 106.50 before pulling back and settling lower into the close.
Beyond 106, price action traders will acknowledge September’s opening value at 105.88, as well as August’s opening level at 105.75. A move north throws two Quasimodo formations at 106.58 (merges with 78.6% Fibonacci resistance at 106.57) and 106.70 in the pot as possible resistances (pink area).
Areas of consideration:
The fact we have the underside of weekly and daily supply areas merging around 106.88, this could draw price to 107 this week, which might have traders attempt to fade the area. Before reaching this far north, an intraday reaction from the area moulded between the two H4 Quasimodo resistances at 106.70/106.58 could also be seen.
Another retest at 106 may also take shape, yet with buyers likely consumed from Friday’s rally, a fakeout to September’s opening level at 105.88 could come to fruition to gather sell-stop liquidity and fresh buyers.
USD/CAD:
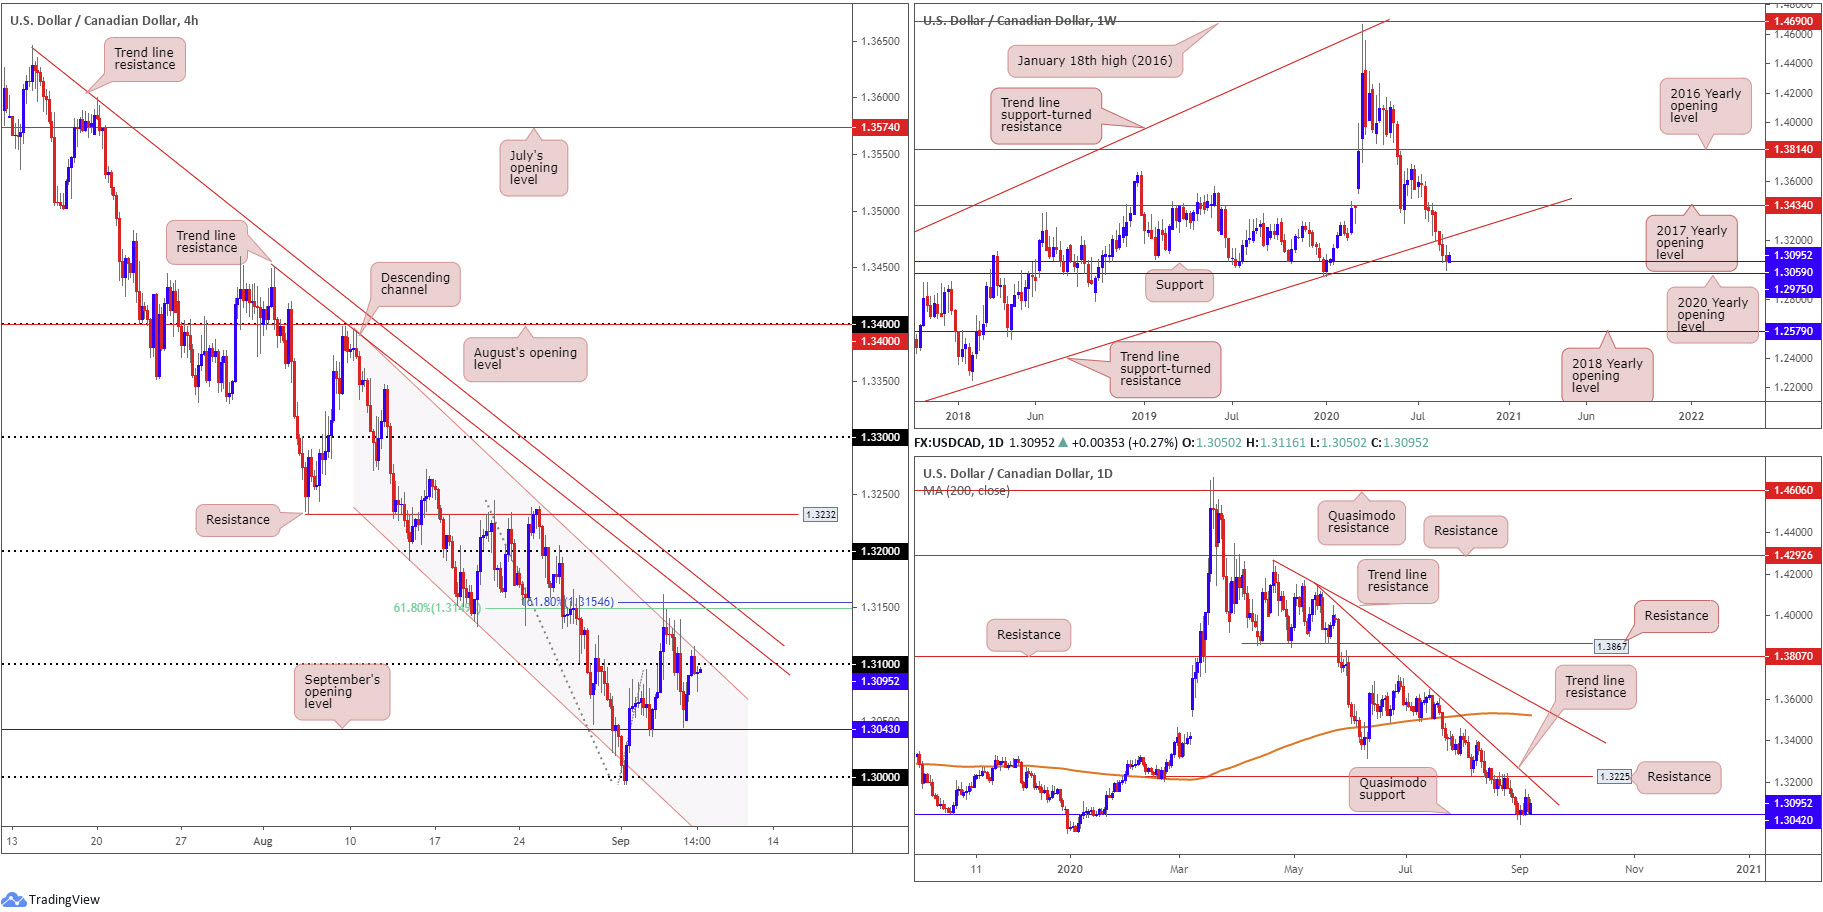
After bottoming ahead of September’s opening level at 1.3043 on the H4 Friday, USD/CAD bulls entered into an offensive phase Monday and revisited resistance at 1.31 along with converging channel resistance, drawn from 1.3394. Breaking through here today could reignite interest towards two trend line resistances, from 1.3646 and 1.3451, as well as a 161.8% Fibonacci extension point at 1.3154, and a 61.8% Fibonacci retracement ratio at 1.3149.
From the weekly timeframe, we can see that after gliding to an eighth consecutive losing week, price action crossed swords with support at 1.3059, a level positioned just north of the 2020 yearly opening level at 1.2975. The next upside target from here falls in at trend line support-turned resistance, taken from the low 1.2061. Also worth noting is the pair has been probing lower since topping in mid-March at 1.4667.
Over the past week, the daily timeframe has shown price locking horns with Quasimodo support coming in at 1.3042. Resistance at 1.3225 (a prior Quasimodo support) and trend line resistance, taken from the high 1.4140, offer logical upside targets.
Areas of consideration:
Longer term, we are entrenched within a robust down move from 1.4667, yet currently trade from weekly support around 1.2975/1.3059. So far, weekly price has yet to show much in terms of upside pressure. Buyers on the daily timeframe, nonetheless, are starting to make a show off Quasimodo support at 1.3042.
On the back of higher timeframe supports, 1.31/channel resistance on the H4 could give in. The flip side to this, of course, is sellers may make a show off H4 structure, in line with the current downtrend.
USD/CHF:
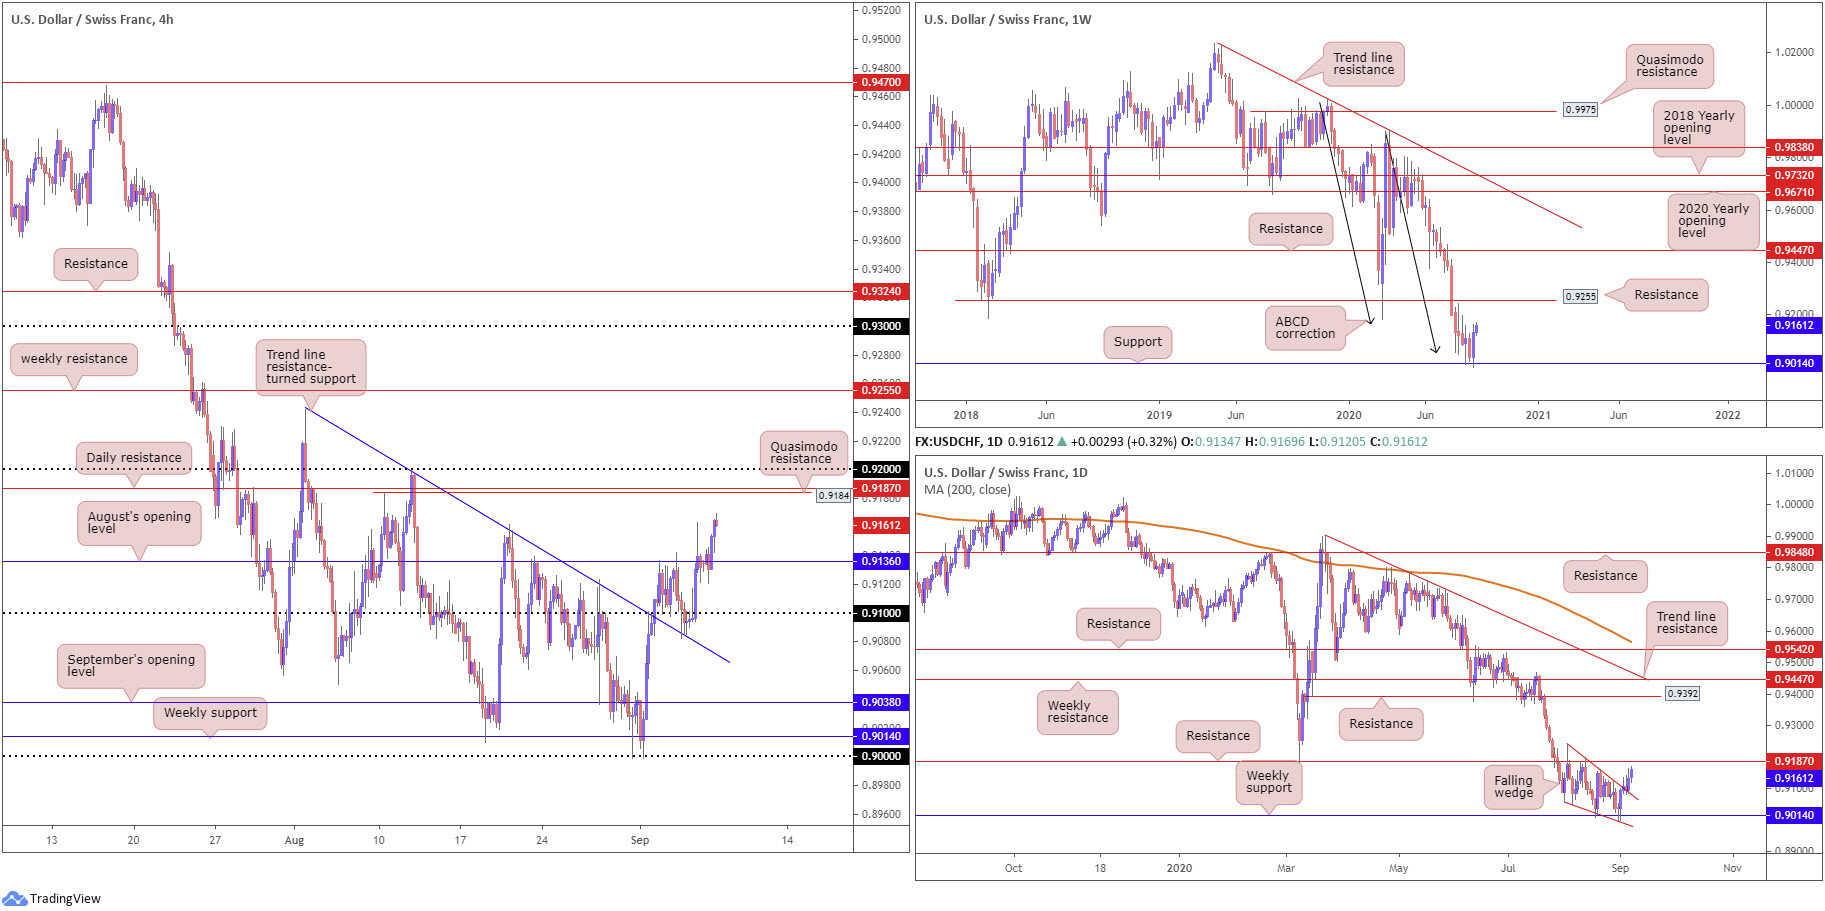
This is a beautiful market for technical analysts right now.
- The weekly timeframe reveals the pair rebounded from support at 0.9014, likely gleaning fresh impetus from ABCD support at 0.9051 (black arrows). According to technical studies, continued upside this week targets 0.9255 resistance, a previous Quasimodo support level.
- The key observation on the daily timeframe is the recently penetrated falling wedge pattern pencilled in from the high 0.9241 and a low of 0.9056. Following Friday’s breakout to the upside, Monday extended gains with price now poised to tackle resistance at 0.9187, followed by weekly resistance underlined above at 0.9255.
- H4 retested a trend line resistance-turned support, taken from the high 0.9241, and rallied strongly on Friday, with Monday taking on August’s opening level at 0.9136. This has brought light to H4 Quasimodo resistance at 0.9184, closely shadowed by daily resistance at 0.9187.
Areas of consideration:
For those who read Monday’s technical briefing you may recall the following (italics):
H4 traders, based on the recent breakout above the daily falling wedge pattern, are likely watching for a move above August’s opening level at 0.9136. Not only will this give current longs confidence (those who bought the initial breakout above the daily falling wedge), it’s likely sufficient enough to have conservative H4 buyers join the movement, targeting daily resistance underscored above at 0.9187, with a break exposing 0.92 on the H4 and then perhaps pushing for weekly resistance at 0.9255.
Going on the above, there are potentially plenty of buy orders in the market right now. Some have likely reduced risk to breakeven already, with most targeting the 0.92ish region to cash in partial profits.
Dow Jones Industrial Average:
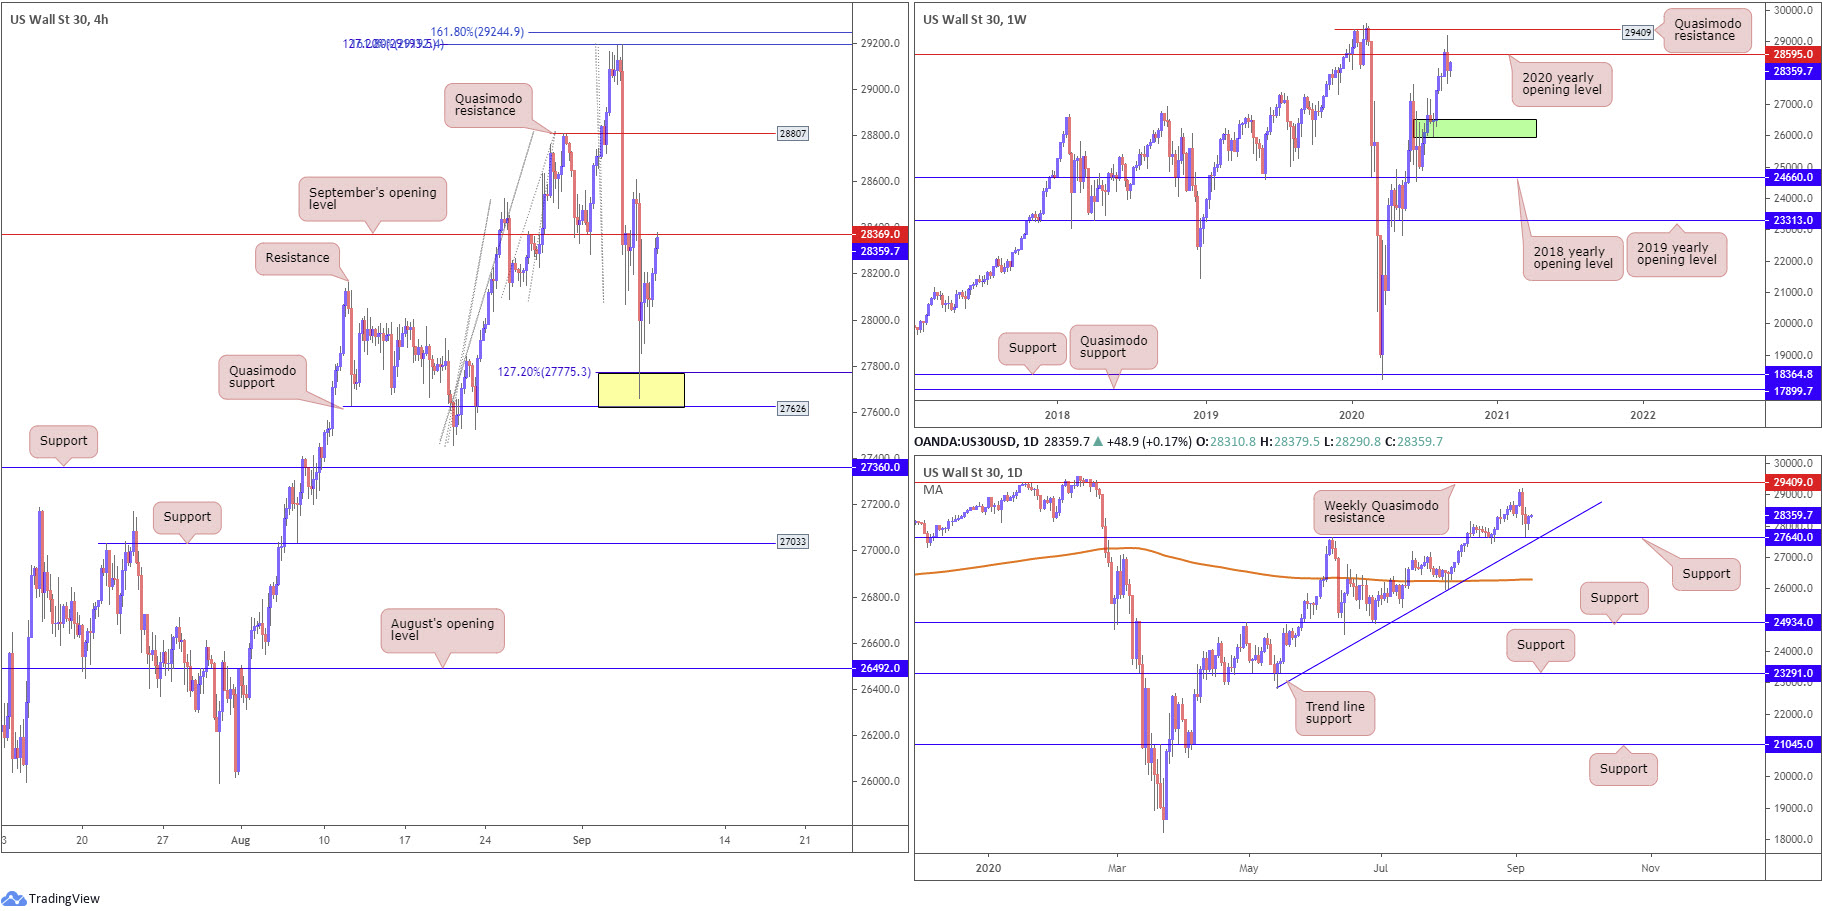
Kicking things off from the weekly timeframe this morning, we recently underlined the 2020 yearly opening value at 28595 which currently serves as resistance. Further selling could retreat as far south as demand (green) at 25916-26523. Should buyers come back to life, this may eventually have Quasimodo resistance plotted at 29409 make an appearance.
From the daily timeframe, price action recently came within touching distance of support at 27640, a level shadowed closely by trend line support, taken from the low 22803. A recovery could see the unit approach recent peaks at 29193, plotted ahead of weekly Quasimodo resistance mentioned above at 29409. Dipping beyond current supports, though, could bring light to the 200-day SMA (orange – 26299).
The technical picture on the H4 timeframe found support from a 127.2% Fibonacci extension point at 27775, placed north of Quasimodo support at 27626 (yellow area – which also housed daily support at 27640). The recovery from this area, as you can see, has driven price to September’s opening level at 28369, with a break uncovering upside to Quasimodo resistance priced in at 28807.
Areas of consideration:
For those who read Monday’s technical briefing you may recall the following (italics):
The area marked in yellow on the H4 timeframe may also be of interest to buyers this week, having seen the base consist of a H4 Quasimodo support at 27626, a 127.2% H4 Fibonacci extension point at 27775 and daily support from 27640.
Those long 27626/27775 have likely reduced risk to breakeven and banked partial profits at current H4 resistance from 28369. Consuming the latter may attract additional buying, with an upside objective, based on the H4 timeframe, set at Quasimodo resistance from 28807. Conservative buyers may opt to wait for a retest at 28369 to form before pulling the trigger.
XAU/USD (GOLD):
Spot gold finished Monday mostly unmoved amidst thinned trading conditions. For that reason, much of the following will repeat thoughts aired in Monday’s technical briefing (italics).
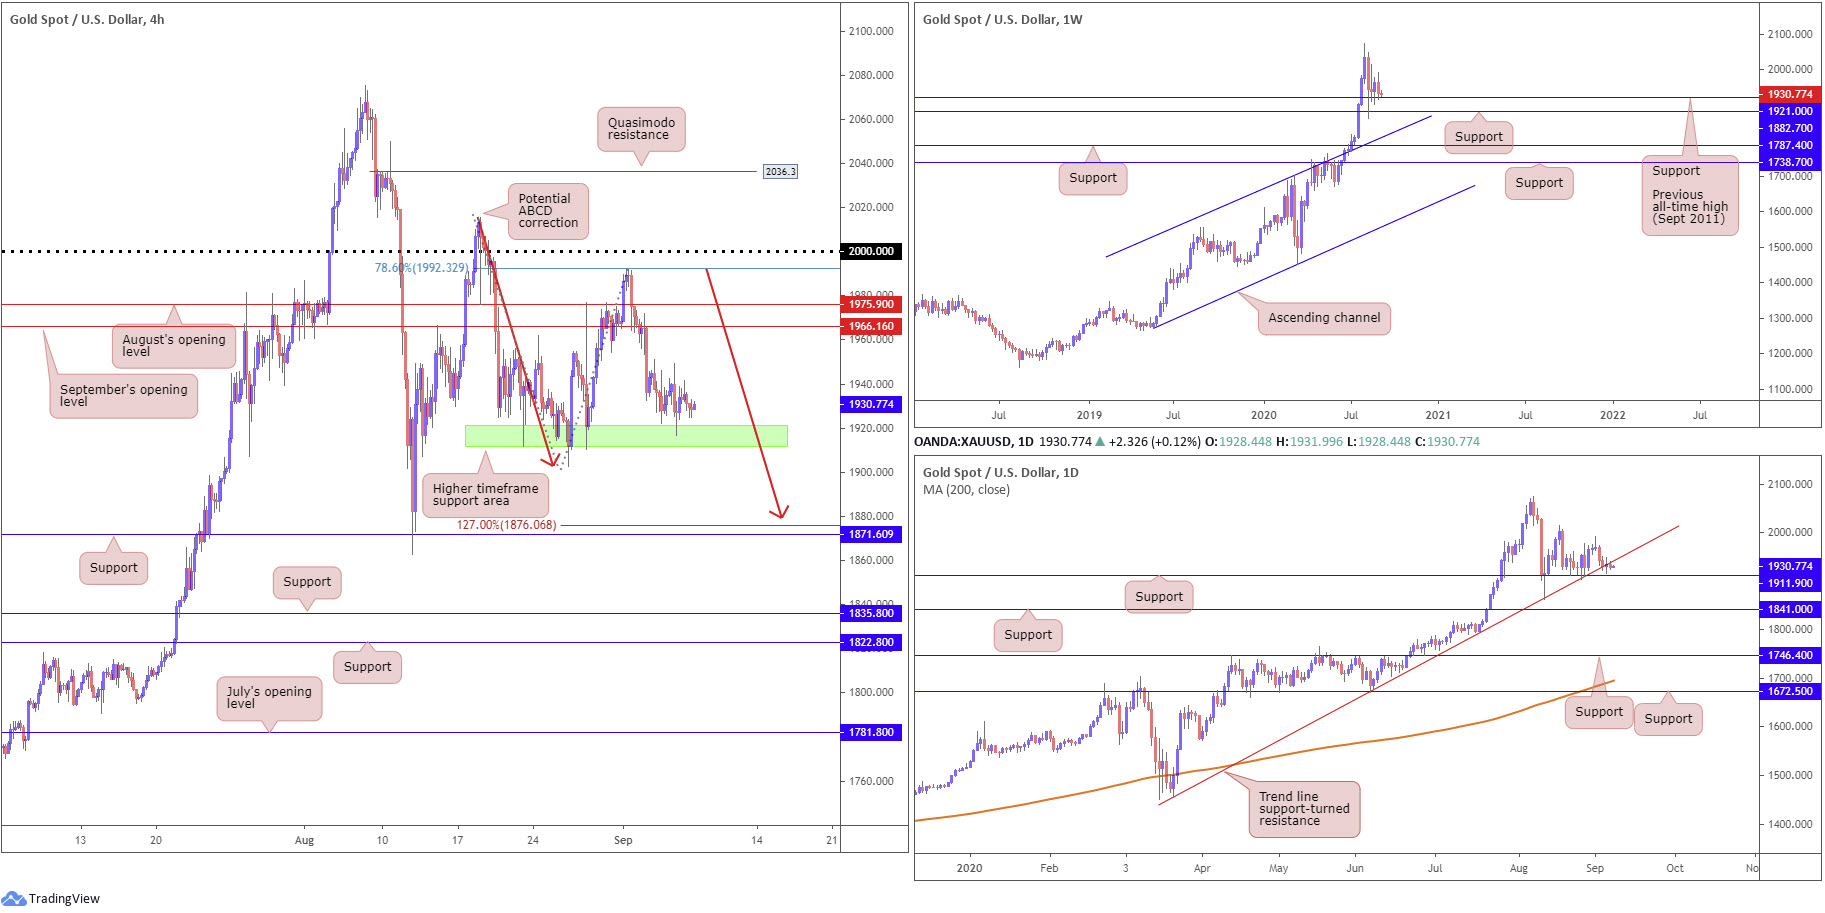
Support at $1,921.00, the previous major all-time high (September 2011) remains in play, located ahead of weekly support at $1,882.70. With the current trend trekking north since 2016, the combination of $1,882.70 and $1,921.00 may still be enough to encourage additional buying, with most targeting all-time peaks at $2,075.28 as the initial point. Failure to hold gains could see weekly channel resistance-turned support, etched from the high $1,703.28, enter view.
A closer reading of price action on the daily timeframe shows current flow hovering north of support at $1,911.90, holding under trend line support-turned resistance, taken from the low $1,455.32. Breaking higher positions the $1,992.56 September 1 high as possible resistance, with a break pushing for the $2,015.72 August 18 high.
H4, as you can see on Friday, stabbed into a familiar area of higher timeframe support at $1,911.90-$1,921.00 (green). Areas to keep a tab on should an advance from the aforementioned zone transpire are September’s opening value at $1,966.16, and August’s opening value coming in at $1,975.90.
Another possibility on the H4 timeframe, assuming we overrun higher timeframe supports, is the completion of an ABCD correction (red arrows) at $1,879.94, with a BC projection standing at (1.27) $1,876.06 (given leg C terminated at 78.6%), ahead of support coming in at $1,871.60.
Areas of consideration:
Overall, this remains a buyers’ market, according to the current trend – higher since bottoming in 2016.
Traders are likely to continue monitoring price action closely at the $1,911.90-$1,921.00 higher timeframe support area, based on the H4 scale (green). A H4 bullish candlestick formation printed from this region, for example, may draw in buyers and target $1,966.16/$1,975.90.
The accuracy, completeness and timeliness of the information contained on this site cannot be guaranteed. IC Markets does not warranty, guarantee or make any representations, or assume any liability regarding financial results based on the use of the information in the site.
News, views, opinions, recommendations and other information obtained from sources outside of www.icmarkets.com.au, used in this site are believed to be reliable, but we cannot guarantee their accuracy or completeness. All such information is subject to change at any time without notice. IC Markets assumes no responsibility for the content of any linked site.
The fact that such links may exist does not indicate approval or endorsement of any material contained on any linked site. IC Markets is not liable for any harm caused by the transmission, through accessing the services or information on this site, of a computer virus, or other computer code or programming device that might be used to access, delete, damage, disable, disrupt or otherwise impede in any manner, the operation of the site or of any user’s software, hardware, data or property.


