
EUR/USD:
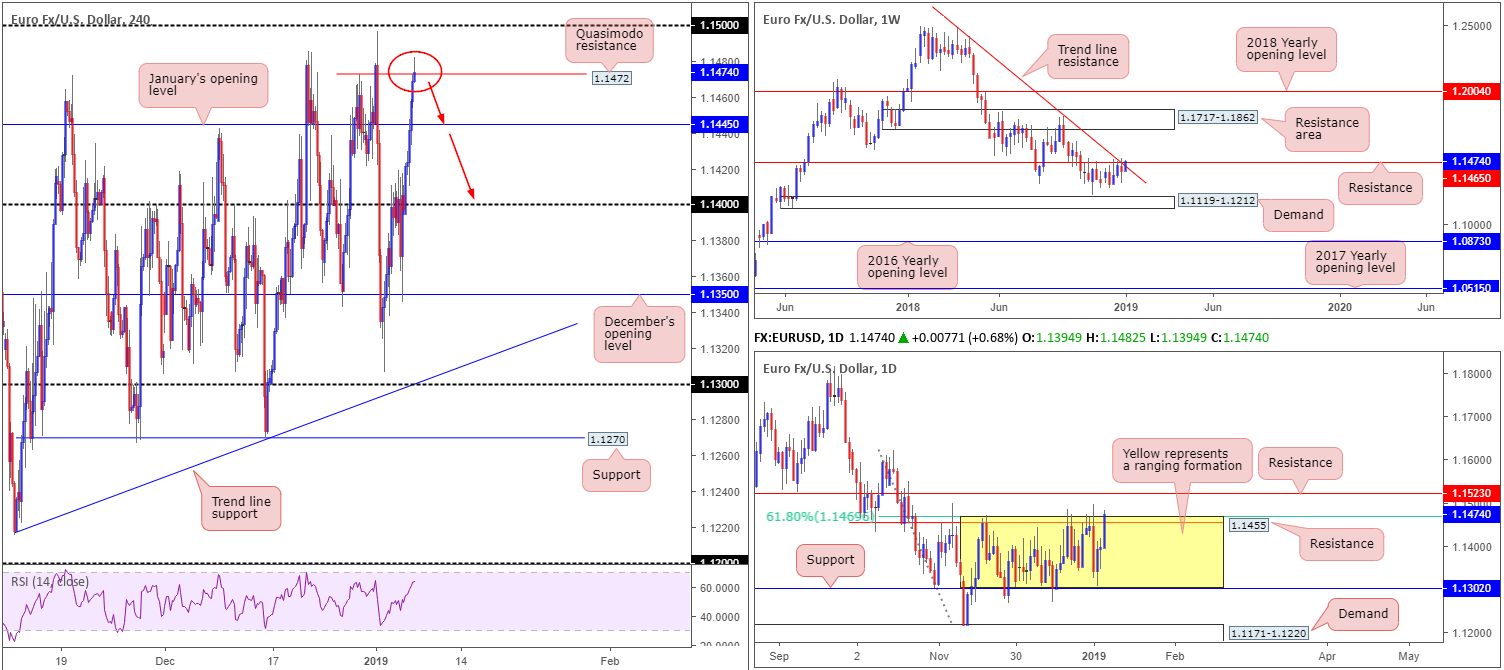
The single currency continued to capitalise on dollar softness Monday as the EUR/USD extended its advance beyond its 1.14 handle, as well as January’s opening level at 1.1445. Macroeconomic news flow did little to bolster sentiment for the buck with ISM non-manufacturing PMI falling short of consensus (57.6 vs. expected 59.6).
As is evident from the H4 timeframe this morning, the candles are seen mildly paring gains off highs 1.1482, seemingly respecting Quasimodo resistance at 1.1472. Should the candle close as is – a bearish pin-bar formation – this could inspire sellers to enter the fight, targeting January’s opening level highlighted above at 1.1445, possibly followed by 1.14.
On a wider perspective, technical structure reveals weekly movement retesting its merging resistance at 1.1465 and trend line resistance (extended from the high 1.2476). By the same token, daily flow is also visibly tackling the top edge of its range (yellow) at resistance drawn from 1.1455 (converging 61.8% Fibonacci resistance value at 1.1469). Areas of interest outside of this border fall in at resistance drawn from 1.1523 and a demand area coming in at 1.1171-1.1220.
Areas of consideration:
Despite a wearying dollar, technical studies for the EUR/USD display strong resistance on the higher timeframes, encouraging a potential round of selling (profit taking) off the current H4 Quasimodo resistance level today. Assuming H4 price closes as is, as underlined above, traders have the option of entering short at 1.1469 (the open of the pin-bar candle) with stop-loss orders positioned two pips above the pin-bar’s wick at 1.1484, equating to a 15-pip stop. As the first take-profit target does not come into view until 1.1445 (December’s opening level), this offers 24 pips to the first target, falling just short of a 1:2 risk/reward ratio. This, therefore, provides ample room to reduce risk to breakeven and take some profits off the table before buyers are expected to enter the fold.
Today’s data points: Limited.
GBP/USD:
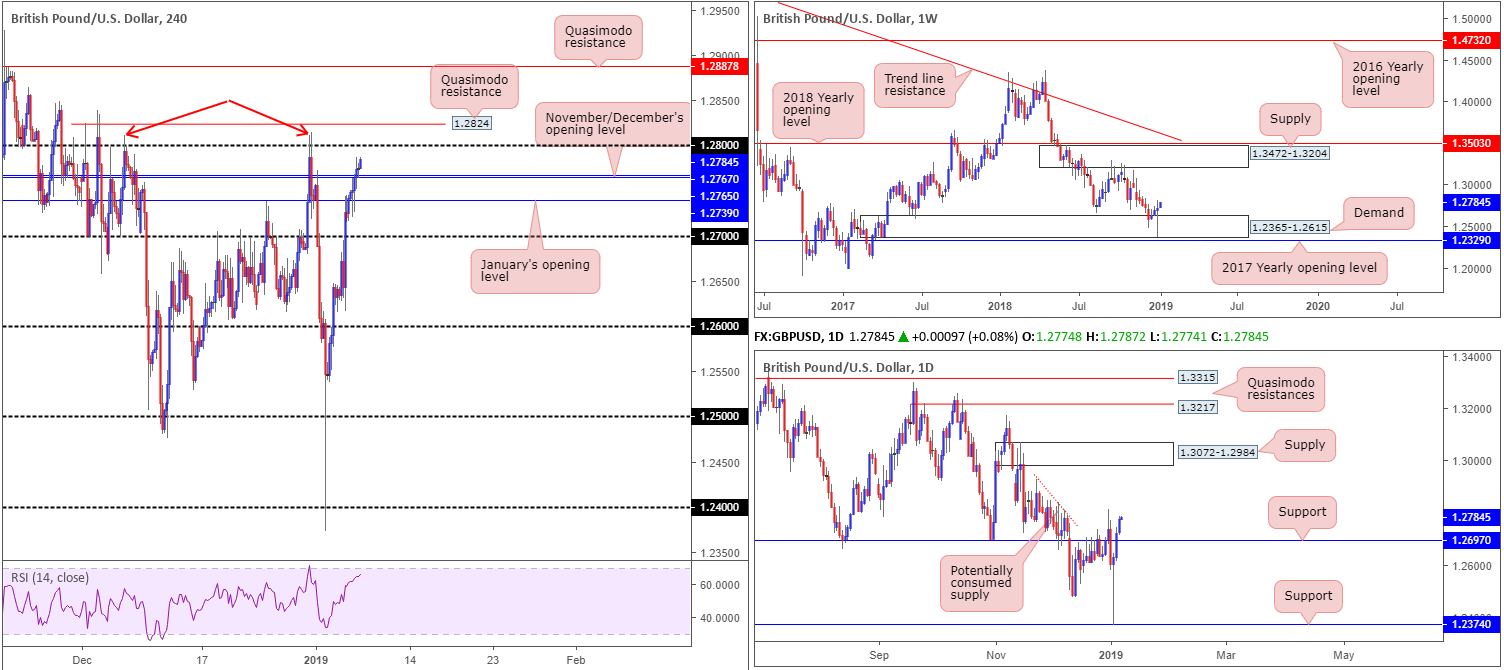
Despite a somewhat indecisive start Monday, the British pound eventually gained some traction against its US counterpart, up 0.39%. Respecting the top edge of January’s opening level as support at 1.2765, the H4 candles toppled November and December’s opening levels at 1.2767/65, uncovering 1.28 and Quasimodo resistance at 1.2824. This comes in spite of a pick-up in Brexit-related commentary as UK lawmakers returned to Westminster.
Overall, as highlighted in Monday’s briefing, both weekly and daily technical structure display signs of further upside materialising. Cable firmly entered the parapets of weekly demand at 1.2365-1.2615 in the opening stages of the year, challenging the lower borders of the area before finding willing buyers and pushing higher. Assuming buyers remain defensive, a run towards supply painted at 1.3472-1.3204 may be in store over the coming weeks. In conjunction with weekly movement, daily activity concluded recent trade closing above resistance priced in at 1.2697 (now acting support). Continued buying from this point could lead to a test of supply at 1.3072-1.2984, according to our technical studies. Above 1.2697, limited supply is visible, with a major portion likely consumed as price declined lower in late November of 2018 (see red descending line).
Areas of consideration:
While higher-timeframe structure indicates further upside, intraday sellers may want to pencil in a possible shorting opportunity off the H4 Quasimodo resistance mentioned above at 1.2824. This level is perfectly positioned to facilitate a stop run above not only the 1.28 handle, but also the two tops marked with red arrows at 1.2811 and 1.2815. In terms of stop placement for a sell, above the Quasimodo apex is possible at 1.2839. As for take-profit targets, November and December’s opening levels at 1.2767/65 are logical starting points should the unit overcome 1.28 (could potentially act as support).
In the event we overthrow 1.2824 as a sell zone today, however, traders’ crosshairs will then likely be pinned on another layer of Quasimodo resistance at 1.2887. A H4 close above 1.2824, therefore, followed up with a retest in the shape of a bullish candlestick formation (entry/stop parameters can be defined according to this pattern) would, according to where we’re positioned on the higher timeframes, be considered a high-probability long, targeting 1.2887 as the initial upside target.
Today’s data points: Limited.
AUD/USD:
The US and China resumed talks on trade Monday in Beijing, with President Trump expressing optimism about the outcome because of the damage being inflicted by US tariffs on China’s economy. The Australian dollar, whose fortunes are largely tied to China, kicked off the week in reasonably strong fashion, notching up gains of 0.45% vs. the US dollar.
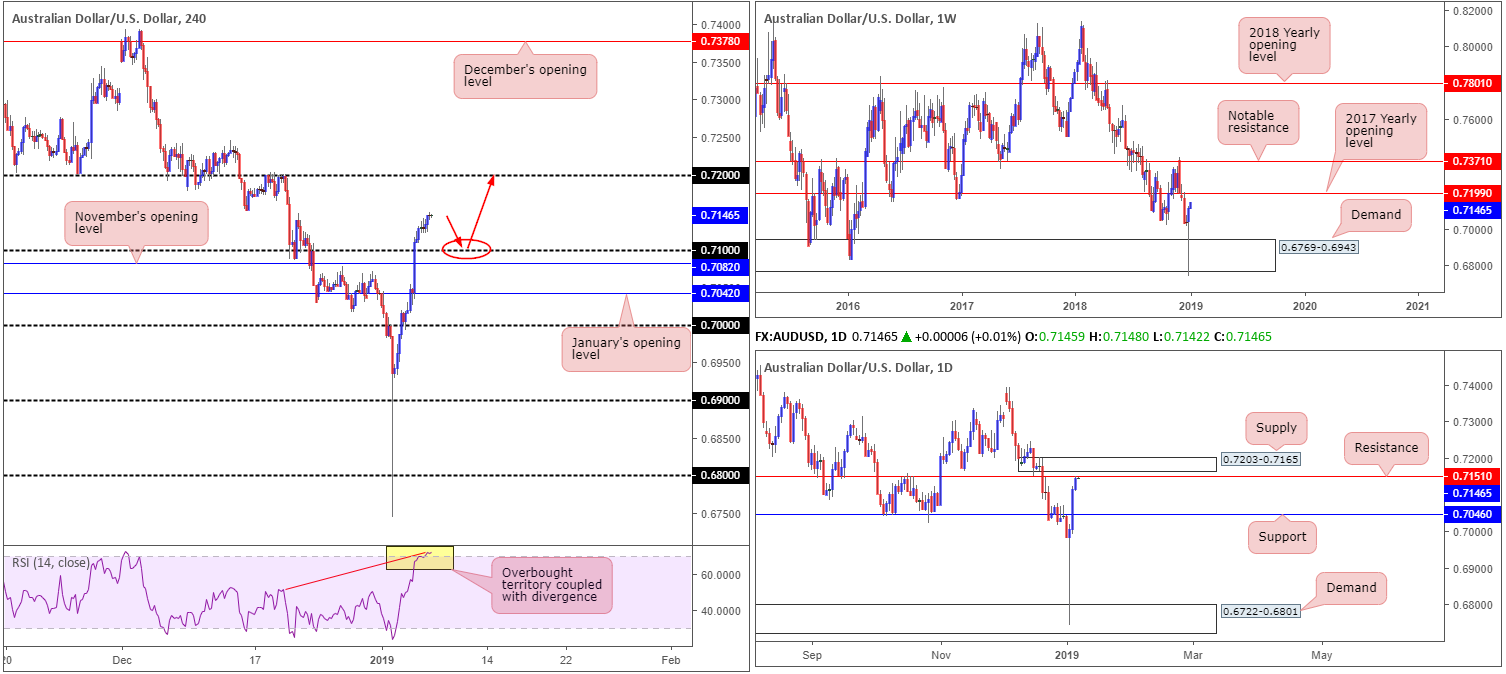
From the technical side of things, weekly flow remains poised to extend gains, targeting the 2017 yearly opening level at 0.7199. This comes after a mammoth bullish pin-bar formation printed out of demand priced in at 0.6769-0.6943. Daily movement, on the other hand, is testing waters just south of resistance priced in at 0.7151, shadowed closely by a supply zone at 0.7203-0.7165.
A closer reading of the market sees the H4 candles testing the 0.7148 Dec 20 highs, after making headway above 0.71. Beyond 0.7148, according to this timeframe, limited resistance is seen until the pair crosses swords with 0.72. 0.72, as you can probably see, has a strong connection to the 2017 yearly opening level mentioned above on the weekly timeframe at 0.7199. It might also be of interest to some traders the RSI indicator on the H4 scale is currently drawing up an overbought/divergence reading.
Areas of consideration:
On account of the above, the research team notes price action could simply continue to press for higher ground today/early week and eventually test 0.72ish, which, as we already know, denotes higher-timeframe resistance. This would imply a break of daily resistance at 0.7151, though, and a run into daily supply at 0.7203-0.7165.
On the other hand, a pullback from the 0.7148 Dec 20 highs to the 0.71 handle, given the current H4 RSI overbought/divergence signal, is also a possibility. In order to secure a trade long from here, the research team recommends waiting for additional candlestick confirmation to form due to daily sellers potentially entering the fold from its current resistance at 0.7151. Entering on candlestick confirmation enables traders to identify whether buyers have an interest at 0.71, as well as having a structure offering defined entry/stop parameters.
As far as upside targets are concerned, 0.7151 (daily resistance) and the 0.72 handle are both logical take-profit zones.
Today’s data points: Limited.
USD/JPY:
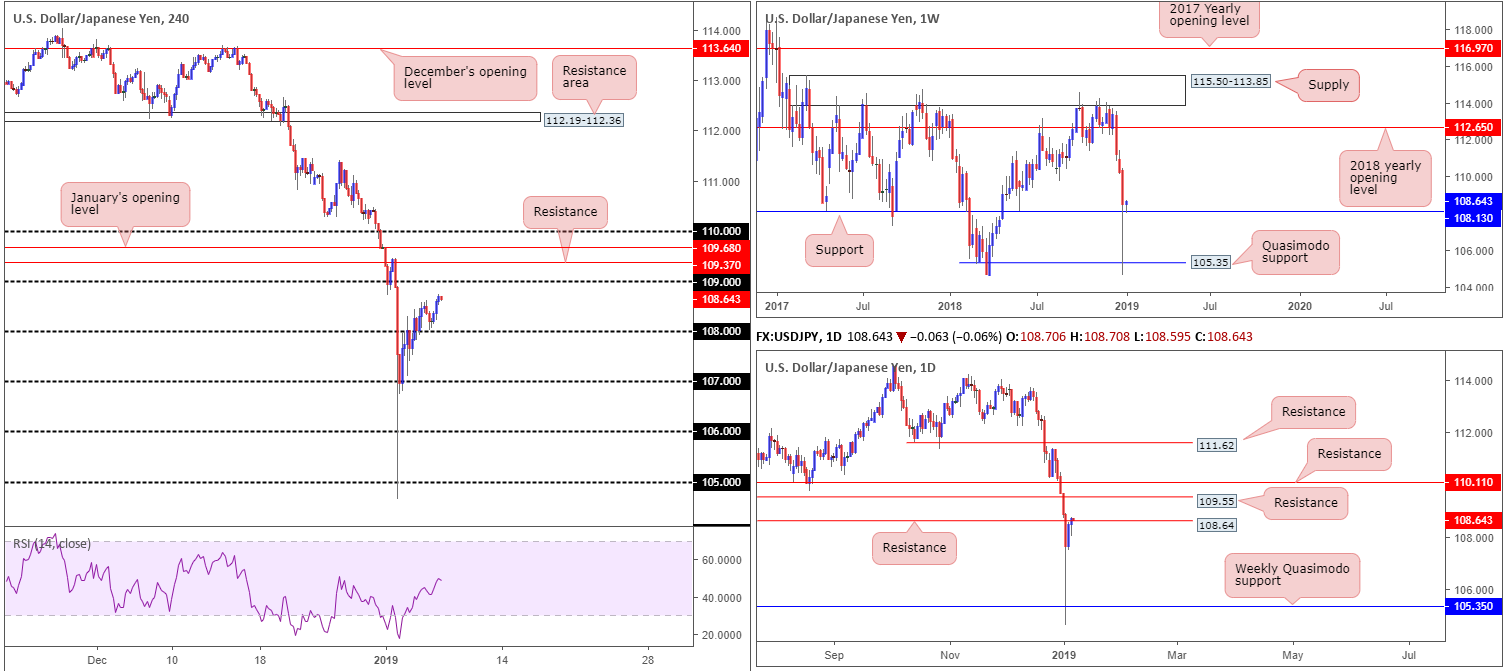
Coming in from the top this morning, the research team notes weekly price tested support at 108.13 Monday and has thus far held ground. On this timeframe, a moderately clear path to the upside is seen until we connect with the 2018 yearly opening level at 112.65.
The story on the daily timeframe, nevertheless, appears to be throwing up a few red flags. As you can see from the chart, the unit tested resistance at 108.64 yesterday – essentially a Quasimodo support-turned resistance. Another layer of resistance in the same form is visible directly above this at 109.55, shadowed closely by another point at 110.11.
A closer look at price action on the H4 timeframe reveals the unit came within striking distance of retesting 108 as support in recent trade, before turning northbound and reaching highs of 108.74. 108 was a noted level to watch for possible buying opportunities in Monday’s briefing.
Areas of consideration:
Having witnessed weekly price defend support at 108.13 and daily flow test resistance at 108.64, there’s clearly a competing theme present in this market at the moment. While this makes it difficult to decipher overall direction, weekly structure takes precedence over its lower-timeframe counterparts.
Medium term (H4), price is likely to continue exploring higher ground until shaking hands with 109. Note directly above this number we have H4 resistance at 109.37, followed by January’s opening level at 109.68. Although further buying is a possibility, finding a platform on the H4 to initiate a long position from is challenging at current price unless we retest 108 in the shape of a bullish candlestick formation (entry/stop parameters can be defined according to this pattern).
Today’s data points: Limited.
USD/CAD:
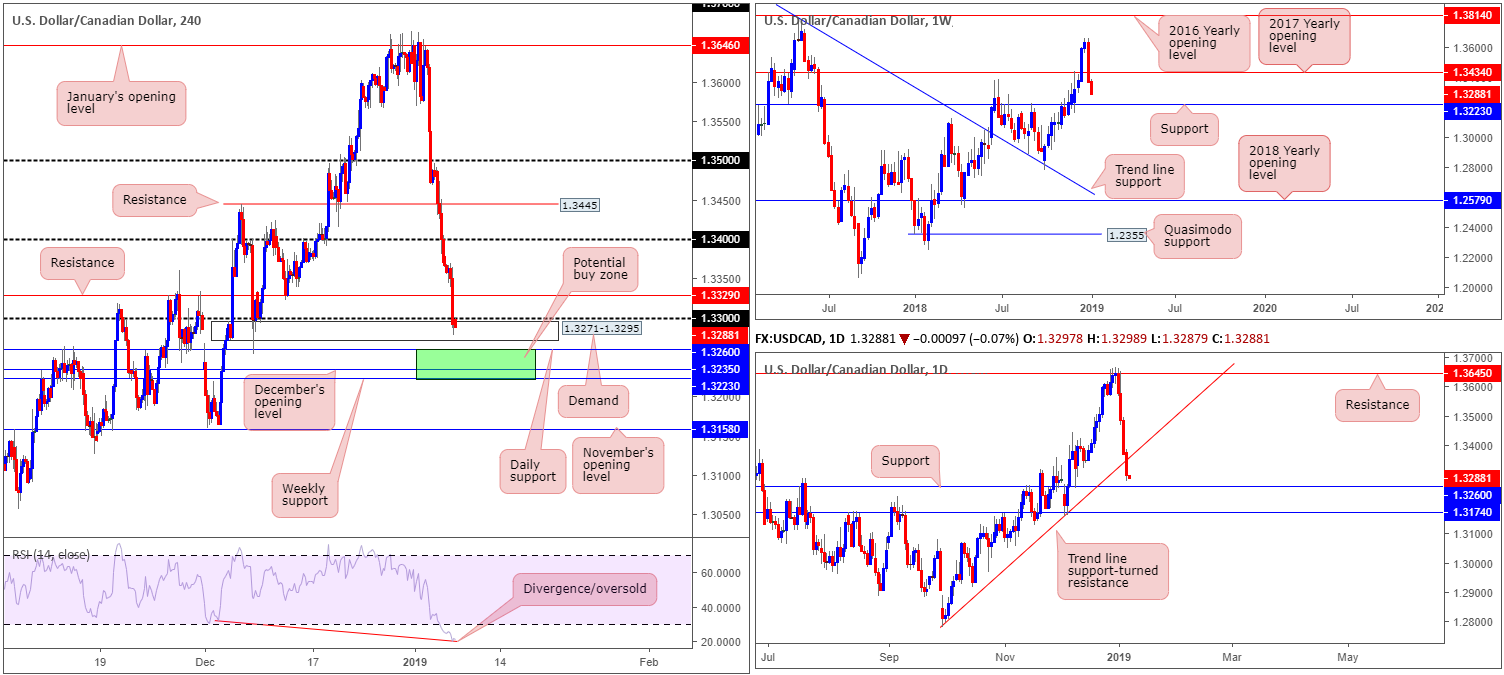
Down 0.60% Monday, the pair registered its fourth consecutive losing day off peaks of 1.3664. A combination of broad-based USD selling and WTI claiming its fifth consecutive daily gain just south of the critical $50 mark, saw the USD/CAD overthrow support at 1.3329 (now acting resistance) and the round number 1.33. Despite this, demand at 1.3271-1.3295 is in play, which could hamper breakout selling below 1.33.
Beyond the current H4 demand, we also have multiple layers of support present nearby. Daily support priced in at 1.3260 is the leading area in the firing range, followed by December’s opening level at 1.3235 on the H4 and then weekly support coming in close behind it at 1.3223. In addition to this, it might be worth noting the H4 RSI indicator is displaying a divergence/oversold reading.
Areas of consideration:
In light of the higher-timeframe supports positioned nearby and the current H4 demand, entering short in this market, despite an impressive run to the downside of late, is precarious. Each timeframe we’ve analysed points to a correction north.
Keeping it as simple as possible this morning, the green H4 zone at 1.3223/1.3260 (comprised of the weekly support at 1.3223, December’s opening level at 1.3235 and daily support at 1.3260) is an area buyers may look to enter the fight. Therefore, should traders observe signs of buying in the shape of a bullish candlestick formation (entry/stop parameters can be defined according to this pattern) a long in this market is considered high probability, targeting numbers beyond 1.33: the H4 resistance at 1.3329.
Today’s data points: Canadian Trade Balance.
USD/CHF:
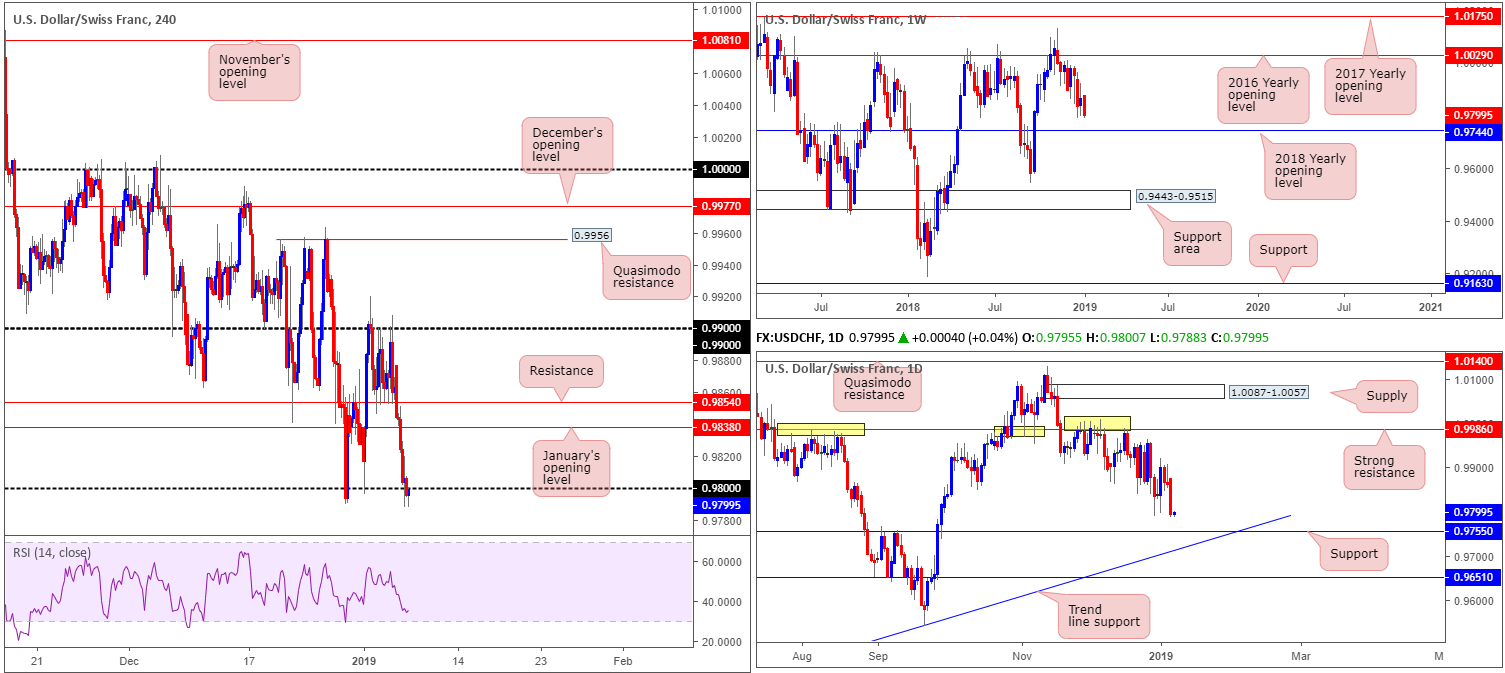
The USD/CHF slumped to a fresh 5-day low amid broad-based USD weakness Monday, forcing the H4 candles to overthrow 0.98 into the close. This, by and of itself, has potentially unlocked downside towards H4 demand coming in at 0.9737-0.9763 (not seen on the screen).
What’s notable about the aforementioned H4 demand from a technical perspective is its connection to higher-timeframe structure. Our technical studies on the weekly timeframe reveal price action is meandering just north of the 2018 yearly opening level at 0.9744, which is sited within the walls of the current H4 demand. What’s more, daily price reveals support fixed at 0.9755, also located within the H4 demand zone.
Areas of consideration:
In view of the above reading, there’s two possible scenarios to keep an eye on today:
- A retest play to the underside of 0.98, targeting the top edge of the H4 demand area at 0.9737-0.9763. Ultimately, traders are urged to enter on the back of additional confirmation here, and ensure risk/reward conditions are favourable.
- A long from the current H4 demand, knowing we have both weekly and daily support levels fixed within, is a high-probability trading opportunity. With stop-loss orders tucked beneath the lower edge of the area at 0.9735 and an entry at 0.9763, this offers traders 37 pips of profit to the underside of 0.98 as an initial take-profit zone.
Today’s data points: Limited.
Dow Jones Industrial Average:
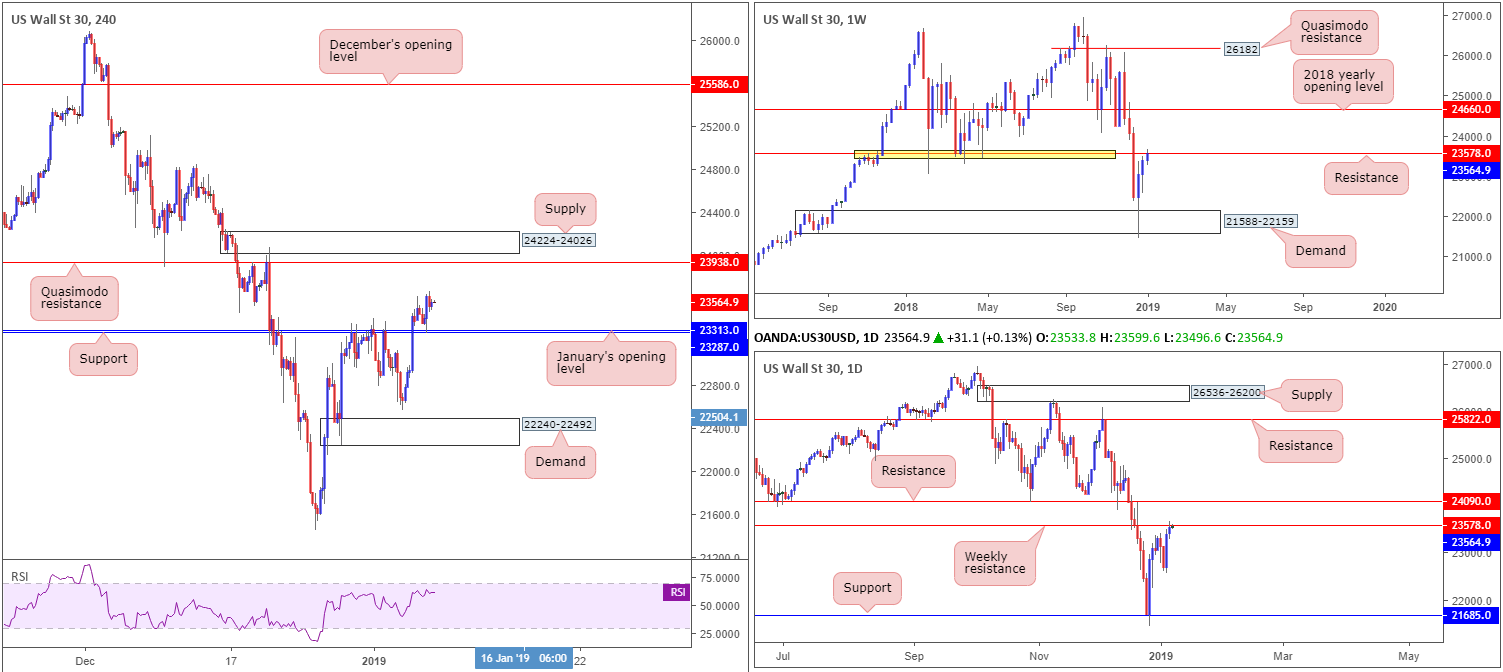
US equities built on Friday’s gains Monday, as investors hope for a positive outcome from this week’s trade talks between the US and China. Though a positive air is evident at the moment, and the H4 candles recently retested support at 23287 and January’s opening level at 23313, upside momentum could potentially diminish, according to our technical studies.
While H4 action shows room to extend gains further this week towards a Quasimodo resistance at 23938, tailed closely by a supply at 24224-24026, higher-timeframe structure points to a possible bout of selling. Weekly price, as you can see from the chart, tested resistance at 23578 in recent movement. As is evident from its history (yellow), the level once provided strong support, which could, theoretically, be mirrored as resistance this week.
Areas of consideration:
As of current price, neither a long nor short is attractive right now.
Irrespective of the direction traders select, nearby opposing structure is evident. Should you look to buy based on space seen for the H4 candles to extend higher following its test of support, you’re effectively buying into weekly resistance.
Should we turn lower today, however, and print a H4 close beyond the noted H4 supports, a sell in this market could be something to consider, targeting the 22562 Jan 19 low/H4 demand at 22240-22492. Trading this has the benefit of weekly structure backing the setup.
Today’s data points: Limited.
XAU/USD (Gold):
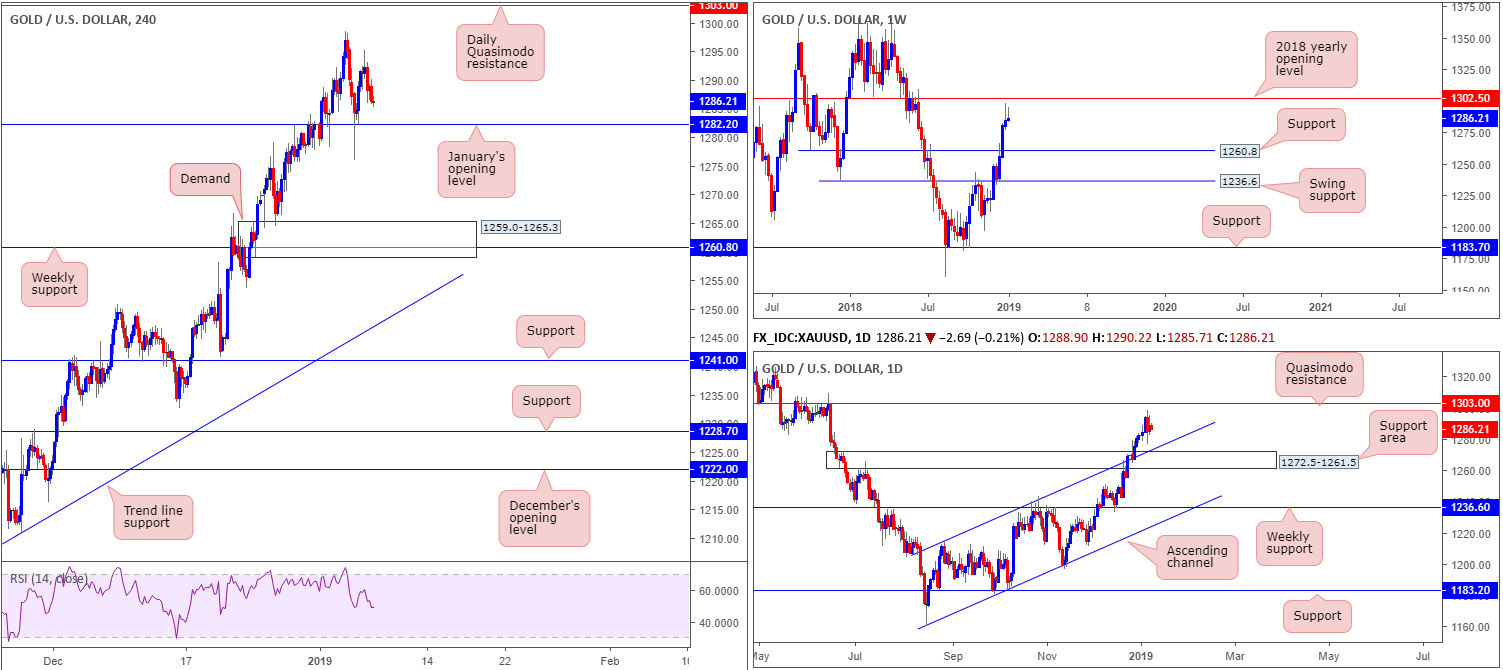
Employing a top-down approach this morning, we can see weekly price remains sluggish ahead of the 2018 yearly opening level at 1302.5 in the shape of a bearish pin-bar formation. By and of itself, this could be enough to encourage some sellers into the market.
Analyzing the market in more detail, the daily timeframe shows price action is currently lodged between a Quasimodo resistance level at 1303.0, and a channel resistance-turned support (taken from the high 1214.3) that merges with a support area coming in at 1272.5-1261.5.
Across the charts, the H4 candles show price action held ground at January’s opening level drawn from 1282.2 Monday, though failed to sustain gains beyond highs of 1295.2. As of current price, bullion is seen within touching distance of retesting 1282.2.
Areas of consideration:
In light of the above reading, the research team notes to be wary of longs from January’s opening level at 1282.2, largely because the level houses limited higher-timeframe convergence. With that being the case, a H4 demand zone coming in at 1259.0-1265.3 remains a possible area for longs this week. Not only is the area connected to weekly support at 1260.8, it is also housed within the lower limits of the current daily support area at 1272.5-1261.5.
With stop-loss orders tucked beneath the lower edge of the current H4 demand (1259.0), a rotation from this area is still high probability, given the overall market picture.
The use of the site is agreement that the site is for informational and educational purposes only and does not constitute advice in any form in the furtherance of any trade or trading decisions.
The accuracy, completeness and timeliness of the information contained on this site cannot be guaranteed. IC Markets does not warranty, guarantee or make any representations, or assume any liability with regard to financial results based on the use of the information in the site.
News, views, opinions, recommendations and other information obtained from sources outside of www.icmarkets.com.au, used in this site are believed to be reliable, but we cannot guarantee their accuracy or completeness. All such information is subject to change at any time without notice. IC Markets assumes no responsibility for the content of any linked site. The fact that such links may exist does not indicate approval or endorsement of any material contained on any linked site.
IC Markets is not liable for any harm caused by the transmission, through accessing the services or information on this site, of a computer virus, or other computer code or programming device that might be used to access, delete, damage, disable, disrupt or otherwise impede in any manner, the operation of the site or of any user’s software, hardware, data or property.


