
DXY:
The DXY (Dollar Index) chart is currently displaying a bearish overall momentum, suggesting a downward trend in the market.
In light of this bearish sentiment, the price could potentially experience a bearish reaction upon reaching the 1st resistance level and subsequently drop towards the 1st support level.
The 1st support level is noted at 101.91, and it holds significance as an overlap support, indicating potential buying interest from traders at this level.
Furthermore, there is a 2nd support level at 101.45, also recognized as an overlap support, adding additional weight to its importance as a potential price level where buyers may step in.
On the other hand, the 1st resistance level stands at 102.31, identified as an overlap resistance and coinciding with a 50% Fibonacci retracement level. This resistance level may attract selling pressure and limit further upside movement.
Additionally, the 2nd resistance is situated at 102.85, categorized as an overlap resistance, which could further hinder any upward price advances.

EUR/USD:
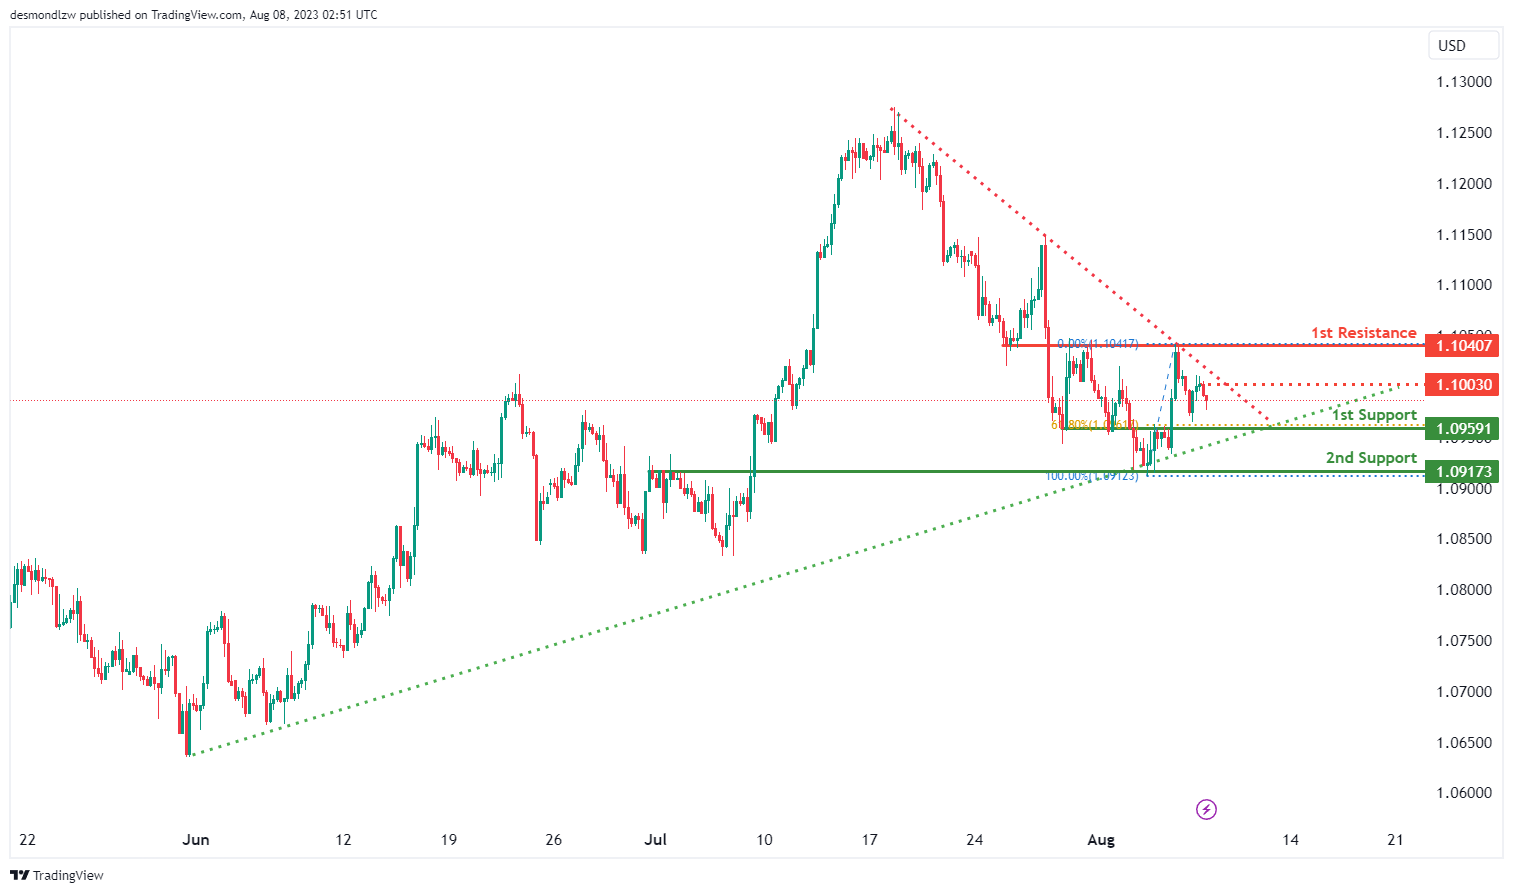
The EUR/USD chart is currently indicating a neutral overall momentum, lacking a clear directional trend.
In this situation, the price of the EUR/USD currency pair has the potential to fluctuate between the 1st resistance and the 1st support level.
The 1st support level is at 1.0959, which is considered a pullback support and gains significance from its alignment with a 61.80% Fibonacci retracement level. Traders may view this level as a favorable buying opportunity during pullbacks in the market.
Alongside the 1st support, there is a 2nd support level situated at 1.0917, identified as an overlap support. This level may also attract buyers’ interest and provide additional support during price declines.
On the other hand, the 1st resistance is positioned at 1.1040, acting as an overlap resistance and coinciding with a 50% Fibonacci retracement level. This resistance level could impede further upward movement and attract selling pressure.
Furthermore, an intermediate resistance level is noted at 1.1003, identified as an overlap resistance, further adding to potential resistance points in the price movement.
Additionally, the chart pattern observed is a symmetrical triangle, which signifies a period of consolidation before an eventual breakout or breakdown. A break above the upper trendline of the pattern might indicate a bullish breakout, while a break below the lower trendline could suggest a bearish breakdown.
EUR/JPY:
The EUR/JPY instrument currently demonstrates a bullish momentum on the chart. Given this trend, the price is expected to maintain its bullish trajectory, moving towards the 1st resistance level at 157.95.
The 1st support level at 156.02 is significant due to its role as a multi-swing low support. The 2nd support, identified at 155.23, is characterized by its overlap support nature and is aligned with a 38.20% Fibonacci Retracement.
Turning our attention to resistance levels, the 1st resistance at 157.95 is notable for its multi-swing high resistance characteristic. The 2nd resistance, pinpointed at 159.91, corresponds with a 127.20% Fibonacci Extension.
Additionally, there’s an intermediate resistance level set at 157.51, which stands out for its function as a swing high resistance.

EUR/GBP:
The EUR/GBP instrument currently showcases a bearish trend on the chart. Given this downward trajectory, there’s a potential for the price to continue its bearish path towards the 1st support level, set at 0.8588.
This 1st support level is significant because it acts as an overlap support and aligns with a 61.80% Fibonacci Retracement. Meanwhile, the 2nd support at 0.8543 is notable due to its nature as a swing low support, also corresponding with a 78.60% Fibonacci Retracement.
On the flip side, the 1st resistance is located at 0.8637 and is characterized by its pullback resistance attribute, in conjunction with a 61.80% Fibonacci Retracement. The 2nd resistance level, situated at 0.8701, is distinguished by its role as a swing high resistance.

GBP/USD:
The GBP/USD chart is currently showing a bearish overall momentum, indicating a downward trend in the market.
Given this bearish sentiment, the price of the GBP/USD currency pair has the potential to continue its bearish movement towards the 1st support level.
The 1st support level is located at 1.2724 and gains significance as an overlap support, being aligned with a 100% Fibonacci projection level. This level may attract buyers’ interest and provide a potential floor for the price during the bearish continuation.
In addition to the 1st support, there is a 2nd support level situated at 1.2675, identified as an overlap support, which adds further reinforcement to its potential as a support level.
On the other hand, the 1st resistance level is positioned at 1.2724, noted as a multi-swing high resistance. This level could act as a significant barrier to any upward movement in the price.
Furthermore, there is a 2nd resistance level at 1.2850, identified as a pullback resistance, which may limit any upward retracement attempts during the bearish trend.

GBP/JPY:
The GBP/JPY currency pair appears to be on a bullish momentum. Given this upward trajectory, there’s potential for the price to continue its bullish trend towards the 1st resistance level, which is located at 183.13.
The 1st support level, pegged at 181.89, acts as an overlap support and is of significance due to its proximity to current price levels, offering a potential cushion against potential pullbacks. The 2nd support level is established at 180.59, and its importance is elevated because it serves as a multi-swing low support, aligning with a 38.20% Fibonacci Retracement.
On the upside, the 1st resistance point is at 183.13, denoted by its multi-swing high resistance characteristic. This is a crucial level to watch as breaking above it could pave the way for further bullish momentum. The 2nd resistance level is slightly higher, at 183.79, which is also recognized for its role as a multi-swing high resistance. Breaking this level might indicate a strong bullish continuation.

USD/CHF:
The USD/CHF chart is currently demonstrating a bearish overall momentum, suggesting a downward trend in the market.
This bearish sentiment is supported by the fact that the price is following a bearish descending channel pattern.
Given this bearish trend, the price of USD/CHF may potentially continue its downward movement towards the 1st support level.
The 1st support level is noted at 0.8697, which is considered an overlap support. This level may attract buyers and provide potential support during the bearish continuation.
Furthermore, there is a 2nd support level at 0.8630, identified as a pullback support. Traders may view this level as a critical area of potential buying interest during price pullbacks in the market.
On the other hand, the 1st resistance level stands at 0.8791, categorized as a swing high resistance. This level could act as a significant barrier to any potential upward movement in the price.
Additionally, there is a 2nd resistance level at 0.8827, recognized as a pullback resistance. This level may limit any upward retracement attempts during the bearish trend.

USD/JPY:
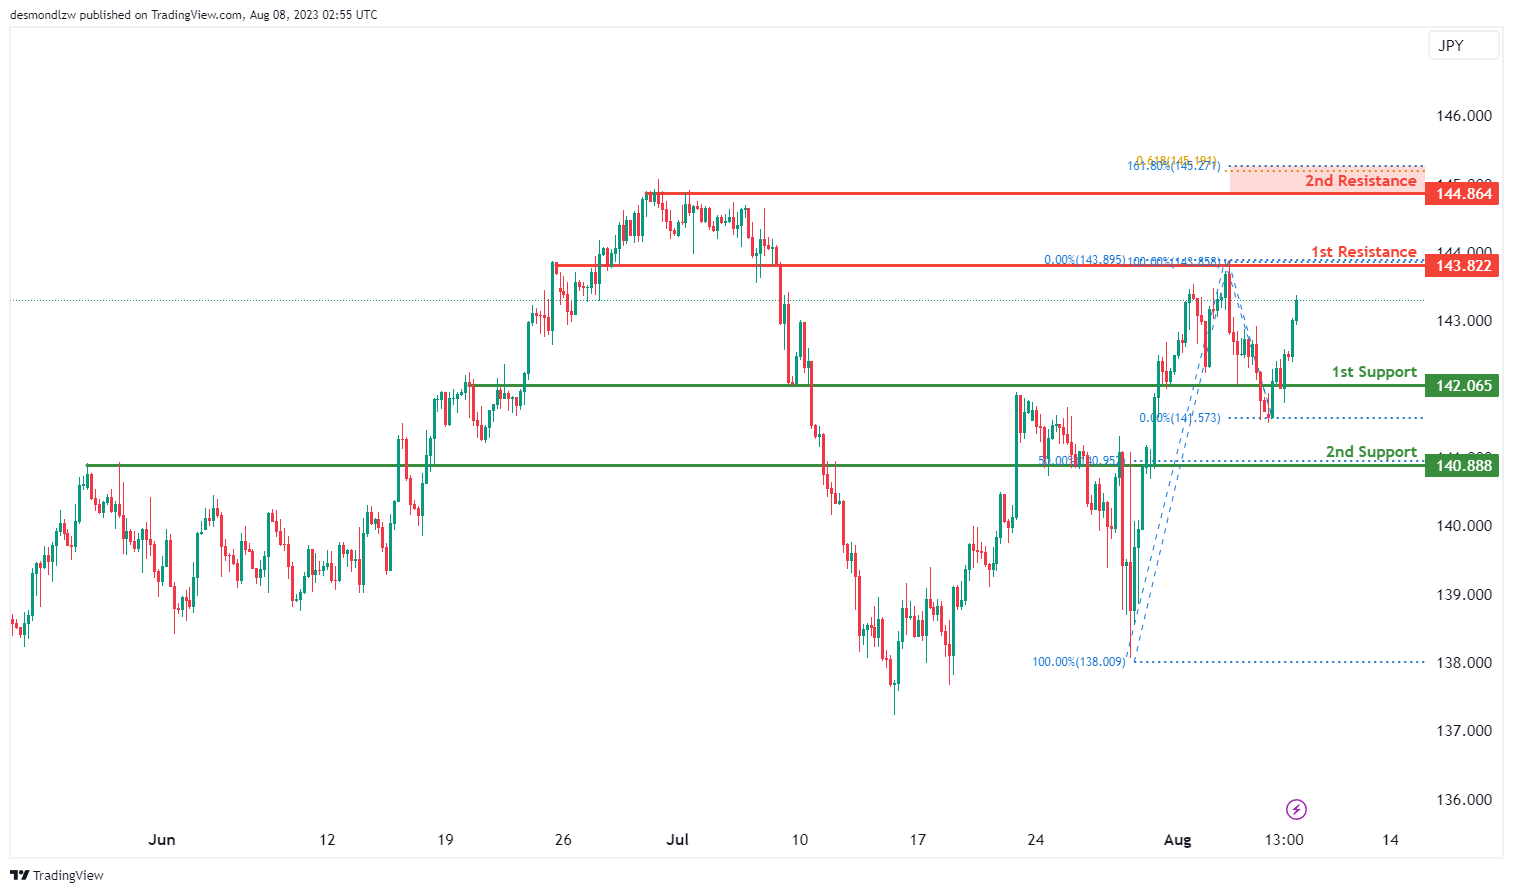
The USD/JPY chart is currently showing a bullish overall momentum, indicating an upward trend in the market.
Given this bullish sentiment, the price of the USD/JPY currency pair has the potential to continue its upward movement towards the 1st resistance level.
The 1st support level is located at 142.0600 and is considered an overlap support, which may attract buyers and provide a potential floor for the price during any retracements.
In addition to the 1st support, there is a 2nd support level situated at 140.8800, identified as a pullback support, adding further significance to its potential as a support level during price pullbacks.
On the other hand, the 1st resistance level is positioned at 143.8200 and is noted as an overlap resistance. This level could act as a significant barrier to any further upward movement in the price.
Furthermore, there is a 2nd resistance level at 144.8600, recognized as a pullback resistance. This level holds additional importance due to its alignment with a 61.80% Fibonacci projection and a 161.80% Fibonacci extension, indicating Fibonacci confluence, which may exert strong resistance and limit the price’s upward movement.
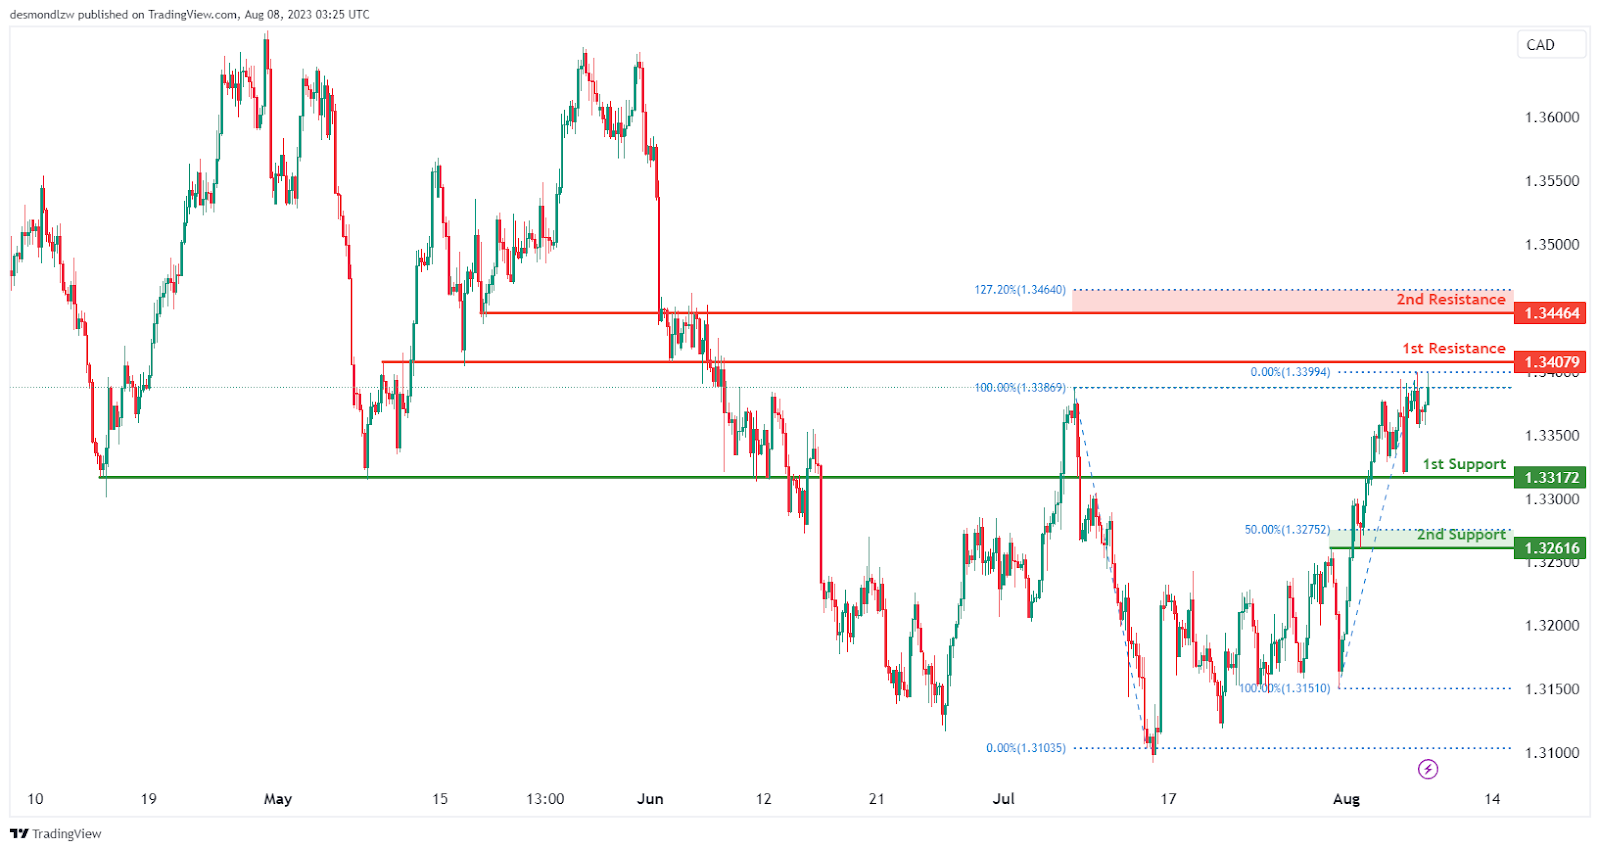
USD/CAD:
The USD/CAD pair is currently displaying a bullish momentum, indicating a possible bullish continuation towards the 1st resistance level.
The 1st resistance level is at 1.3408 which is identified as an overlap resistance, making it a potential obstacle for an upward price movement. Should the price break above this level, the 2nd resistance at 1.3446 may come into play. This is a resistance level that aligns with close to the 127.20% Fibonacci extension level which could potentially act as a barrier for further upside movement.
To the downside, the 1st support level is at 1.3317, identified as an overlap support where price has previously found both support in the past. The 2nd support level at 1.3262 which represents a pullback support that is reinforced by the 50% Fibonacci retracement level.
AUD/USD:
The AUD/USD pair is currently demonstrating a bearish moomentum with the expectation for a bearish continuation towards the 1st support level.
The 1st support level at 0.6518 is recognized as a swing-low support. If the price breaches this level, the 2nd support level is at 0.6465. This level has also been identified as a swing-low support that corresponds with the 61.80% Fibonacci projection level.
To the upside, the 1st resistance level at 0.6604 is an overlap resistance that aligns with the 38.20% Fibonacci retracement level. Should the price break above this level, the 2nd resistance at 0.6640 may come into focus. This level is recognized as an overlap resistance that could prove to be a significant barrier should price rise to this level.

NZD/USD
The NZD/USD chart is currently exhibiting a bullish overall momentum, indicating an upward trend in the market.
Given this bullish sentiment, the price of NZD/USD may potentially experience a bullish bounce off the 1st support level at 0.6068 and continue its upward movement towards the 1st resistance level at 0.6128.
The 1st support level is located at 0.6068 and is considered an overlap support. In addition to the 1st support, there is a 2nd support level at 0.6036, identified as a swing low support. This level gains significance from its alignment with a 61.80% Fibonacci projection, adding further strength to its potential as a support level.
On the other hand, the 1st resistance level stands at 0.6128 and is noted as an overlap resistance. This level could act as a significant barrier to any further upward movement in the price.
Furthermore, there is a 2nd resistance level at 0.6163, identified as an overlap resistance, and aligned with a 61.80% Fibonacci retracement. This level may exert additional resistance pressure on the price.

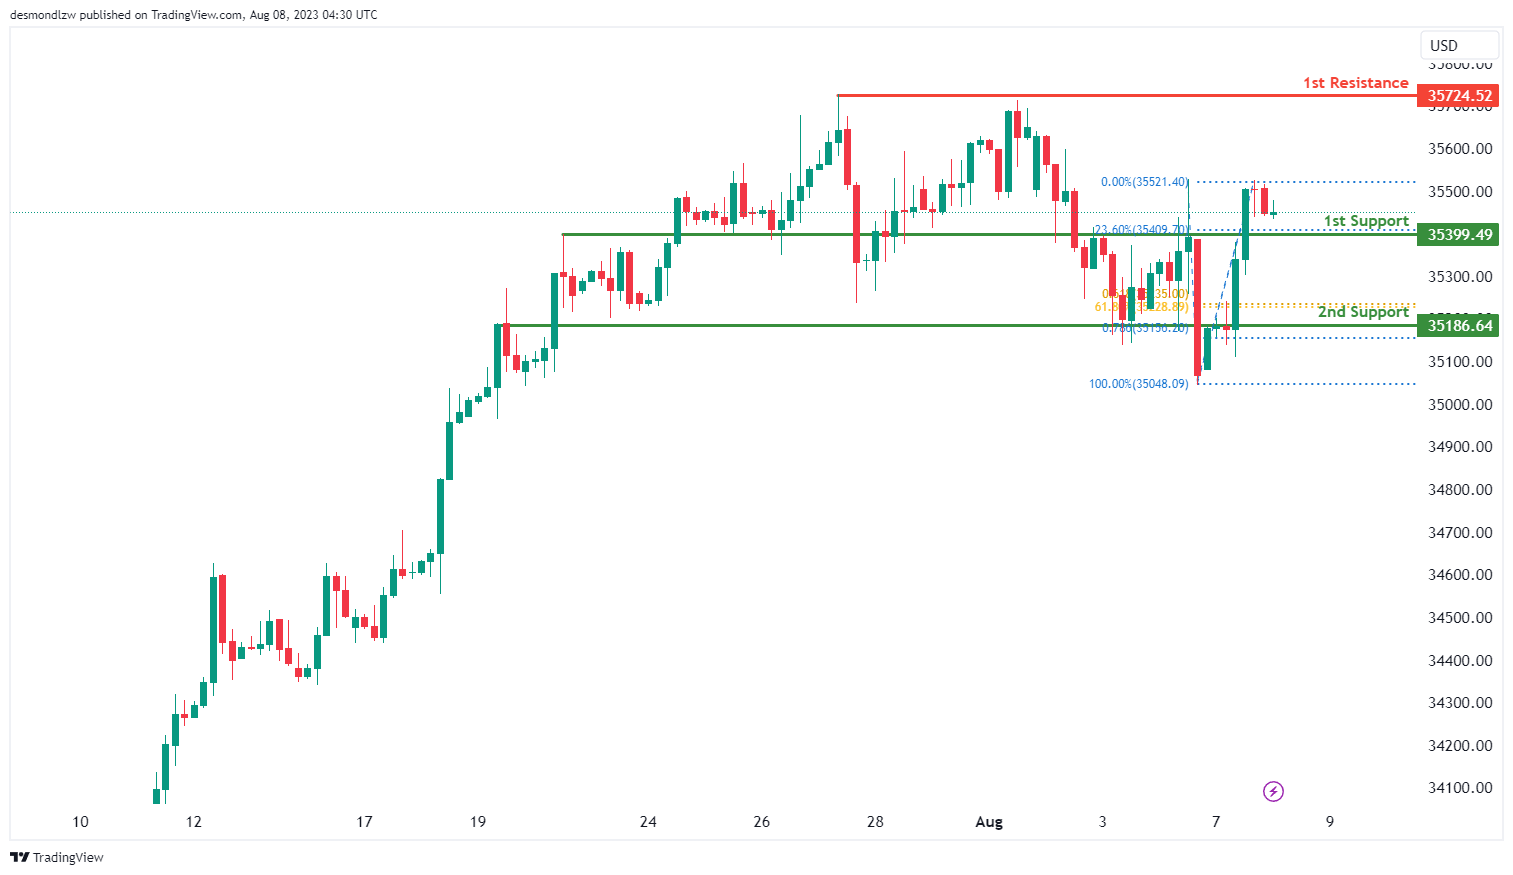
DJ30:
The DJ30 instrument is currently displaying a bearish overall momentum on the chart. The price could potentially continue its bearish movement towards the 1st support level at 35399.49.
The 1st support level at 35399.49 is recognized for its role as an overlap support and its alignment with a 23.60% Fibonacci Retracement. The 2nd support, positioned at 35186.64, stands out for its overlap support designation. Additionally, it correlates with both a 61.80% Fibonacci Retracement and a 61.80% Fibonacci Projection, highlighting a Fibonacci confluence.
On the resistance front, the 1st resistance level at 35724.52 is notable for its role as a multi-swing high resistance.
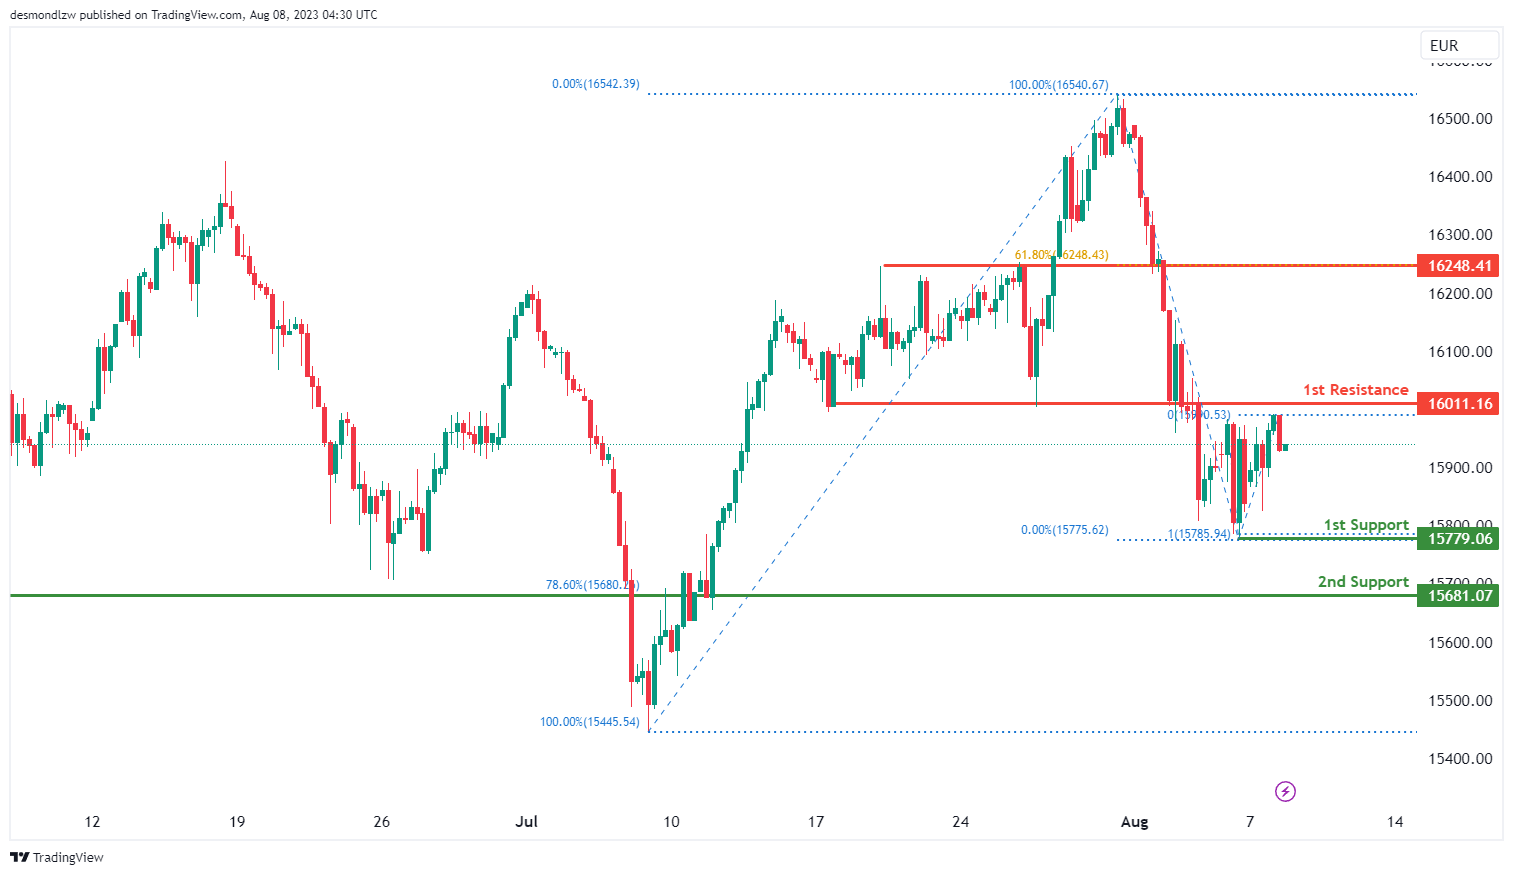
GER30:
The GER30 instrument is currently indicating a bearish momentum on the chart. The price is anticipated to continue its bearish trajectory towards the 1st support level at 15779.06.
The 1st support level at 15779.06 is distinguished for its role as a swing low support and its alignment with a 100% Fibonacci Projection. The 2nd support, pinpointed at 15681.07, is notable because of its overlap support designation and its correspondence with a 78.60% Fibonacci Retracement.
In terms of resistance, the 1st resistance level at 16011.16 is characterized by its function as a pullback resistance. The 2nd resistance at 16248.41 is defined by its status as an overlap resistance and its alignment with a 61.80% Fibonacci Retracement.
US500
The US500 instrument currently showcases a bearish momentum on the chart. The price is anticipated to continue its bearish movement towards the 1st support level at 4477.5.
The 1st support level at 4477.5 is prominent due to its function as a swing low support. Additionally, it aligns with a 78.60% Fibonacci Retracement and a 61.80% Fibonacci Projection, which signifies a Fibonacci confluence. The 2nd support, set at 4455.5, is characterized by its role as a pullback support and its correspondence with a 100% Fibonacci Projection.
In the realm of resistance, the 1st resistance level at 4527.7 is recognized as an overlap resistance and aligns with a 50% Fibonacci Retracement. The 2nd resistance level at 4575.5 is defined by its status as an overlap resistance and its association with a 78.60% Fibonacci Retracement.

BTC/USD:
The BTC/USD instrument currently exhibits a neutral momentum on the chart. The price is predicted to fluctuate between the 1st resistance level at 29694 and the 1st support level at 28827.
The 1st support level at 28827 is recognized for its role as a multi-swing low support. The 2nd support, situated at 28179, is defined by its function as a pullback support and coincides with a 50% Fibonacci Retracement.
On the resistance spectrum, the 1st resistance level at 29694 is marked by an overlap resistance. The 2nd resistance, positioned at 30405, is characterized by its status as a multi-swing high resistance.

ETH/USD:
The ETH/USD instrument is currently exhibiting a neutral momentum on the chart. It is anticipated that the price might fluctuate between the 1st resistance level at 1849.08 and the 1st support level at 1816.34.
The 1st support level at 1816.34 is notable for its role as a multi-swing low support. The 2nd support, pinpointed at 1778.84, is characterized by its status as an overlap support.
In terms of resistance, the 1st resistance level at 1849.08 is identified by an overlap resistance. Similarly, the 2nd resistance at 1886.54 is marked as an overlap resistance.

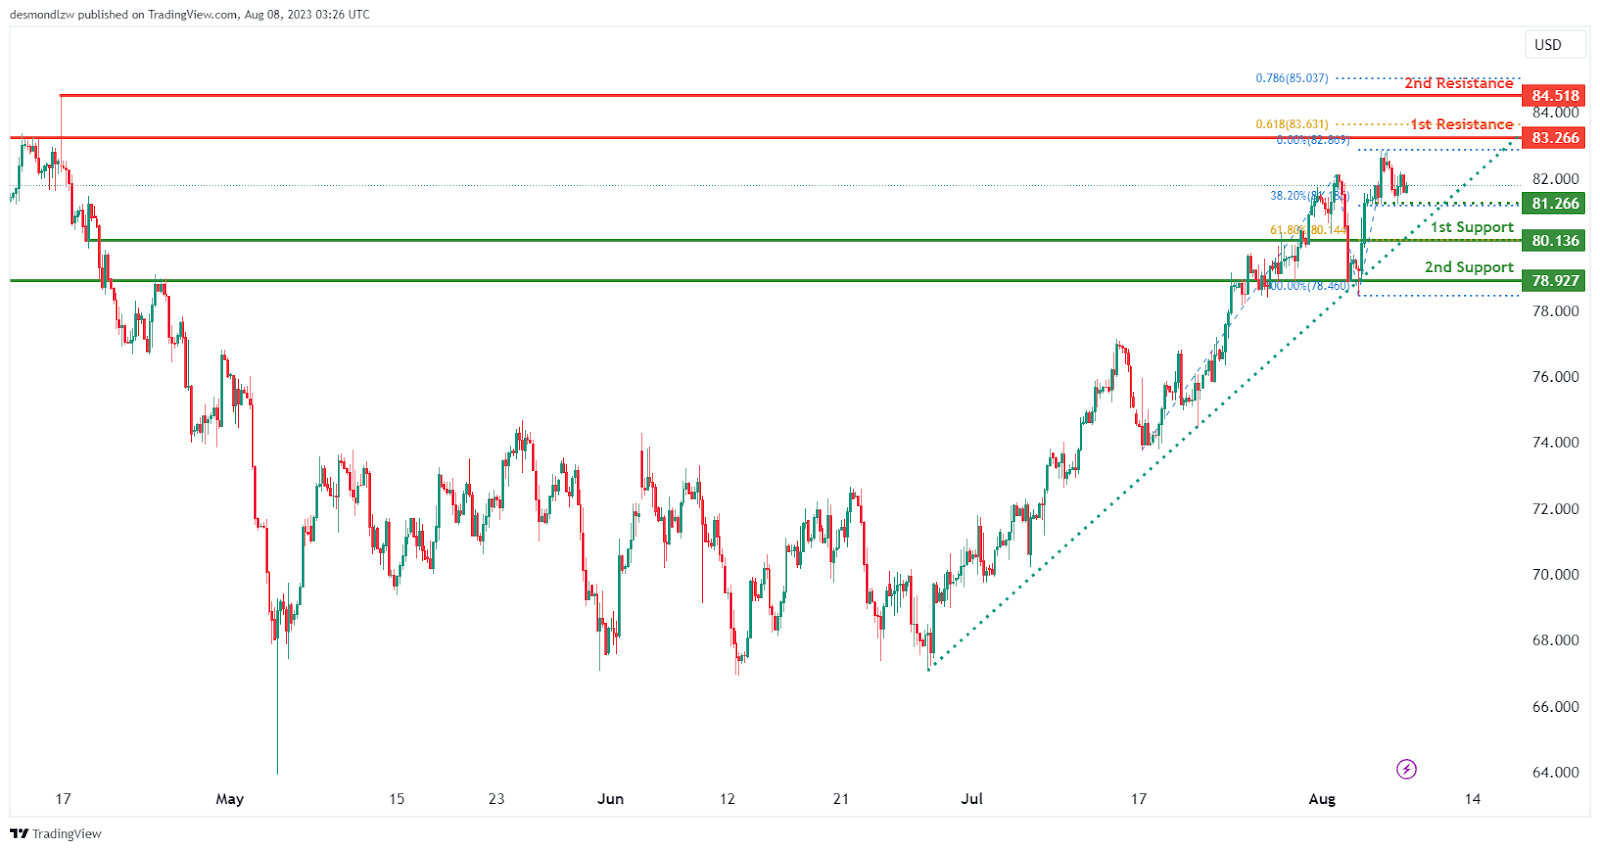
WTI/USD:
The WTI Crude Oil (West Texas Intermediate) is currently demonstrating a bullish momentum. One of the significant indicators reinforcing this momentum is that price is trading above a major ascending trend line, suggesting that further bullish moves could be expected in the future.
The 1st support level is at 80.14 which represents an overlap support that corresponds to the 61.80% Fibonacci retracement level. Further below, the 2nd support is found at 78.93 which represents as overlap support and could act as a potential floor if prices were to decline to this level.
In addition, there is an intermediate support at 81.27 which represents a pullback support level that corresponds to the 38.20% Fibonacci retracement level. This level may provide a temporary floor or reversal zone for any short-term price pullbacks.
To the upside, the 1st resistance level is situated at 83.27 which represents an overlap resistance level that corresponds close to the 61.80% Fibonacci projection level. This is an area which could potentially halt the bullish momentum temporarily.
Beyond this, the 2nd resistance is located at 84.52 which represents a swing-high resistance level that corresponds close to the 78.60% Fibonacci projection level. This level might present a considerable hurdle for further price gains.
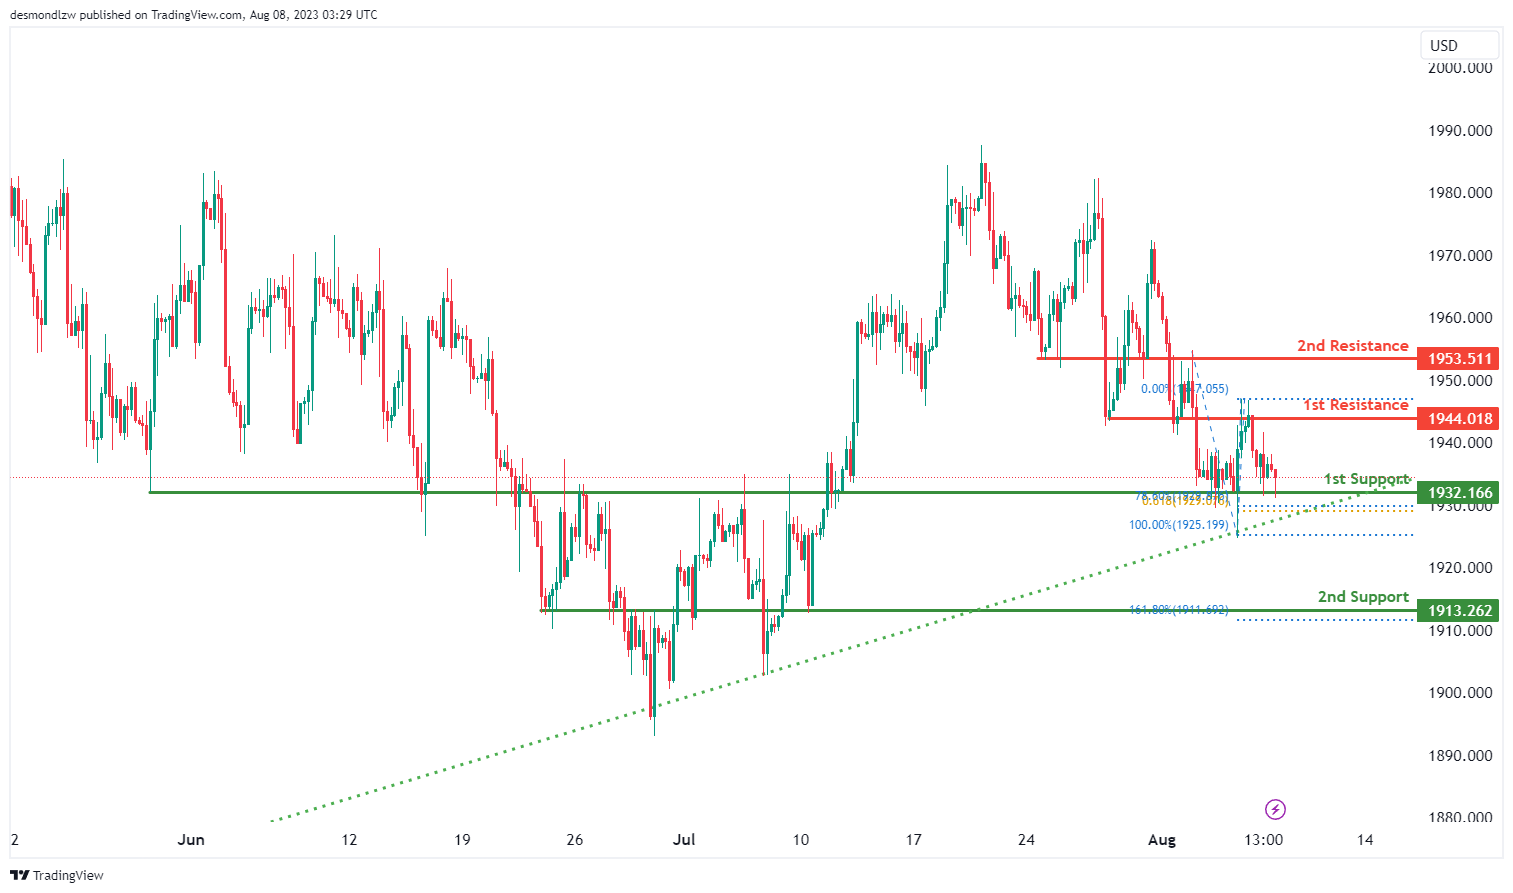
XAU/USD (GOLD):
The XAU/USD chart is currently showing a bullish overall momentum, indicating a strong upward trend in the market.
This bullish sentiment is supported by the fact that the price is above a major ascending trend line, suggesting the potential for further bullish momentum in the future.
Given this bullish trend, the price of XAU/USD may potentially experience a bullish bounce off the 1st support level and continue its upward movement towards the 1st resistance level.
The 1st support level is located at 1932.16 and is considered an overlap support. This level gains significance from its alignment with a 61.80% Fibonacci projection and a 78.60% Fibonacci retracement, indicating Fibonacci confluence. This combination of Fibonacci levels adds strength to the support level, making it a crucial area for potential buying interest.
In addition to the 1st support, there is a 2nd support level at 1913.26, also identified as an overlap support, providing additional potential support during price declines.
On the other hand, the 1st resistance level stands at 1944.08, noted as an overlap resistance. This level could act as a significant barrier to any further upward movement in the price.
Furthermore, there is a 2nd resistance level at 1953.51, identified as an overlap resistance, which may exert further resistance pressure on the price.
The accuracy, completeness and timeliness of the information contained on this site cannot be guaranteed. IC Markets does not warranty, guarantee or make any representations, or assume any liability regarding financial results based on the use of the information in the site.
News, views, opinions, recommendations and other information obtained from sources outside of www.icmarkets.com, used in this site are believed to be reliable, but we cannot guarantee their accuracy or completeness. All such information is subject to change at any time without notice. IC Markets assumes no responsibility for the content of any linked site.
The fact that such links may exist does not indicate approval or endorsement of any material contained on any linked site. IC Markets is not liable for any harm caused by the transmission, through accessing the services or information on this site, of a computer virus, or other computer code or programming device that might be used to access, delete, damage, disable, disrupt or otherwise impede in any manner, the operation of the site or of any user’s software, hardware, data or property.


