
DXY:
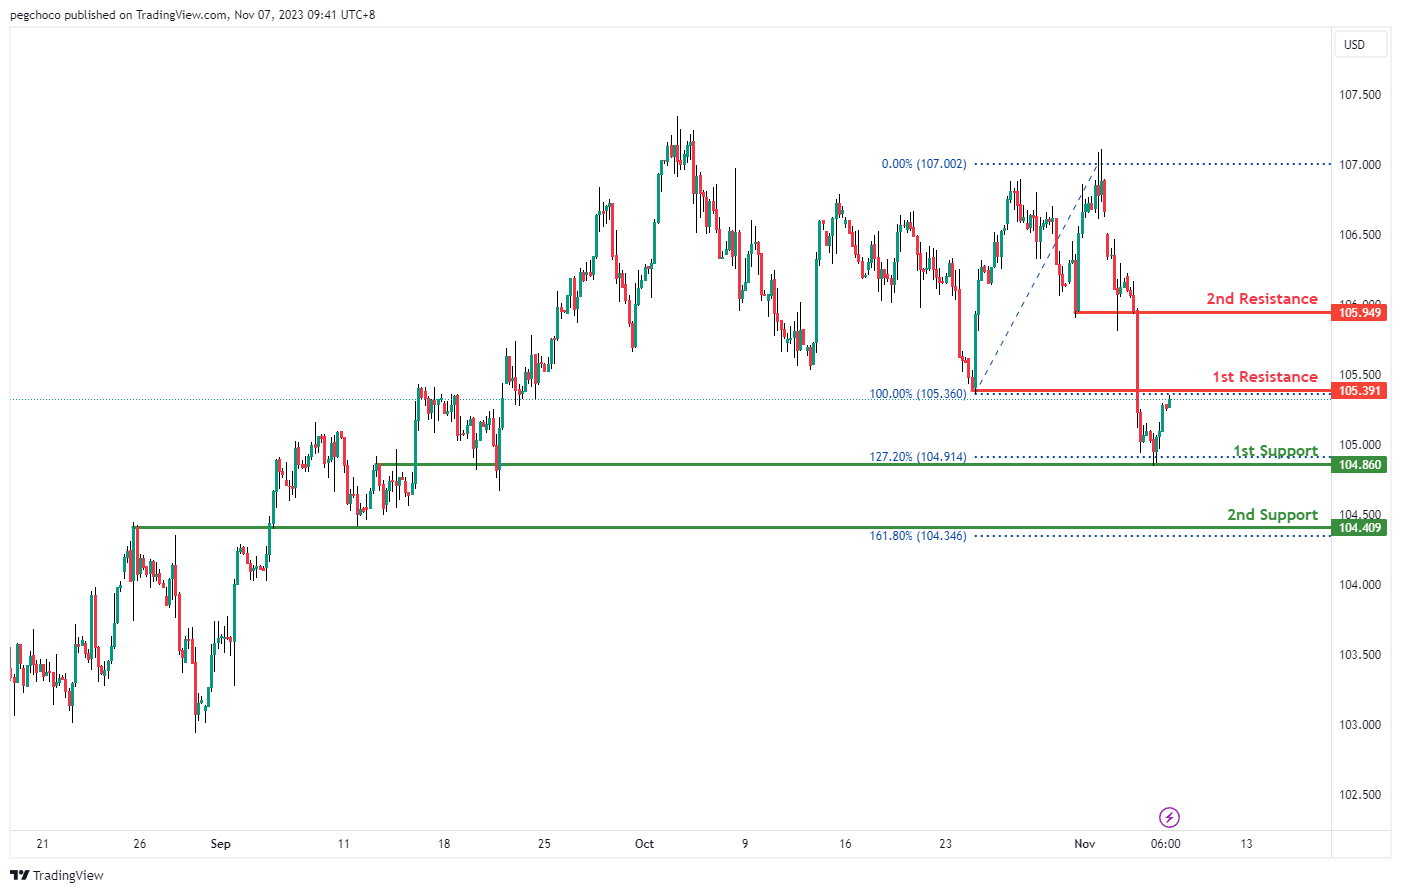
The DXY (US Dollar Index) chart currently has a bearish overall momentum, suggesting the potential for a bearish reaction off the 1st resistance and a drop towards the 1st support.
The 1st support at 104.86 is identified as an overlap support, and it also aligns with the 127.20% Fibonacci Extension level, indicating it could be a significant level where the price might find some buying interest.
The 2nd support at 104.40 is considered an overlap support as well, and it coincides with the 161.80% Fibonacci Extension level, further reinforcing its potential as a support level.
On the resistance side, the 1st resistance at 105.39 is categorized as a pullback resistance, suggesting it could act as a level where the price may face selling pressure.
The 2nd resistance at 105.94 is also identified as a pullback resistance, indicating another potential level where the price may encounter obstacles in its upward movement.
EUR/USD:
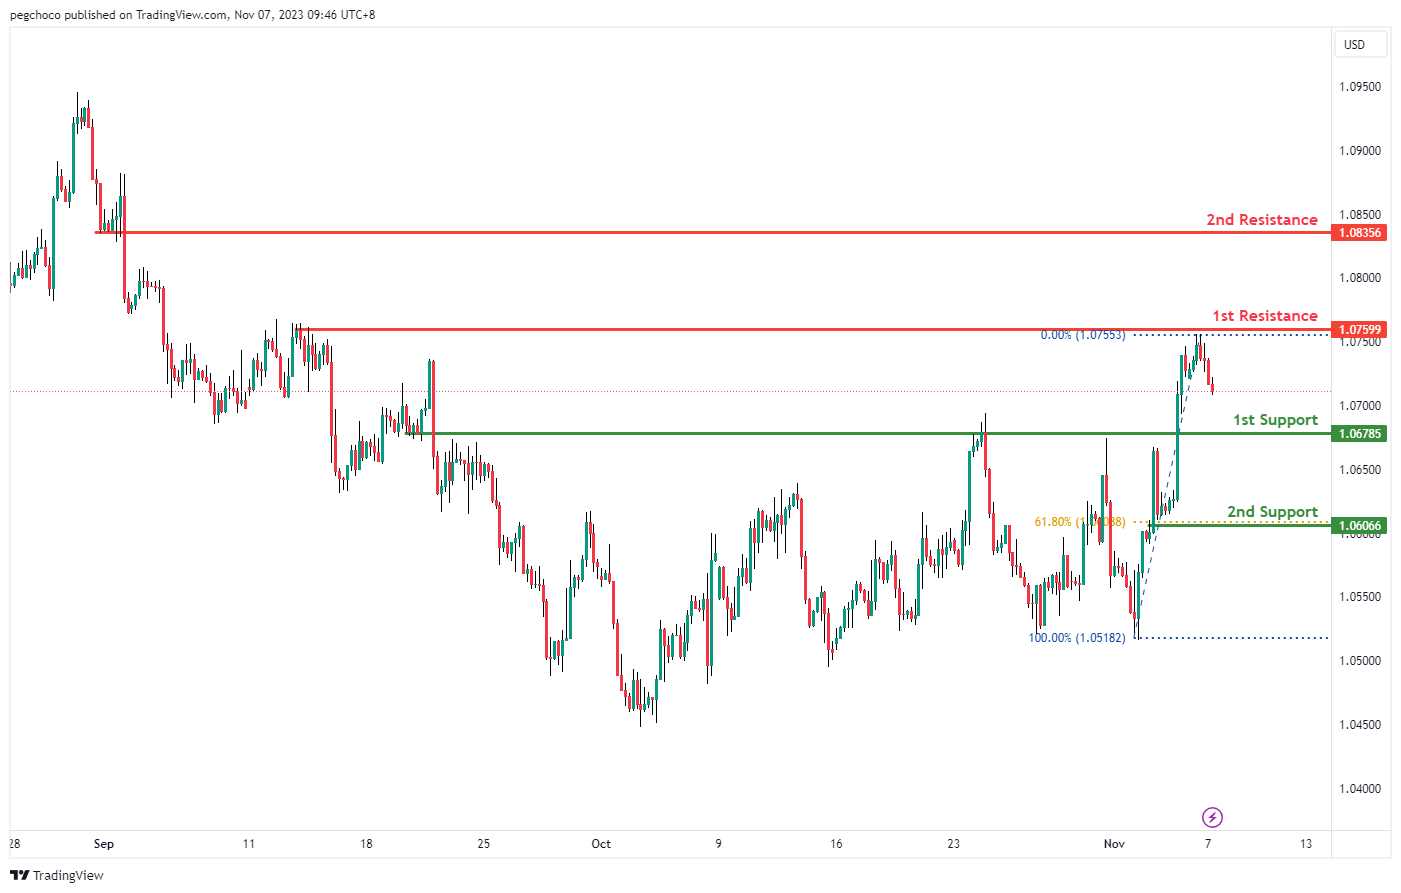
The EUR/USD chart currently has a bearish overall momentum, suggesting the potential for a bearish continuation towards the 1st support.
The 1st support at 1.0678 is identified as a pullback support, indicating it could be a significant level where the price might find some buying interest.
The 2nd support at 1.0606 is also considered a support level, and it coincides with the 61.80% Fibonacci Retracement level, further reinforcing its potential as a support zone.
On the resistance side, the 1st resistance at 1.0759 is categorized as a multi-swing high resistance, suggesting it could act as a level where the price may face selling pressure.
The 2nd resistance at 1.0835 is identified as a pullback resistance, indicating another potential level where the price may encounter obstacles in its upward movement.
EUR/JPY:
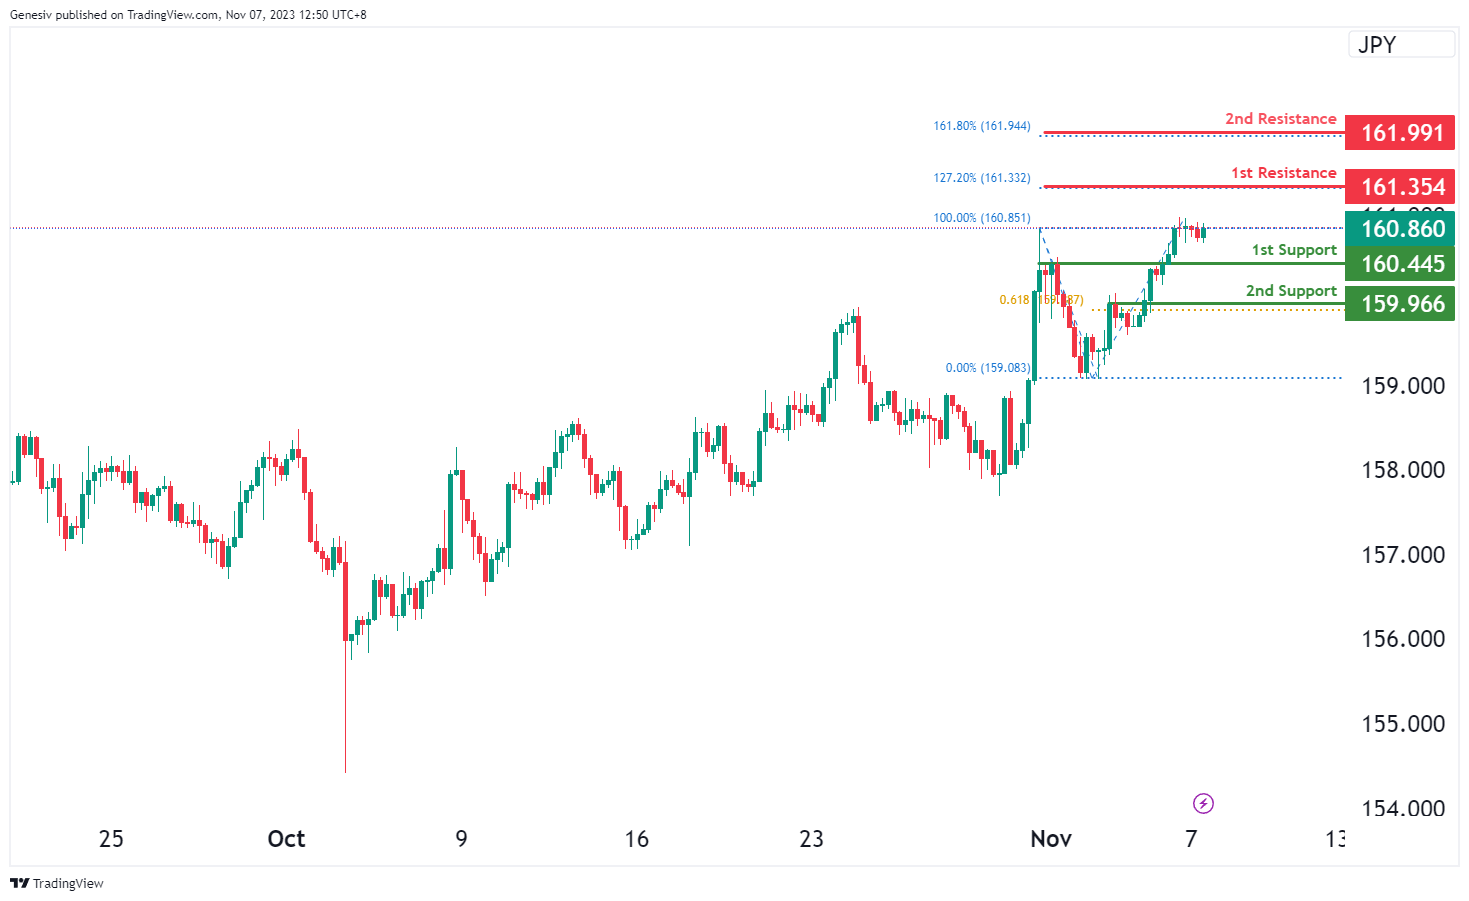
For EUR/JPY, with a current bearish momentum, there’s a potential scenario of a short-term rise towards the first resistance, followed by a reversal and potential drop towards the first support.
The first support at 160.45 is recognized as a level of pullback support, indicating a point where the price might find support during a potential retracement in the bearish trend.
The second support at 159.96 is also identified as pullback support and coincides with the 61.80% Fibonacci Projection, suggesting it as an additional level of potential support.
On the resistance side, the first resistance at 161.35 is associated with the 127.20% Fibonacci Extension, indicating a significant level that might act as a barrier to the price’s upward movement in the short term within the current bearish context.
Moreover, the second resistance at 161.99 aligns with the 161.80% Fibonacci Extension, suggesting it as another significant level that could potentially hinder the price’s upward movement within the prevailing bearish trend.
EUR/GBP:
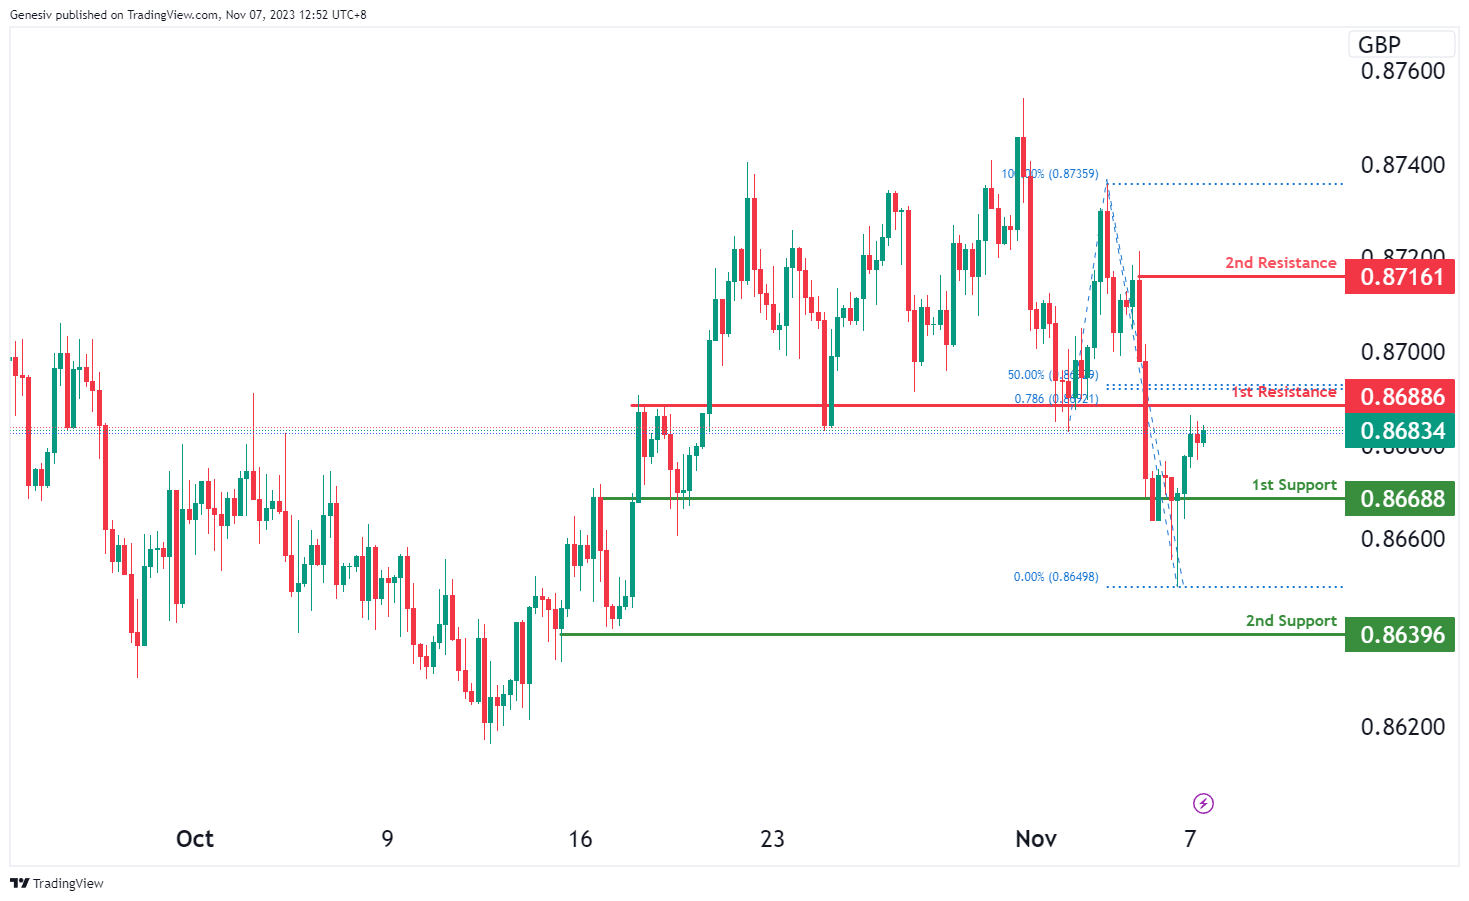
For EUR/GBP, with the chart’s current bearish momentum, there’s a potential scenario where the price might rise towards the first resistance in the short term, followed by a reversal and a potential drop towards the first support.
The first support at 0.8668 is identified as a level of pullback support, suggesting a point where the price might find support during a potential retracement in the bearish trend.
The second support at 0.8639 is recognized as multi-swing low support, indicating an additional level that might offer support during the bearish trend.
On the resistance side, the first resistance at 0.8688 is characterized as pullback resistance, aligning with both the 50% Fibonacci Retracement and the 78.60% Fibonacci Projection. This indicates a confluence of Fibonacci levels, making it a significant barrier to the price’s upward movement in the short term within the prevailing bearish context.
Furthermore, the second resistance at 0.8716 is identified as a swing high resistance, suggesting it as an additional level that could impede the price’s upward movement within the current bearish trend.
.
GBP/USD:
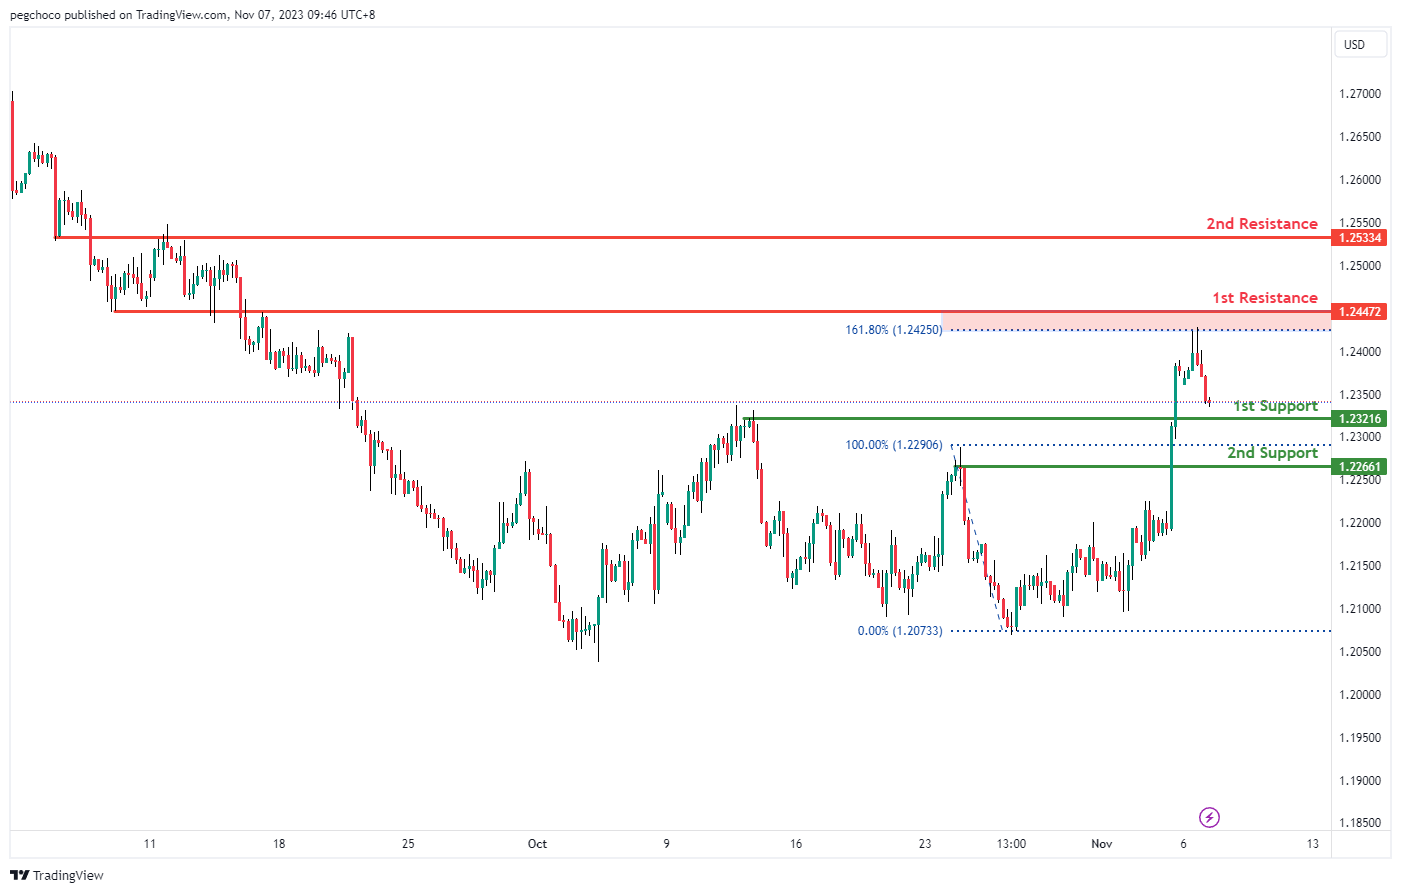
The GBP/USD chart currently has a bearish overall momentum, suggesting the potential for a bearish continuation towards the 1st support.
The 1st support at 1.2321 is identified as a pullback support, indicating it could be a significant level where the price might find some buying interest.
The 2nd support at 1.2266 is also considered a pullback support, adding to the potential support zone.
On the resistance side, the 1st resistance at 1.2447 is categorized as an overlap resistance, and it coincides with the 161.80% Fibonacci Extension level, suggesting it could act as a level where the price may face selling pressure.
The 2nd resistance at 1.2533 is also identified as an overlap resistance, further reinforcing its potential as a resistance level.
GBP/JPY:
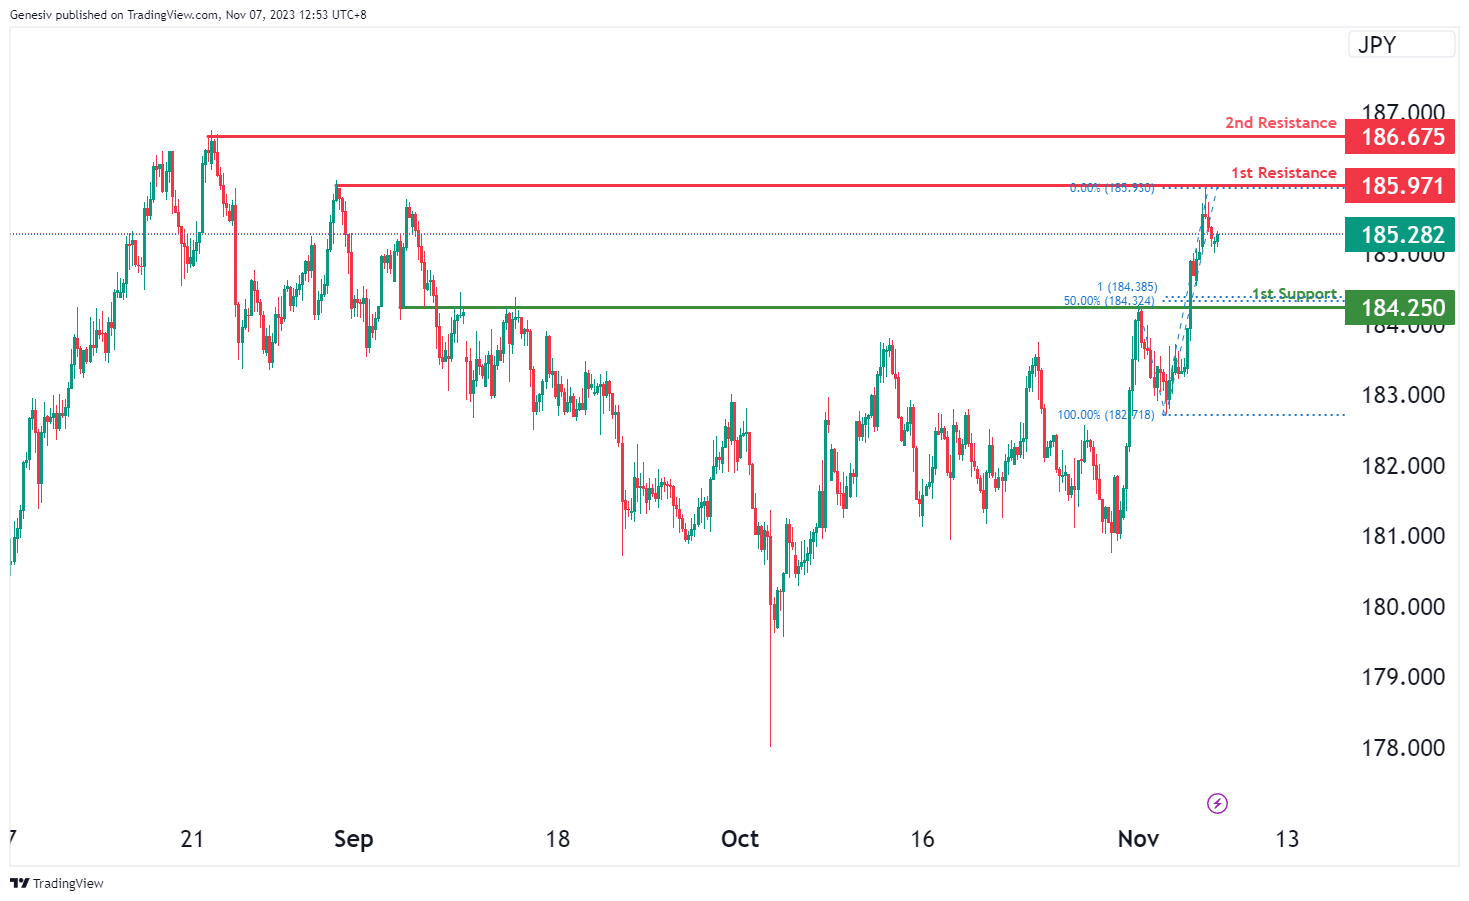
For GBP/JPY, with the prevailing bearish momentum, there’s a potential scenario for a bearish continuation towards the first support.
The first support at 184.25 is identified as a level of pullback support and aligns with both the 50% Fibonacci Retracement and the 100% Fibonacci Projection, indicating a confluence of Fibonacci levels. This signifies it as a crucial area where the price might find substantial support during the bearish movement.
On the resistance side, the first resistance at 185.97 is characterized as multi-swing high resistance, indicating a significant barrier to the price’s downward movement within the current bearish scenario.
Additionally, the second resistance at 186.67 is recognized as a swing high resistance, suggesting it as an additional significant obstacle to the price’s downward movement within the prevailing bearish trend.
USD/CHF:
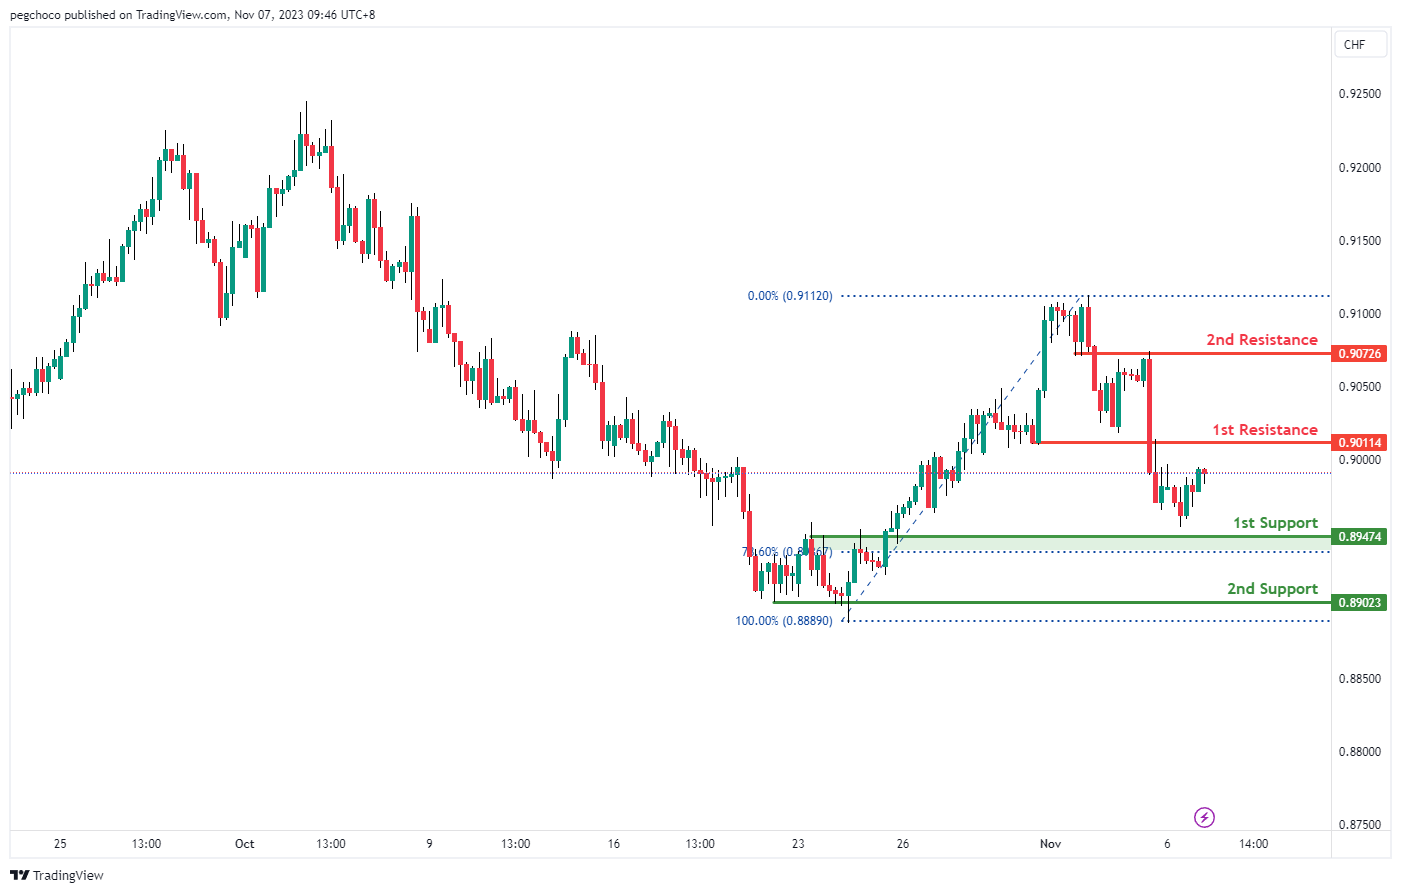
The USD/CHF chart currently has a bullish overall momentum, suggesting the potential for a bullish continuation towards the 1st resistance.
The 1st support at 0.8947 is identified as an overlap support, and it coincides with the 78.60% Fibonacci Retracement level, indicating it could be a significant level where the price might find buying interest.
The 2nd support at 0.8902 is categorized as a multi-swing low support, further reinforcing its potential as a support level.
On the resistance side, the 1st resistance at 0.9011 is also identified as an overlap resistance, and it marks a potential level where the price may face selling pressure.
The 2nd resistance at 0.9072 is categorized as another overlap resistance, adding to the potential resistance zone.
.
USD/JPY:
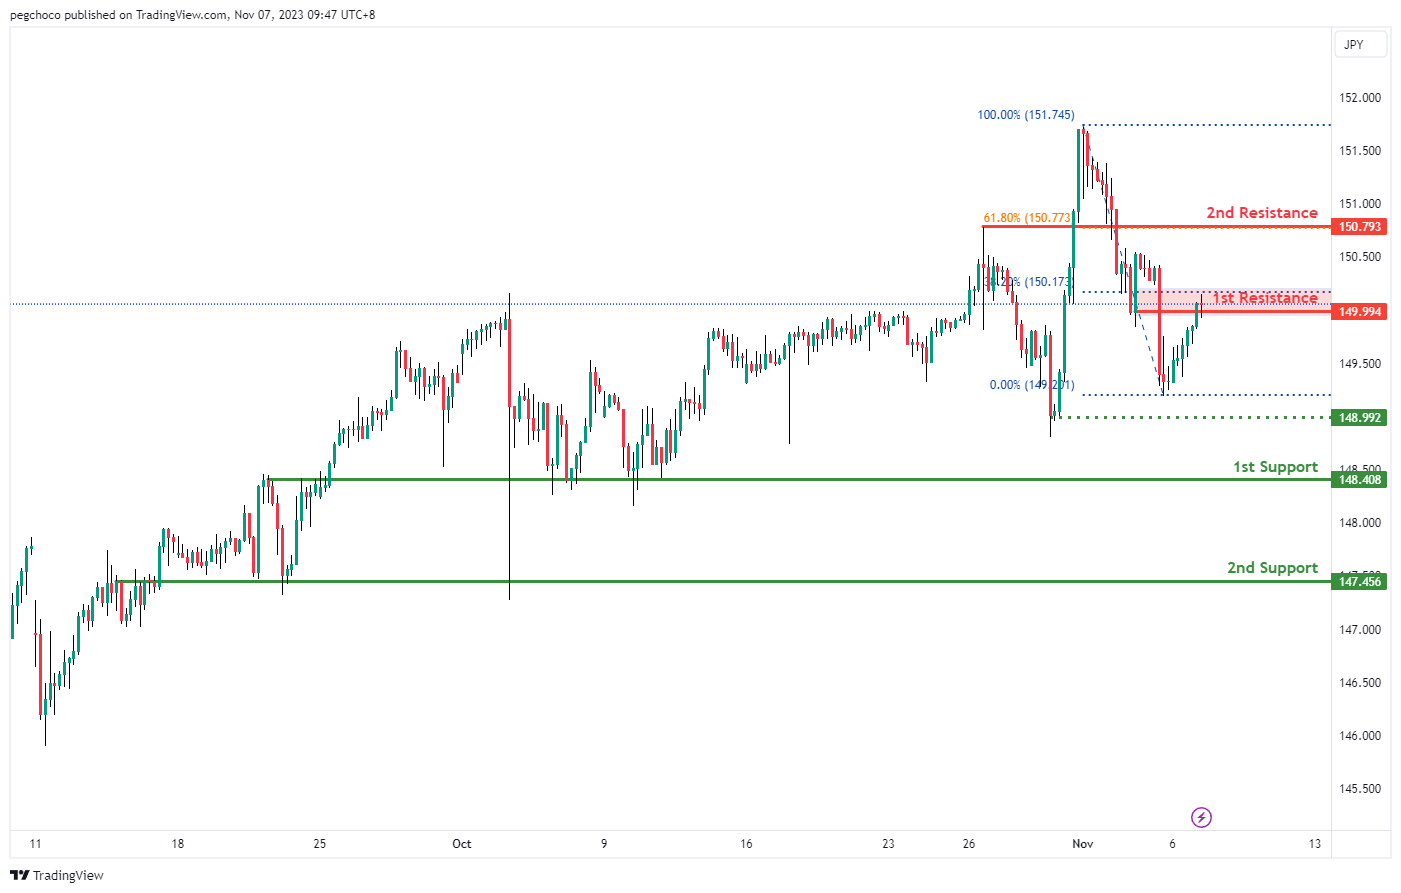
The USD/JPY chart currently has a bearish overall momentum, suggesting the potential for a bearish reaction off the 1st resistance level and a drop towards the 1st support level.
The 1st support at 148.40 is identified as an overlap support, indicating it could be a significant level where the price might find some buying interest.
The 2nd support at 147.45 is also considered an overlap support, further reinforcing its potential as a support level.
On the resistance side, the 1st resistance at 149.99 is categorized as a pullback resistance, suggesting it could act as a level where the price may face selling pressure.
The 2nd resistance at 150.79 is identified as a pullback resistance and coincides with the 61.80% Fibonacci Retracement level, indicating it could be a strong resistance level where the price may encounter obstacles in its upward movement.
Intermediate support at 148.99 is noted as a swing low support, adding another potential support level to watch for price movements.
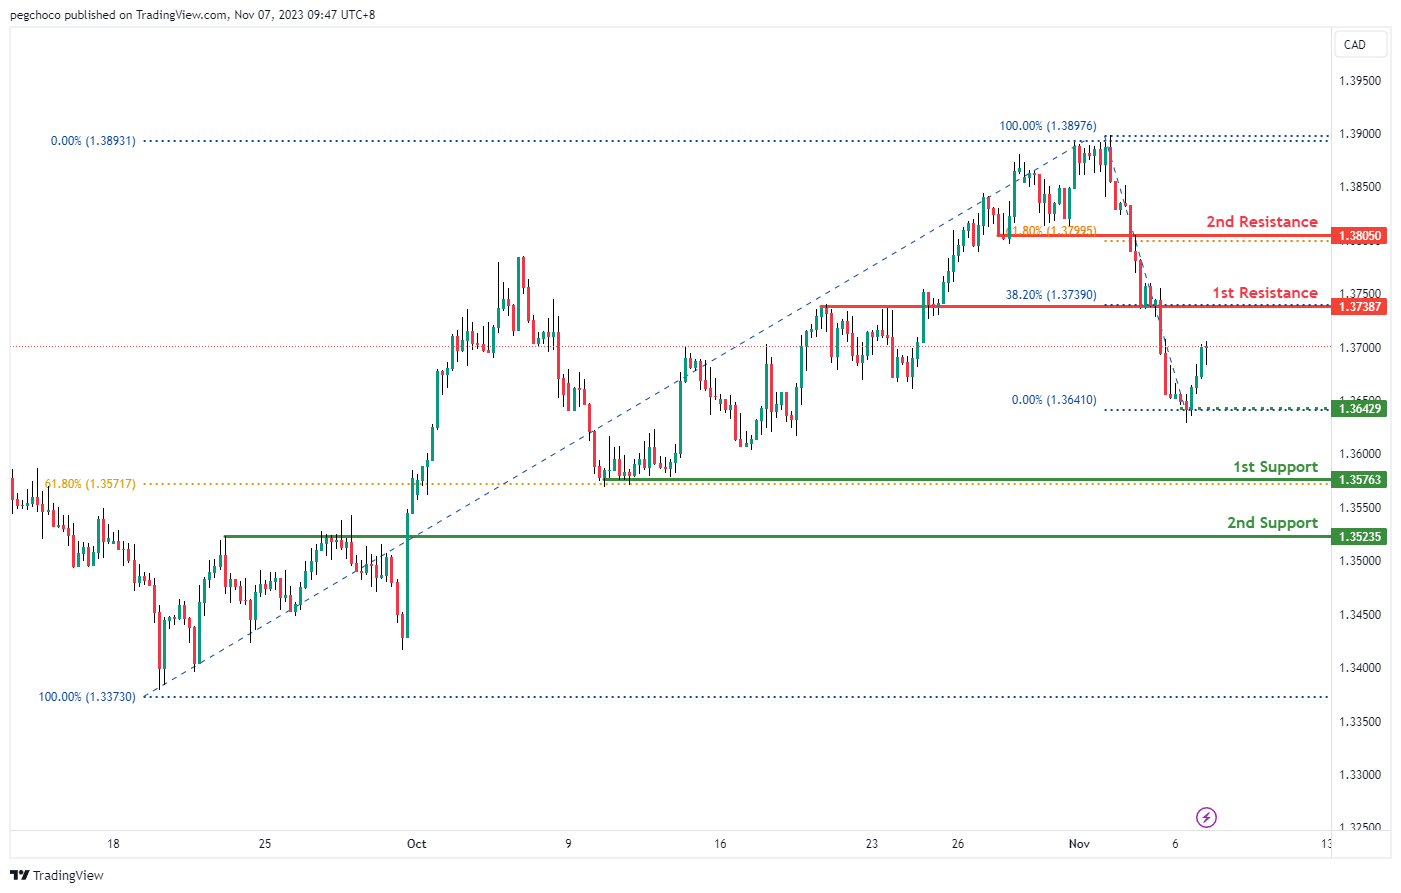
USD/CAD:
The USD/CAD chart is currently exhibiting a bearish overall momentum, indicating the potential for a bearish reaction off the 1st resistance level and a subsequent drop towards the 1st support level.
The 1st support level at 1.3576 is considered a significant level as it is a multi-swing low support and is further reinforced by the presence of the 61.80% Fibonacci Retracement, suggesting that it may act as a strong support zone where buyers could become active.
In addition, the 2nd support level at 1.3523 is categorized as a pullback support, adding to its potential as a level where the price could find support and reverse its downward movement.
On the resistance side, the 1st resistance level at 1.3738 is identified as a pullback resistance, indicating it could serve as a level where the price encounters selling pressure and potentially reverses.
Furthermore, the 2nd resistance level at 1.3805 is also considered a pullback resistance, reinforced by the presence of the 61.80% Fibonacci Retracement, suggesting that it may act as a strong resistance zone.
Intermediate support at 1.3642 is noted as a swing low support, providing an additional support level to watch.
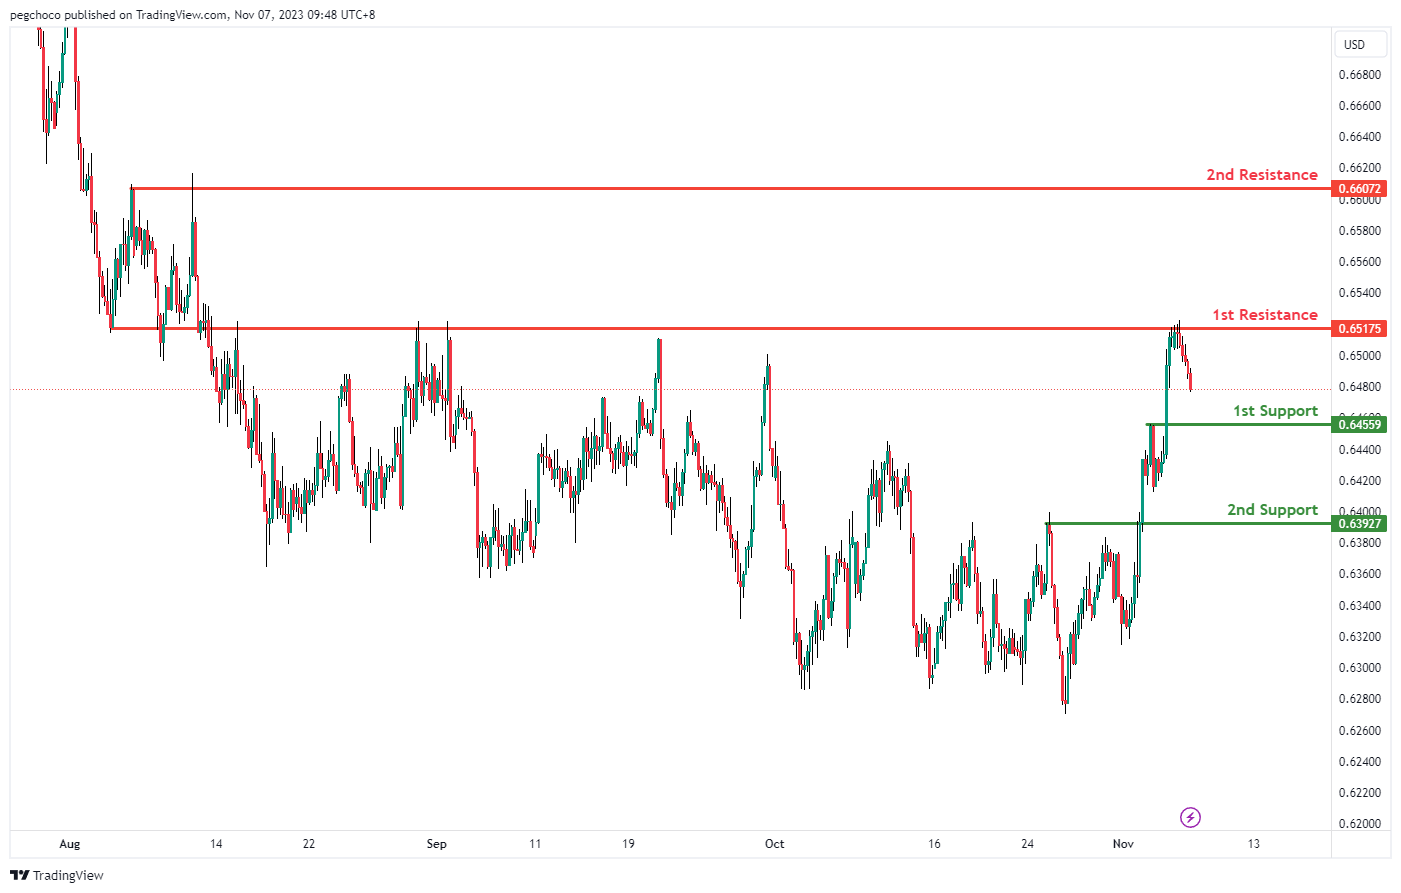
AUD/USD:
The AUD/USD chart is currently characterized by a bearish overall momentum, indicating the potential for a bearish continuation towards the 1st support level.
The 1st support level at 0.6455 is identified as a pullback support, suggesting it could be a significant level where the price might find buying interest and potentially reverse its downward movement.
Additionally, the 2nd support level at 0.6392 is also categorized as a pullback support, reinforcing its potential as a level of support for the price.
On the resistance side, the 1st resistance level at 0.6517 is considered an overlap resistance, implying that it could act as a level where the price encounters selling pressure.
Furthermore, the 2nd resistance level at 0.6607 is categorized as a swing high resistance, indicating another potential obstacle for the price’s upward movement.
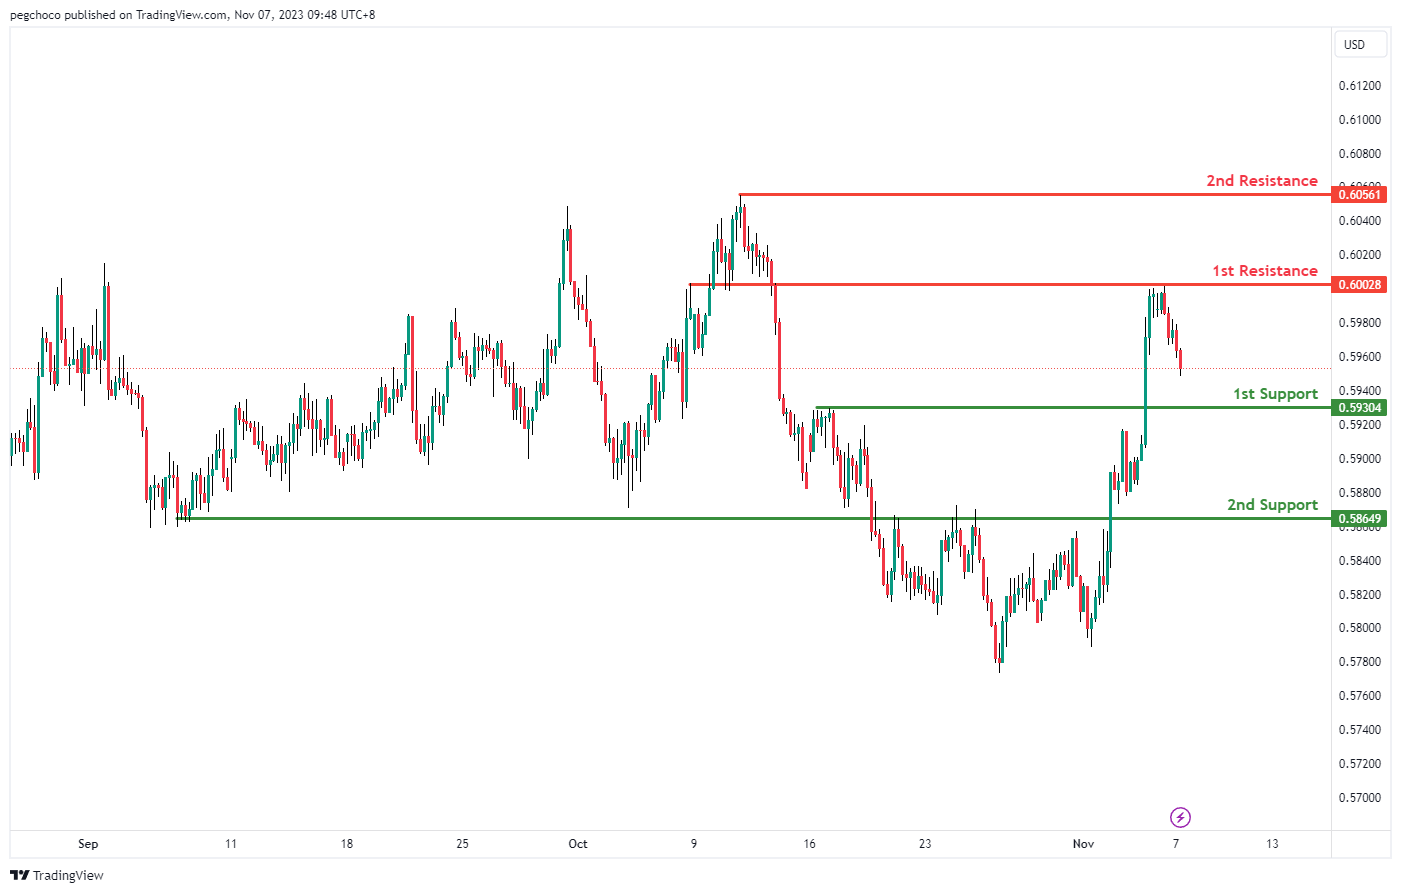
NZD/USD
The NZD/USD chart currently exhibits a bearish overall momentum, suggesting the potential for a bearish continuation towards the 1st support level.
The 1st support level at 0.5930 is identified as a pullback support, indicating it could serve as a significant level where the price may find buying interest and potentially reverse its downward movement.
Further down, the 2nd support at 0.5864 is also categorized as a pullback support, reinforcing its potential significance as a level of support.
On the resistance side, the 1st resistance at 0.6002 is considered an overlap resistance, suggesting that it could act as a level where the price encounters selling pressure.
Similarly, the 2nd resistance at 0.6056 is categorized as a swing high resistance, indicating another potential level where the price may face obstacles in its upward movement.
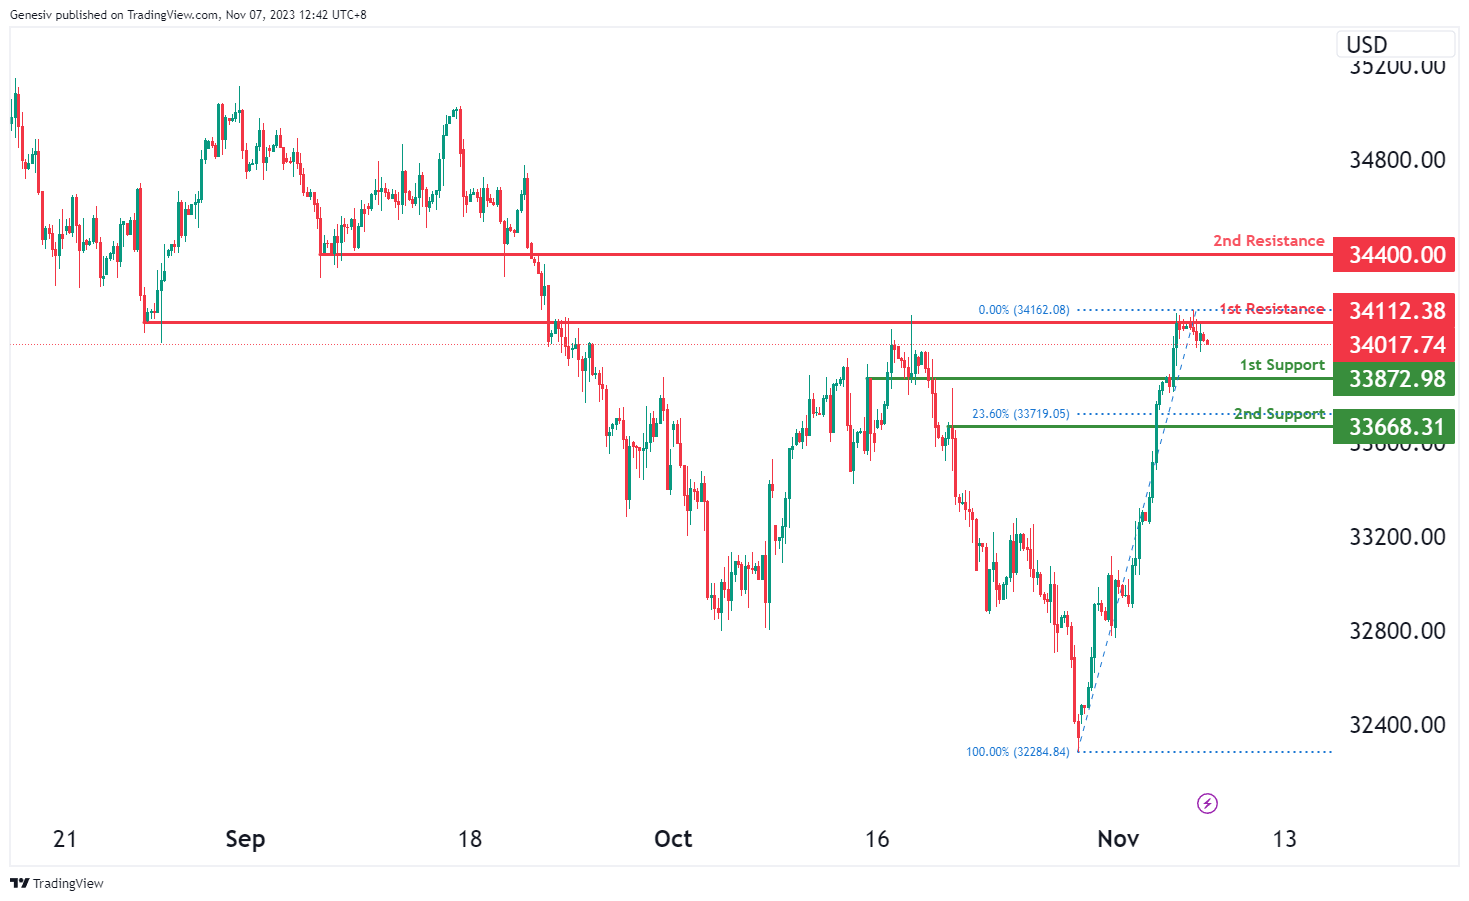
DJ30:
For DJ30, the chart is currently reflecting a bearish momentum, suggesting a potential scenario for a bearish continuation towards the first support level.
The first support at 33872.98 is identified as a level of pullback support, indicating a significant area where the price might find support during its potential downward movement in the bearish trend.
The second support at 33668.31 is also recognized as pullback support, providing an additional level that might offer support during the bearish trend.
On the resistance side, the first resistance at 34112.38 is characterized as an overlap resistance, signifying a significant barrier to the price’s downward movement within the current bearish scenario.
Furthermore, the second resistance at 34400.00 is identified as pullback resistance, suggesting it could act as another substantial barrier to the price’s downward movement within the prevailing bearish trend.
GER40:
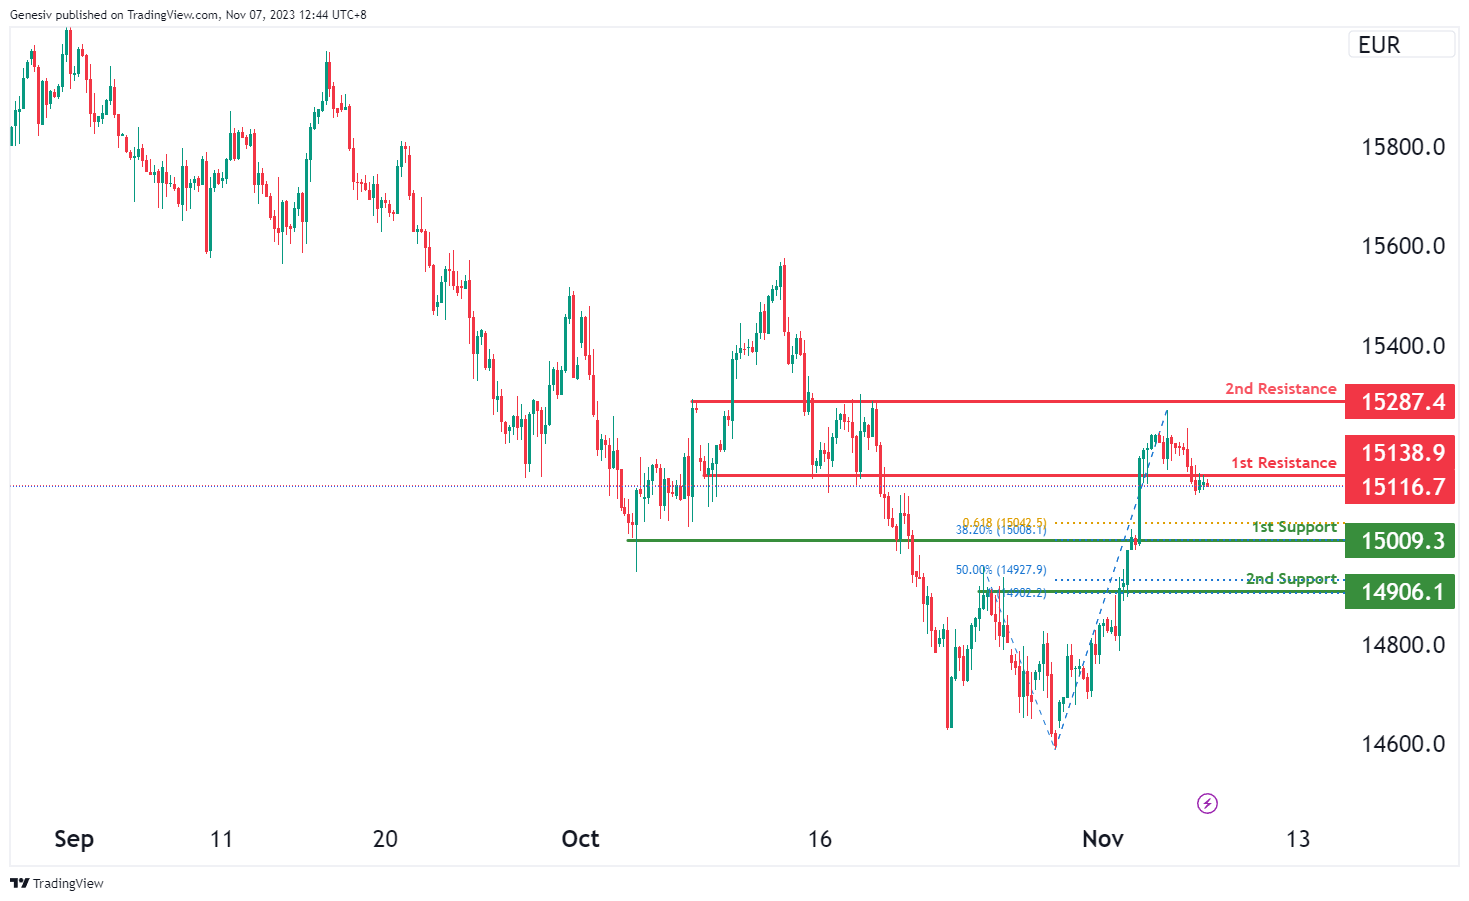
For GER40, the current momentum of the chart indicates a bearish trend, suggesting a potential scenario for a bearish reaction off the first resistance, potentially leading to a drop towards the first support.
The first support at 15009.30 is identified as a level of pullback support, signifying a crucial area where the price might find support during a potential downward movement. This level aligns with both the 38.20% Fibonacci Retracement and the 61.80% Fibonacci Projection, indicating a confluence of Fibonacci levels, making it a significant support zone.
The second support at 14906.10 is also recognized as pullback support and aligns with the 50% Fibonacci Retracement and the 100% Fibonacci Projection, indicating another zone of Fibonacci confluence, making it another crucial area of potential support during a bearish movement.
On the resistance side, the first resistance at 15138.90 is characterized as an overlap resistance, representing a significant barrier to the price’s upward movement within the current bearish scenario.
Additionally, the second resistance at 15287.40 is also identified as an overlap resistance, suggesting it as another considerable obstacle to the price’s upward movement within the prevailing bearish trend.
`US500
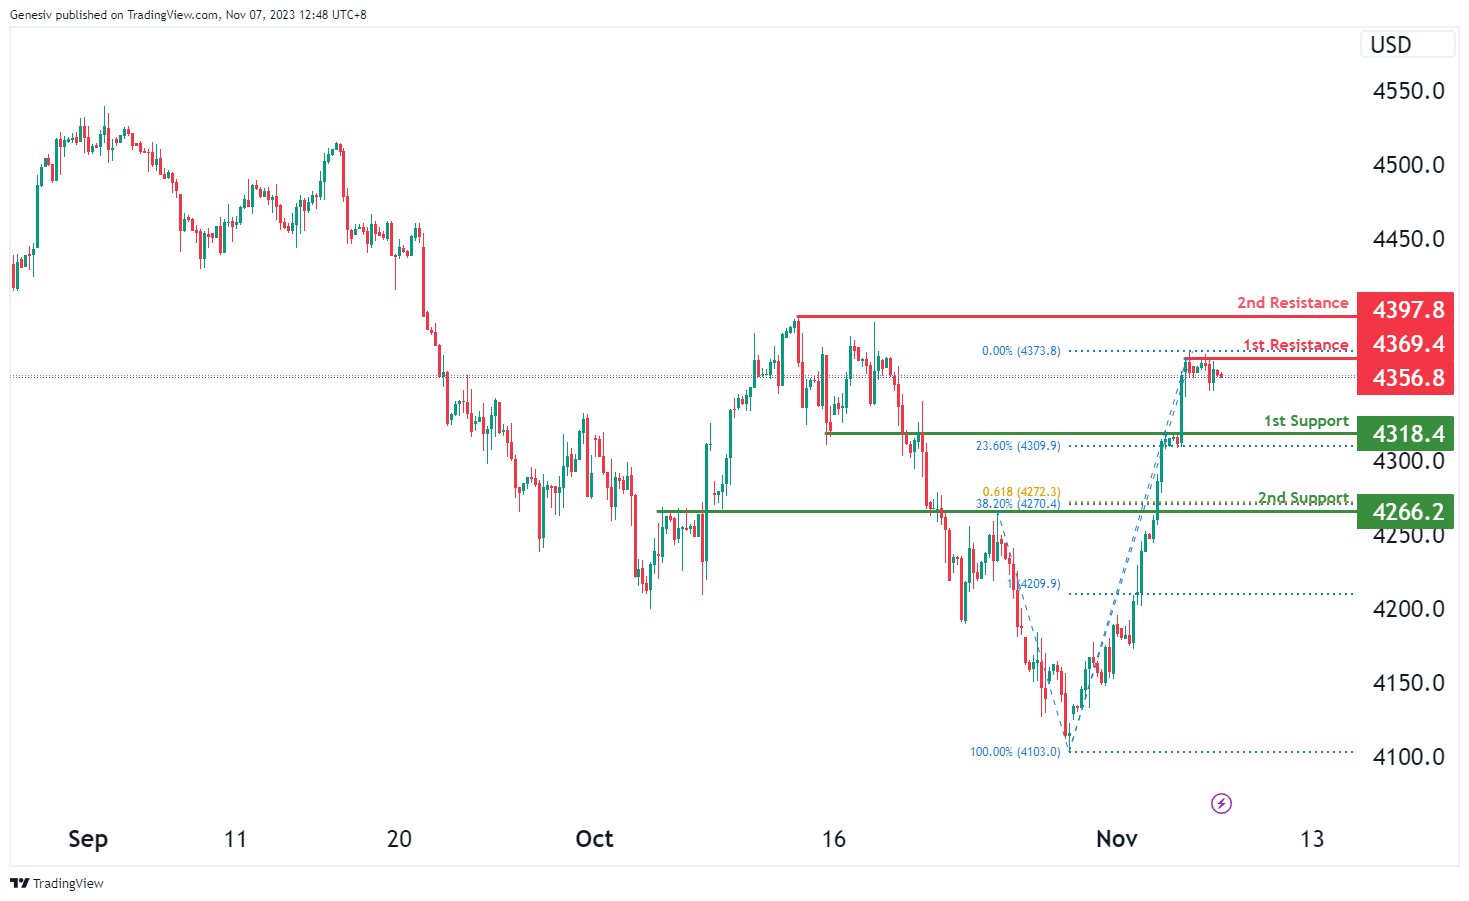
For US500, the current chart momentum indicates a bearish trend, suggesting a potential scenario for a bearish continuation towards the first support level.
The first support at 4318.4 is identified as a pullback support and coincides with the 23.60% Fibonacci Retracement, marking a significant level where the price might find support during its potential downward movement.
The second support at 4266.2 is also recognized as pullback support, aligning with both the 38.20% Fibonacci Retracement and the 61.80% Fibonacci Projection, indicating a confluence of Fibonacci levels. This signifies it as a crucial level of potential support during a bearish movement.
On the resistance side, the first resistance at 4369.4 is characterized as multi-swing high resistance, representing a significant barrier to the price’s upward movement within the current bearish scenario.
Additionally, the second resistance at 4397.8 is also identified as multi-swing high resistance, suggesting it as another considerable obstacle to the price’s upward movement within the prevailing bearish trend.
BTC/USD:
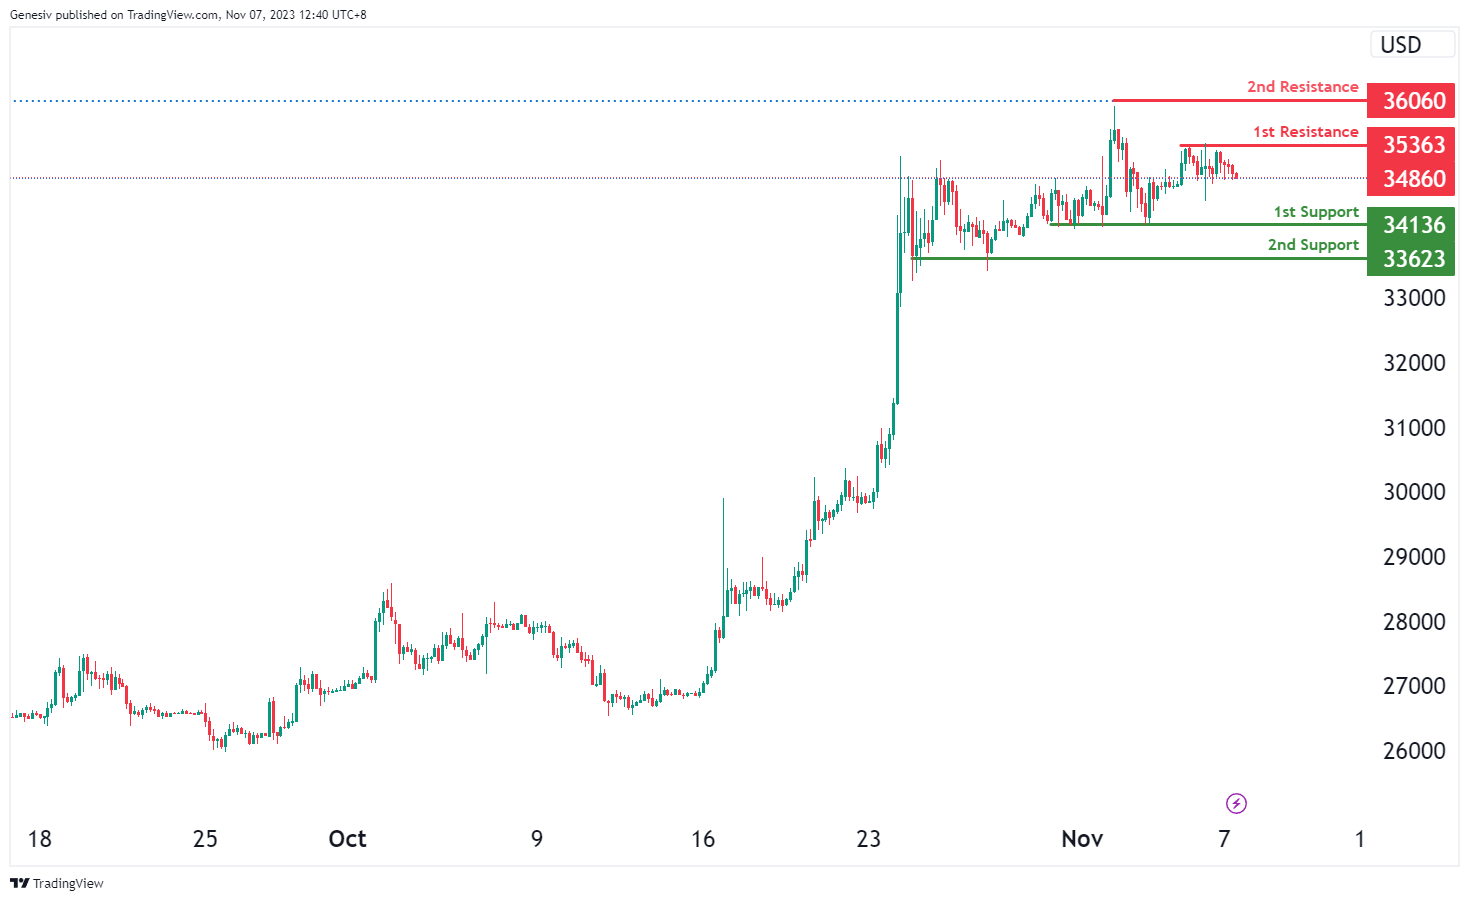
For BTC/USD, the current chart reflects a neutral momentum, suggesting a potential scenario for price fluctuation between the first resistance and the first support levels.
The first support at 34136 is attributed to multi-swing low support, indicating a level where the price might find support during any potential decline.
The second support at 33623 is also identified as multi-swing low support, offering an additional level that might provide support in case the price experiences a decline.
On the resistance side, the first resistance at 35363 is characterized as multi-swing high resistance, representing a significant barrier to the price’s upward movement in the neutral scenario.
Additionally, the second resistance at 36060 is recognized as swing high resistance, suggesting it could pose another substantial barrier to the price’s upward movement within the prevailing neutral trend.
ETH/USD:
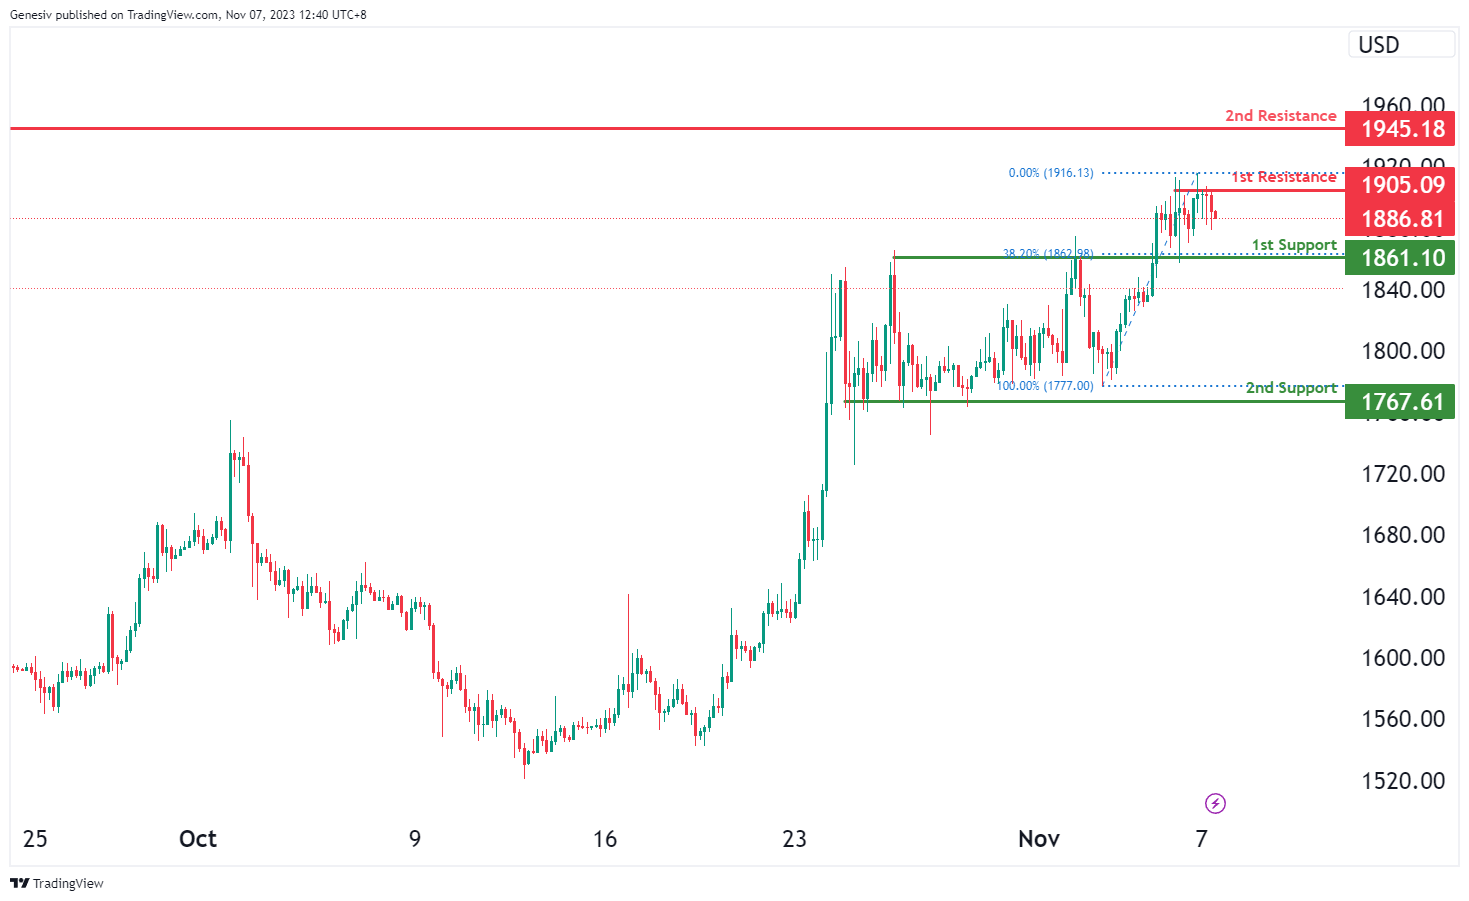
For ETH/USD, the current chart shows a neutral momentum, indicating a potential scenario where the price could fluctuate between the first resistance and the first support levels.
The first support at 1861.10 is identified as an overlap support, suggesting a level where the price might find support during any potential decline.
The second support at 1767.61 is recognized as multi-swing low support, providing an additional level that might offer substantial support in case of a price decline.
On the resistance side, the first resistance at 1905.09 is characterized as multi-swing high resistance, representing a significant barrier to the price’s upward movement in the neutral scenario.
Moreover, the second resistance at 1945.18 is also identified as multi-swing high resistance, further suggesting it as a substantial barrier to the price’s upward movement within the prevailing neutral trend.
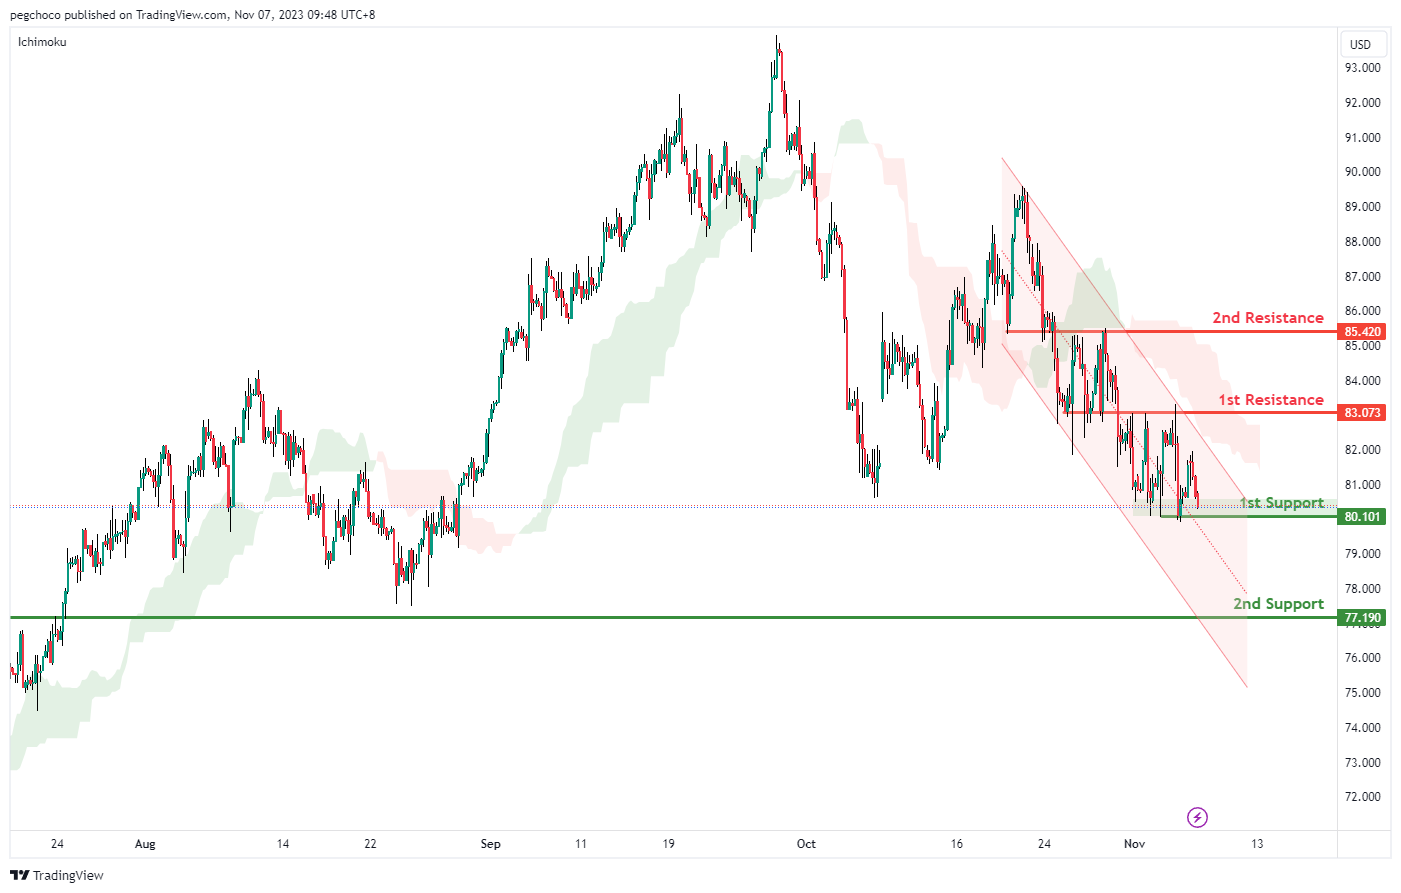
WTI/USD:
The WTI (West Texas Intermediate) chart currently demonstrates a bearish overall momentum, primarily influenced by two key factors. First, the price is within a bearish descending channel, indicating a consistent pattern of lower highs and lower lows. Second, the price is positioned below the bearish Ichimoku cloud, which typically suggests a bearish sentiment and reinforces the downward momentum.
Given this prevailing bearish sentiment, there is a potential scenario where the price breaks bearishly below the 1st support and continues to decline towards the 2nd support level.
The 1st support level at 80.10 holds significance as it represents a multi-swing low support, implying that it could attract buying interest and potentially act as a price reversal point.
Further down, the 2nd support at 77.19 is identified as an overlap support, further emphasizing its role as a substantial level of potential support.
On the resistance side, the 1st resistance at 83.07 is categorized as an overlap resistance, signifying a level where selling pressure may emerge.
Similarly, the 2nd resistance at 85.42 is also considered an overlap resistance, indicating another potential area where price could face resistance.
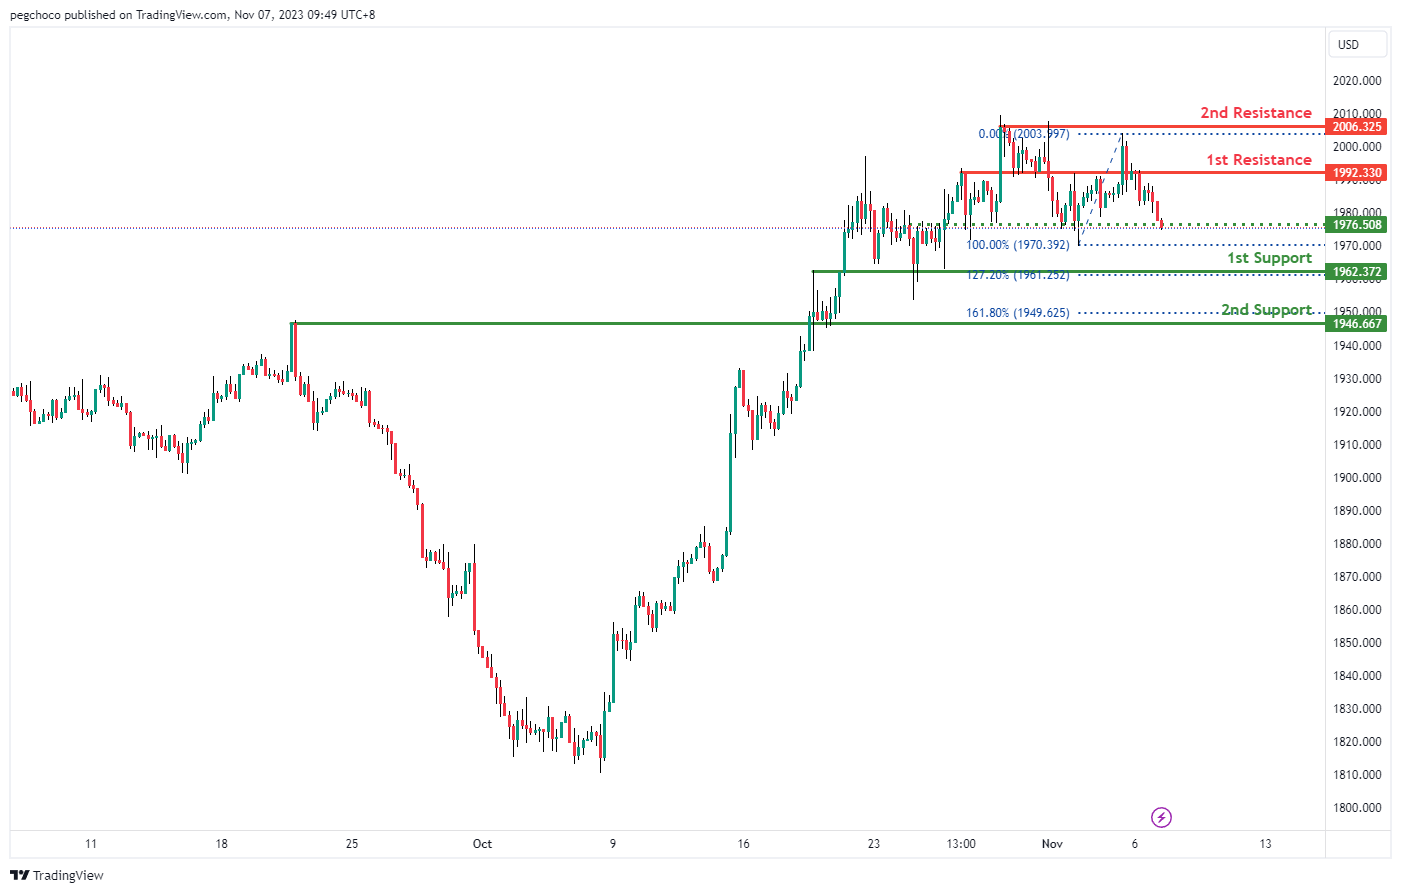
XAU/USD (GOLD):
The XAU/USD chart currently has a bearish overall momentum, indicating the potential for a bearish continuation towards the 1st support level.
The 1st support at 1962.37 is identified as an overlap support and coincides with the 127.20% Fibonacci Extension level, suggesting it could be a significant level where the price might find some buying interest.
The 2nd support at 1946.66 is considered a pullback support and aligns with the 161.80% Fibonacci Extension level, further reinforcing its potential as a support level.
On the resistance side, the 1st resistance at 1992.33 is categorized as an overlap resistance, suggesting it could act as a level where the price may face selling pressure.
The 2nd resistance at 2006.32 is noted as a multi-swing high resistance, indicating another potential level where the price may encounter obstacles in its upward movement.
The accuracy, completeness and timeliness of the information contained on this site cannot be guaranteed. IC Markets does not warranty, guarantee or make any representations, or assume any liability regarding financial results based on the use of the information in the site.
News, views, opinions, recommendations and other information obtained from sources outside of www.icmarkets.com, used in this site are believed to be reliable, but we cannot guarantee their accuracy or completeness. All such information is subject to change at any time without notice. IC Markets assumes no responsibility for the content of any linked site.
The fact that such links may exist does not indicate approval or endorsement of any material contained on any linked site. IC Markets is not liable for any harm caused by the transmission, through accessing the services or information on this site, of a computer virus, or other computer code or programming device that might be used to access, delete, damage, disable, disrupt or otherwise impede in any manner, the operation of the site or of any user’s software, hardware, data or property.


