
A note on lower timeframe confirming price action…
Waiting for lower timeframe confirmation is our main tool to confirm strength within higher timeframe zones, and has really been the key to our trading success. It takes a little time to understand the subtle nuances, however, as each trade is never the same, but once you master the rhythm so to speak, you will be saved from countless unnecessary losing trades. The following is a list of what we look for:
- A break/retest of supply or demand dependent on which way you’re trading.
- A trendline break/retest.
- Buying/selling tails/wicks – essentially we look for a cluster of very obvious spikes off of lower timeframe support and resistance levels within the higher timeframe zone.
- Candlestick patterns. We tend to only stick with pin bars and engulfing bars as these have proven to be the most effective.
We search for lower timeframe confirmation between the M15 the H1 timeframes, since most of our higher-timeframe areas begin with the H4. Stops are usually placed 5-10 pips beyond confirming structures.
EUR/USD:
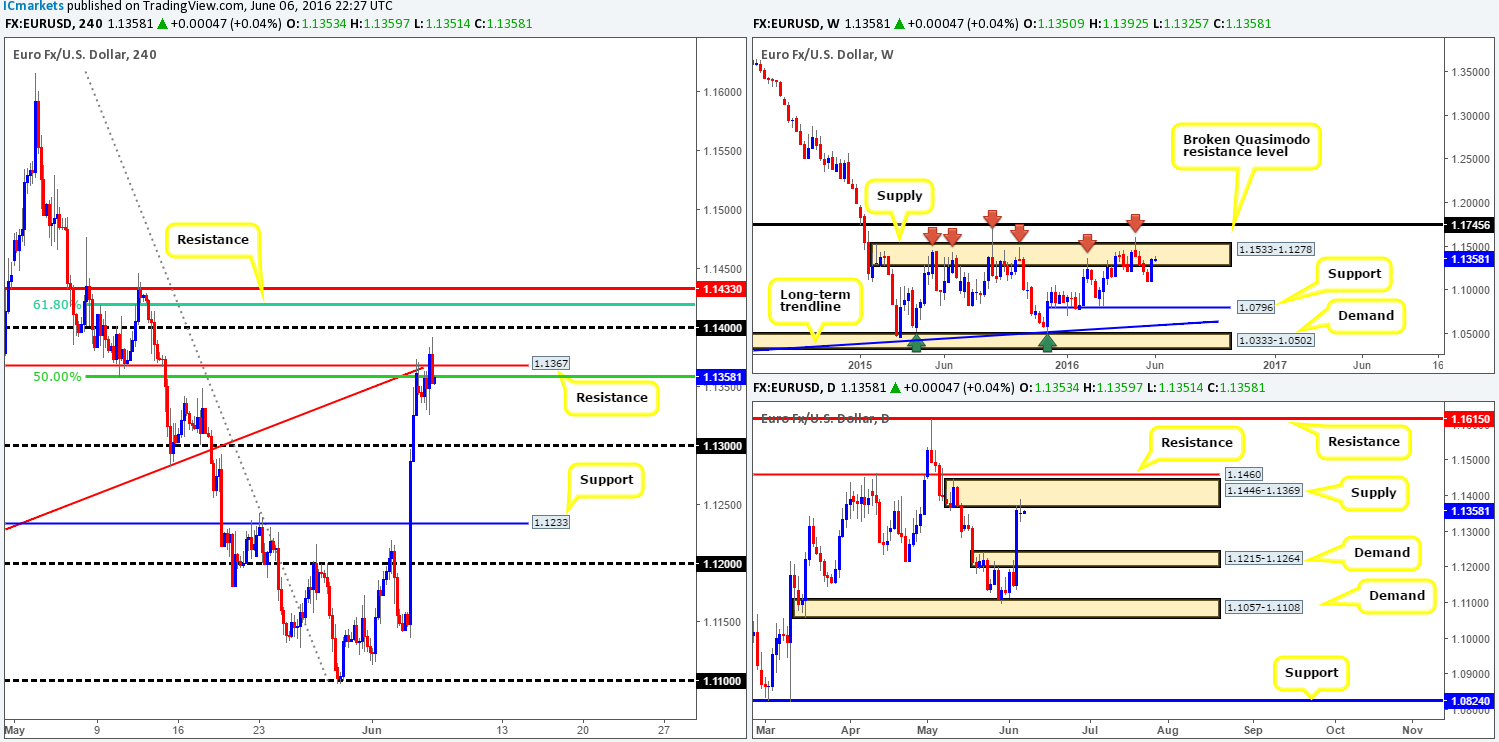
Supported by a H4 demand seen over on the U.S. dollar index at 93.68-93.85, the shared currency continues to find offers around H4 resistance penciled in at 1.1367 (backed by a H4 50% Fib resistance at 1.1358 and a H4 trendline support-turned resistance taken from the low 1.1057). As you can see, price did in fact whipsaw through this level yesterday following comments from Fed Chair Janet Yellen. The technical story, however, remains the same.
This H4 resistance is, as we mentioned in Monday’s report, reinforced by both a weekly supply zone at 1.1533-1.1278 (managed to hold price lower since May 2015), and a daily supply area seen at 1.1446-1.1369 (indecision candle reaction seen yesterday). Therefore, our team remains in the sellers’ camp for the time being.
Our suggestions: The current H4 resistance at 1.1367, and also the H4 resistance seen above at 1.1433 (bolstered by the H4 61.8% Fib level at 1.1419) are, in our opinion, beautiful areas to be looking for sell opportunities today.
We would, however, only recommend trading the above lines if and only if lower timeframe confirming price action is seen. This could be an engulf of demand followed by a retest, a trendline break/retest or simply a collection of selling wicks around a lower timeframe resistance. Should one manage to spot a short opportunity today from the 1.1367 region, we’d be looking to take partial profits around the 1.13 band and reducing risk to breakeven.
Levels to watch/live orders:
- Buys: Flat (Stop loss: N/A).
- Sells: 1.1367 region [Tentative – confirmation required] (Stop loss: dependent on where one confirms this area). 1.1433 region [Tentative – confirmation required] (Stop loss: dependent on where one confirms this area).
GBP/USD:
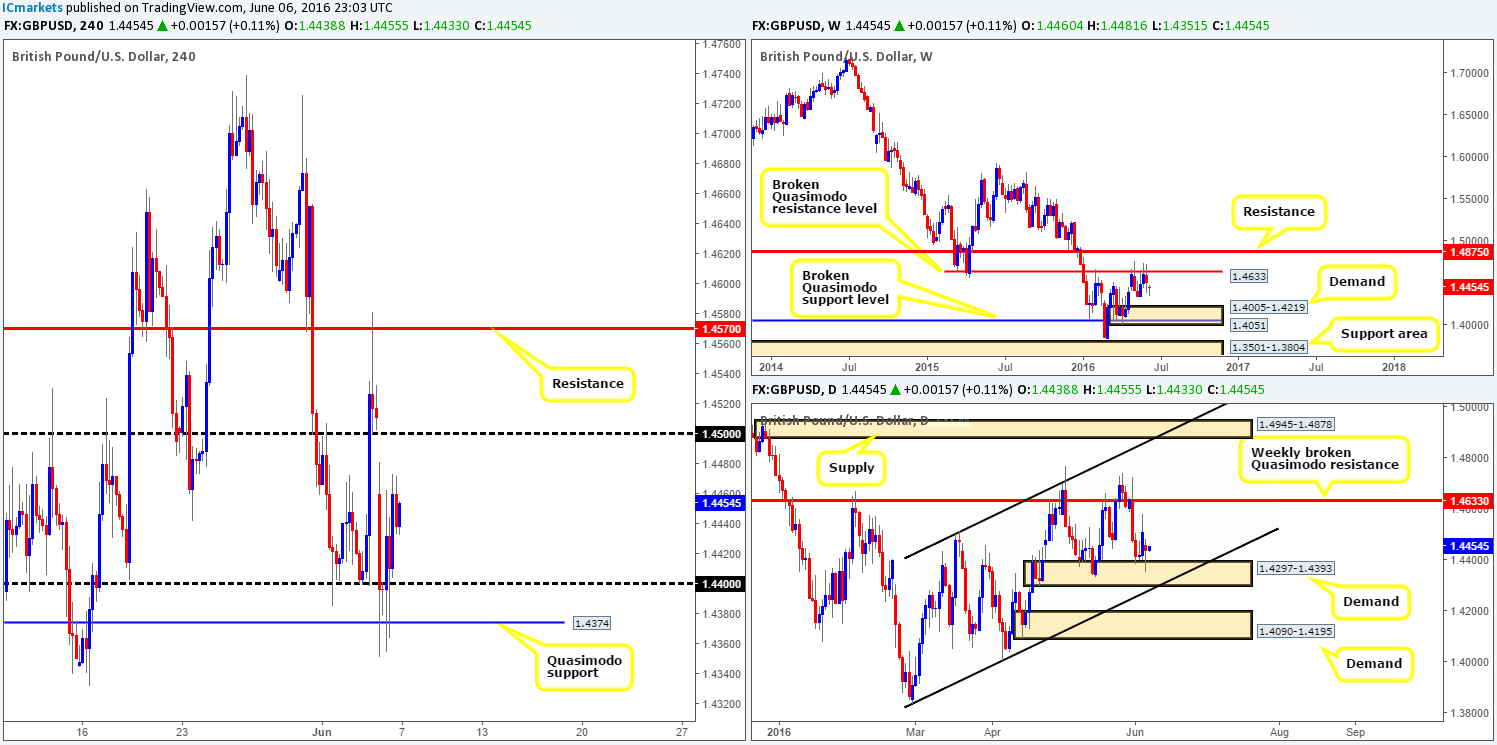
Following a relatively large weekend gap, cable continued driving lower to a H4 Quasimodo support line seen at 1.4374, where shortly after price bottomed out and eventually rallied to recover some of the day’s losses. With the H4 chart showing the market now loitering between 1.45/1.44, what’s the vibe like on the higher timeframe picture?
Over on the weekly chart, the pound remains trading beneath the weekly broken Quasimodo resistance line (BQM) at 1.4633. With this line managing to cap upside since early February and the pair clearly still entrenched within a downtrend, we feel the bears may continue to claw down to weekly demand chalked up at 1.4005-1.4219 (fuses with a weekly broken Quasimodo support level at 1.4051). Despite the weekly chart, daily price is currently trading from a daily demand fixed at 1.4297-1.4393 (blends nicely with a daily channel support extended from the low 1.3835). Therefore, in order for weekly action to push lower this week, bids will need to be removed from here to allow price to connect with daily demand coming in at 1.4090-1.4195 (positioned within the aforementioned weekly demand).
Our suggestions: With weekly sellers portraying a bearish stance and daily buyers indicating more of a bullish tone, trading this market is tricky in our opinion. The weekend gap will likely be filled today, however, which could see price bounce from the 1.45 handle. Nevertheless, due to where price is positioned on the daily chart (see above), we’d advise being patient and not entering into a position from here until some sort of lower timeframe sell setup has formed (see the top of this report for ideas on confirming lower timeframe price action).
Levels to watch/live orders:
- Buys: Flat (Stop loss: N/A).
- Sells: 1.45 region [Tentative – confirmation required] (Stop loss: dependent on where one confirms this area).
AUD/USD:
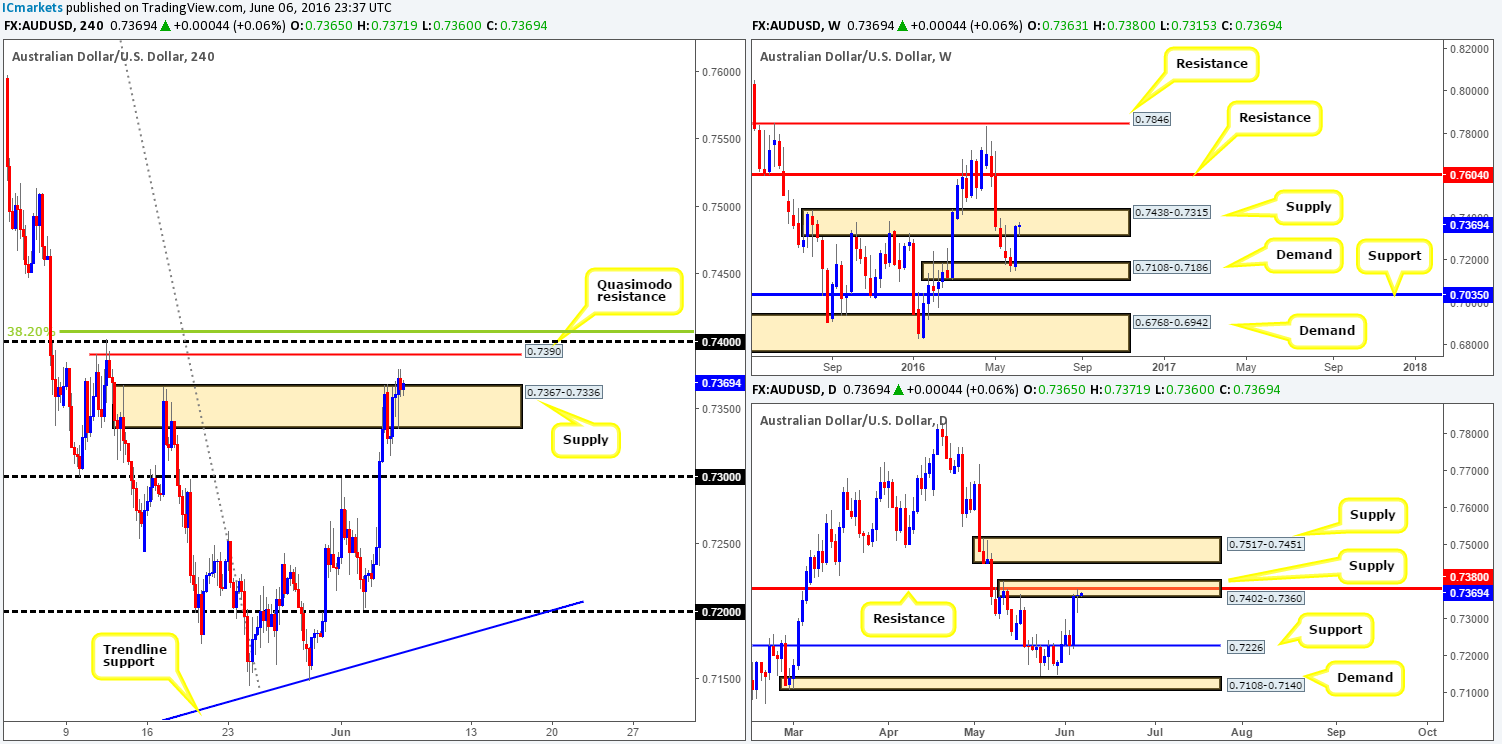
Beginning with a look at the weekly chart this morning, the buyers and sellers continue to battle for position within the confines of a weekly supply base drawn from 0.7438-0.7315. This area was prior supply which capped this market beautifully for around six months, so we’re expecting the bears to make an appearance here shortly.
In a similar fashion to the weekly chart, we can also see that daily price is currently trading from a daily supply at 0.7402-0.7360 (surrounds a daily resistance line penciled in at 0.7380). If this area caves in, there’s not much stopping this unit from gravitating towards daily supply seen at 0.7517-0.7451 (sits directly above the aforementioned weekly supply), so a fakeout above the weekly supply area could be a possibility should a push higher come into view. Supposing that the bears defend this zone this week, however, we’ll then expect the Aussie to shake hands with daily support chiseled in at 0.7226.
Stepping across to the H4 chart, supply at 0.7367-0.7336 suffered a break going into yesterday’s London lunch time, which may force price to test the H4 Quasimodo resistance line at 0.7390 (bolstered by a 0.74 handle and a H4 38.2% Fib resistance line at 0.7405).
Our suggestions: Consequent to a rather lackluster performance yesterday, much of the following will be the same as Monday’s report.
We still feel the H4 Quasimodo resistance line at 0.7390 and its converging structures (see above), as well as the higher timeframe picture is enough to permit a pending sell order to be set at 0.7388 (just below the aforementioned H4 Quasimodo resistance) with a stop above the 38.2% H4 Fib level at 0.7407. The first target will, should the order trigger today, be around the 0.7350 region.
Levels to watch/live orders:
- Buys: Flat (Stop loss: N/A).
- Sells: 0.7388 [Pending order] (Stop loss: 0.7407).
USD/JPY:
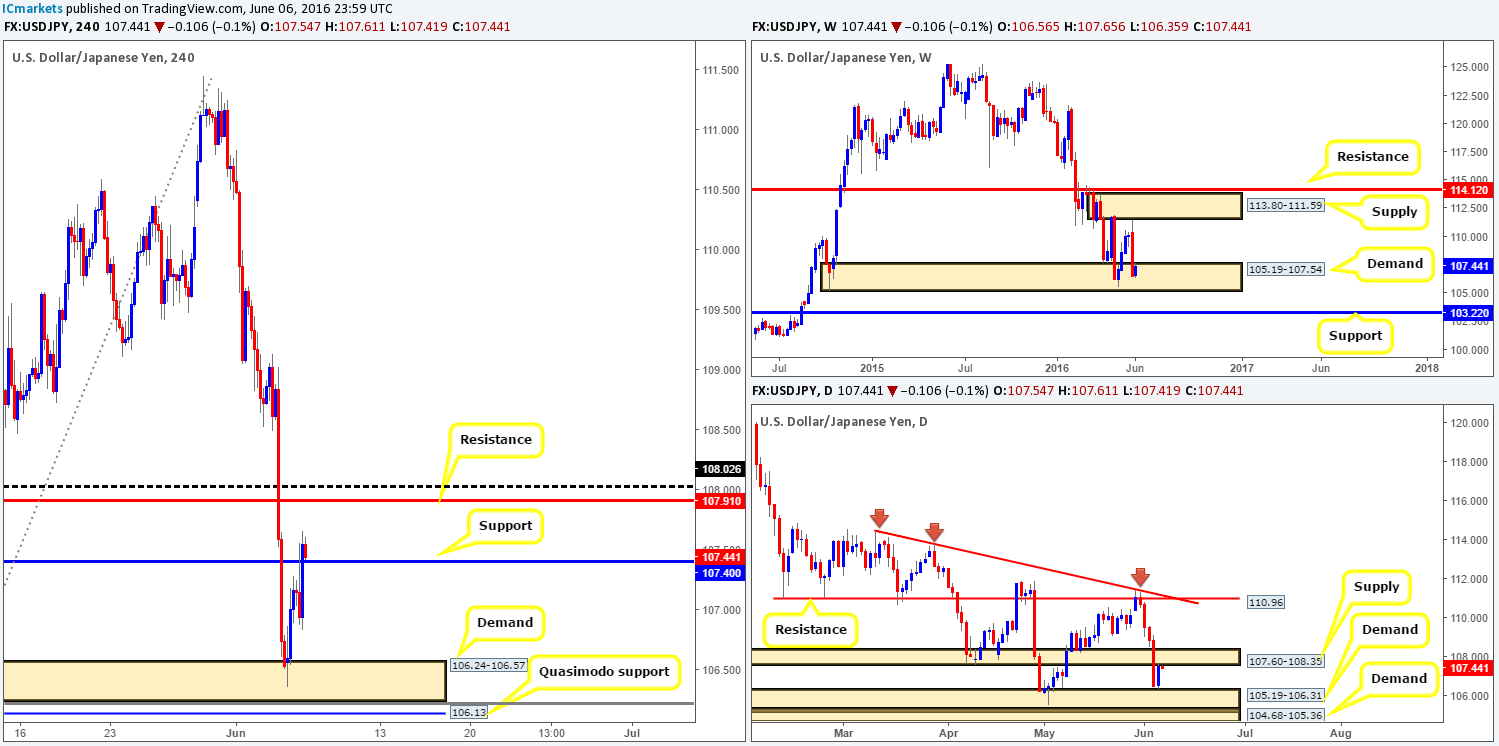
For those who read our previous report on the USD/JPY (see link below) you may recall us mentioning to keep an eye out for lower timeframe buy entries within the H4 demand area at 106.24-106.57. As can be seen from the H4 chart, price rallied beautifully from this base in the early hours of yesterday morning, ending the day closing above a H4 resistance at 107.40 (now acting support). Well done to any of our readers who managed to lock in some green pips from here.
Thanks to yesterday’s advance, price is now seen flirting with the underside of a daily supply area coming in at 107.60-108.35. So, although weekly action is still firmly positioned within weekly demand at 105.19-107.54, selling pressure may be seen today.
Our suggestions: Wait and see if the H4 candles can find support at 107.40 before considering looking for a lower timeframe buying opportunity (targeting the H4 resistance 107.91 as the immediate take-profit zone). We would not advise entering from here at market since getting caught on the wrong side of daily sellers will not be a pretty sight for your account, so patience is a MUST!
Remember, if we manage to find lower timeframe confirmation off of the current H4 support, we would be buying into daily supply, but at the same time also buying from within weekly demand!
Levels to watch/live orders:
- Buys: 107.40 region [Tentative – confirmation required] (Stop loss: dependent on where one confirms this area).
- Sells: Flat (Stop loss: N/A).
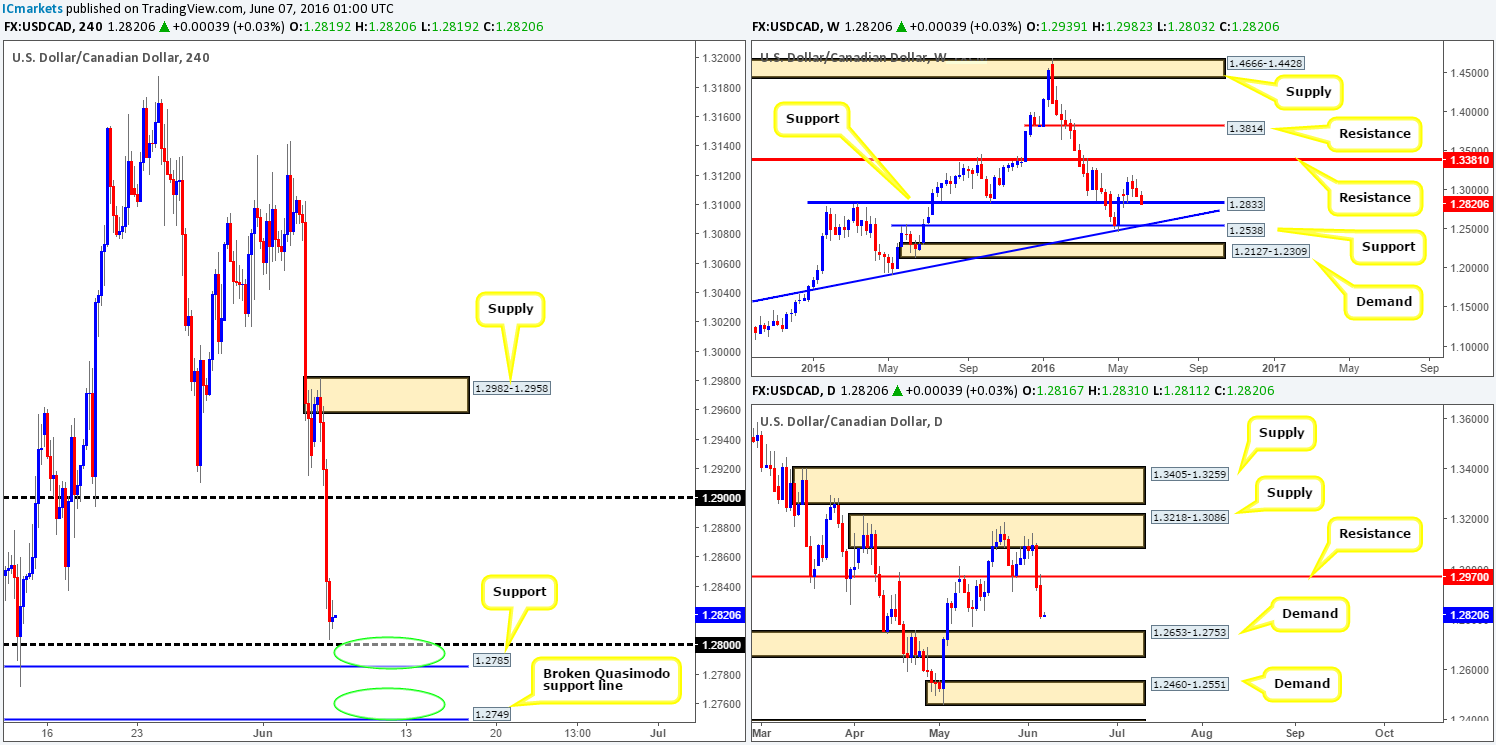
USD/CAD:
The USD/CAD, as you can see from the H4 chart, suffered going into yesterday’s sessions as the sellers pummeled this pair from the word go! Psychological support 1.29 was completely obliterated, which led to the Loonie clocking a fresh low of 1.2803 on the day. Seeing as how price is lurking ever so close to the 1.28 handle and a neighboring H4 support seen just below it at 1.2785, price could potentially turn here.
Over on the weekly chart, the unit is touching base with a weekly support line penciled in at 1.2833. Although candle action is trading just below this barrier, it does not mean this level is consumed in our opinion. Looking down to the daily chart, however, there is room for this market to drop lower to connect with the top-side of daily demand at 1.2653-1.2753. What is more, if you look back over to the H4 chart, the top-side of the daily barrier converges nicely with a H4 broken Quasimodo (BQM) support line at 1.2749.
Our suggestions: Based on what we’ve noted above, the H4 1.2785/1.2800 region and the H4 (BQM) support line at 1.2749 (green circles) are levels we currently have on our radar. Both areas have support from higher timeframe structures, so a bounce should be seen.
Each trader, of course, will have their own way to validate the above said H4 levels. In our case, we’re going to opt for the safer route here and wait for lower timeframe confirmation (see the top of this report for confirming techniques), since this will likely avoid any potential whipsaws seen through the levels.
Levels to watch/live orders:
- Buys: 1.2785/1.2800 [Tentative – confirmation required] (Stop loss: dependent on where one confirms this area). 1.2749 region [Tentative – confirmation required] (Stop loss: dependent on where one confirms this area).
- Sells: Flat (Stop loss: N/A).
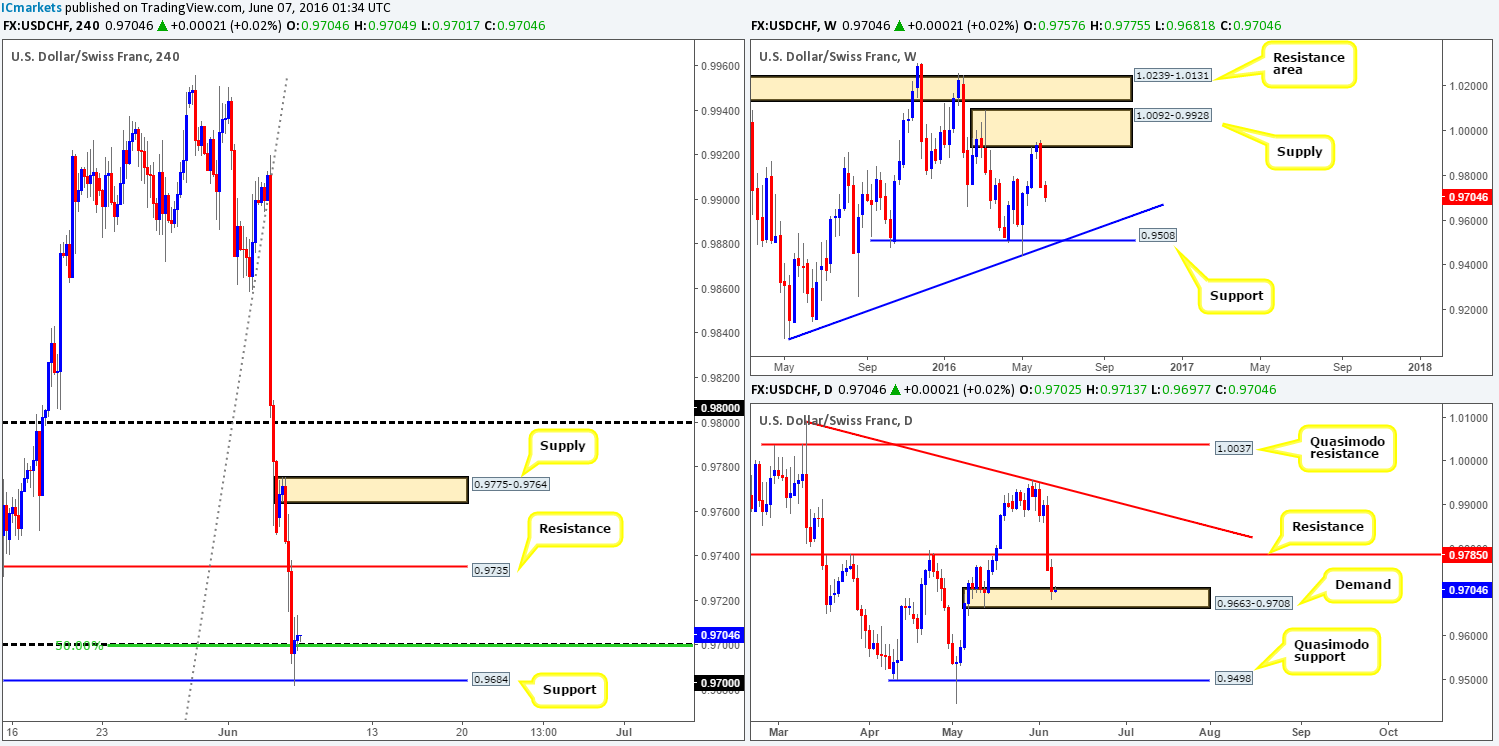
USD/CHF:
The USD/CHF continued to lose ground throughout Monday’s sessions, breaking through both H4 support at 0.9735 (now acting resistance) and the 0.97 handle, before finding support from 0.9684. With the Swissy now seen trading back above 0.97, which is bolstered by a H4 50% Fib support barrier (taken from the low 0.9443), what’s likely in store for this market today? Well, weekly action shows room for price to continue selling-off down to weekly support coming in at 0.9508, whilst down on the daily, the buyers and sellers are currently battling for position within daily demand at 0.9663-0.9708.
Our suggestions: Buying from 0.97, despite the confluence being seen on the H4 and daily charts, is still a risky play in our book considering how bearish the weekly chart is looking at the moment. For those who believe a long is still worth a shot from the 0.97 region today, waiting for lower timeframe confirmation to form prior to risking capital is likely the safer route (for confirmation techniques please see the top of this report).
Levels to watch/live orders:
- Buys: 0.97 region [Tentative – confirmation required] (Stop loss: dependent on where one confirms this area).
- Sells: Flat (Stop loss: N/A).
DOW 30:
U.S. stocks were pumped higher yesterday, consequently breaking through both H4 supply at 17907-17872 (now demand) and H4 resistance drawn from 17920 (now support). What this also did was force daily action to close above daily resistance at 17894 (now acting support), and likely open the gates for this unit to touch gloves with the daily supply area seen at 18186-18117. In addition to this, weekly price also remains in a relatively positive position with room for this index seen to stretch up to a weekly resistance area at 18365-18158 (encapsulates the top-side of the aforementioned daily supply zone).
Our suggestions: In light of the above points, our analysis is relatively straightforward. Watch the lower timeframes for an entry long off of the current H4 support at 17920 (for lower timeframe entry techniques, see the top of this report), targeting the H4 Quasimodo resistance barrier at 18050 (positioned just below the daily supply area mentioned above at 18186-18117).

Levels to watch/live orders:
- Buys: 17920 region [Tentative – confirmation required] (Stop loss: dependent on where one confirms this area).
- Sells: Flat (Stop loss: N/A).
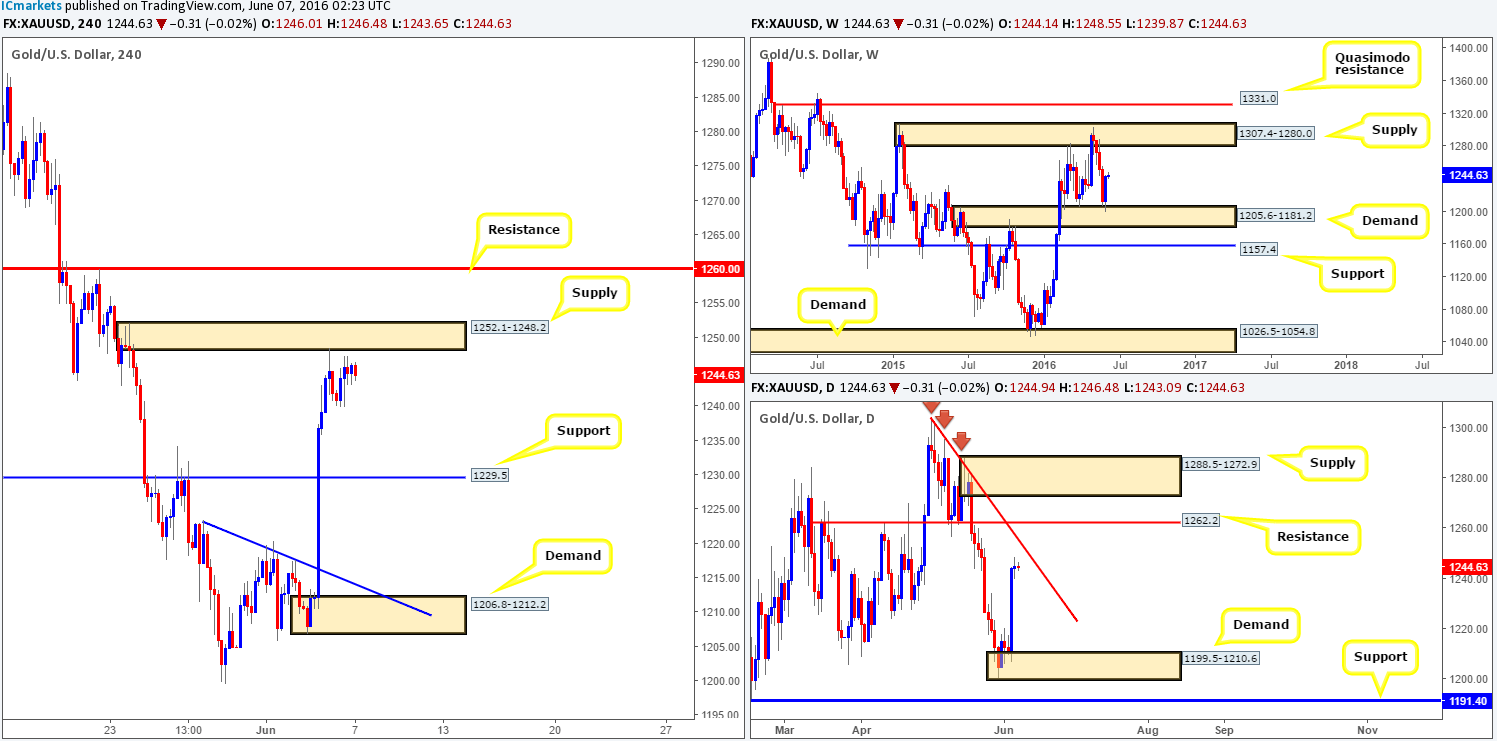
GOLD:
Shortly after the market opened yesterday, the yellow metal was offered from the underside of a H4 supply zone seen at 1252.1-1248.2. This brought prices down to lows of 1239.9, where the market began to bottom out and eventually bid itself back up to highs of 1247.3 into the day’s close. All in all, it was a rather monotonous day!
Looking over to the weekly chart, gold remains well-bid from weekly demand logged in at 1205.6-1181.2. In the event that the buyers continue to support price here, there’s little resistance seen overhead until the metal reaches where it came from – weekly supply seen at 1307.4-1280.0. Turning our attention to the daily chart, we can see that a daily indecision candle formed during yesterday’s session, just ahead of a steep daily trendline resistance taken from the high 1303.6.
Our suggestions: Personally, neither a long nor short seems attractive at this time! We’re cornered no matter which way we turn!
- Selling from the H4 supply at 1252.1-1248.2 potentially places us against weekly buying from the aforementioned weekly demand, and with little resistance seen on the daily chart until price connects with the above said daily trendline resistance, it is a very risky short trade in our opinion.
- If we should buy, we’d be entering long into H4 supply, and even if price rallies from here, we’d then face the might of the daily trendline resistance! The only comfort here would be the fact that we’d have bought in-line with weekly flow. Again, not exactly a high-probability trade!
As such, remaining flat until more conducive price action presents itself is the route we have chosen to take.\
Levels to watch/live orders:
- Buys: Flat (Stop loss: N/A).
- Sells: Flat (Stop loss: N/A).


