Lower timeframe confirmation: simply means waiting for price action on the lower timeframes to confirm direction within a higher timeframe area. For example, some traders will not enter a trade until an opposing supply or demand area has been consumed, while on the other hand, another group of traders may only need a trendline break to confirm direction. As you can probably imagine, the list is endless. We, however, personally prefer to use the two methods of confirmation mentioned above in our trading.
EUR/USD:
Despite the fact that Greek voters rejected austerity this weekend, the EUR/USD pair recovered well during yesterday’s trade, resulting in price filling the 120-pip weekend gap, which, as you can see, just missed connecting with the 1.1100 handle. This rebound may reflect hope that the Greek government can finally reach a deal with its creditors.
Technically, we can see that price remains mid-range on the weekly timeframe between 1.1532-1.1278 – a weekly supply area, and 1.0519-1.0798 – a weekly demand zone. Meanwhile on the daily scale, price is seen holding nicely above daily demand at 1.0886-1.0978 with room seen above for further buying. Personally, we’re not convinced by yesterday’s surge north, and even though this pair currently boasts demand from the daily chart, we do not see the EUR getting above 1.1100/1.1111, based on the fear plaguing this market that the ‘no’ vote could backfire on the Greeks. If price does manage to trade higher, however, we see price only reaching as far as the 4hr supply at 1.1171-1.1147 for the following reasons:
- Take a look across to the daily chart; you may be able to see that this 4hr area of supply lines up nicely with a daily swap level 1.1148.
- The 4hr supply area contains the magic Fibonacci retracement number 0.618.
- The 4hr supply zone is also supported by the mid-level number 1.1150, which as most already know are often reactive points in this market.
With all of the above taken into consideration, we’re going to keep an eye on the 1.1100/1.1111 region and the aforementioned 4hr supply zone seen above it for potential (confirmed) shorting opportunities today. Targets will of course depend on the approach to each zone.

Levels to watch/live orders:
- Buys: Flat (Stop loss: N/A).
- Sells: 1.1100/1.1111 [Tentative – confirmation required (Stop loss: dependent on where one confirms this level) 1.1171-1.1147 [Tentative – confirmation required (Stop loss: 1.1174).
GBP/USD:
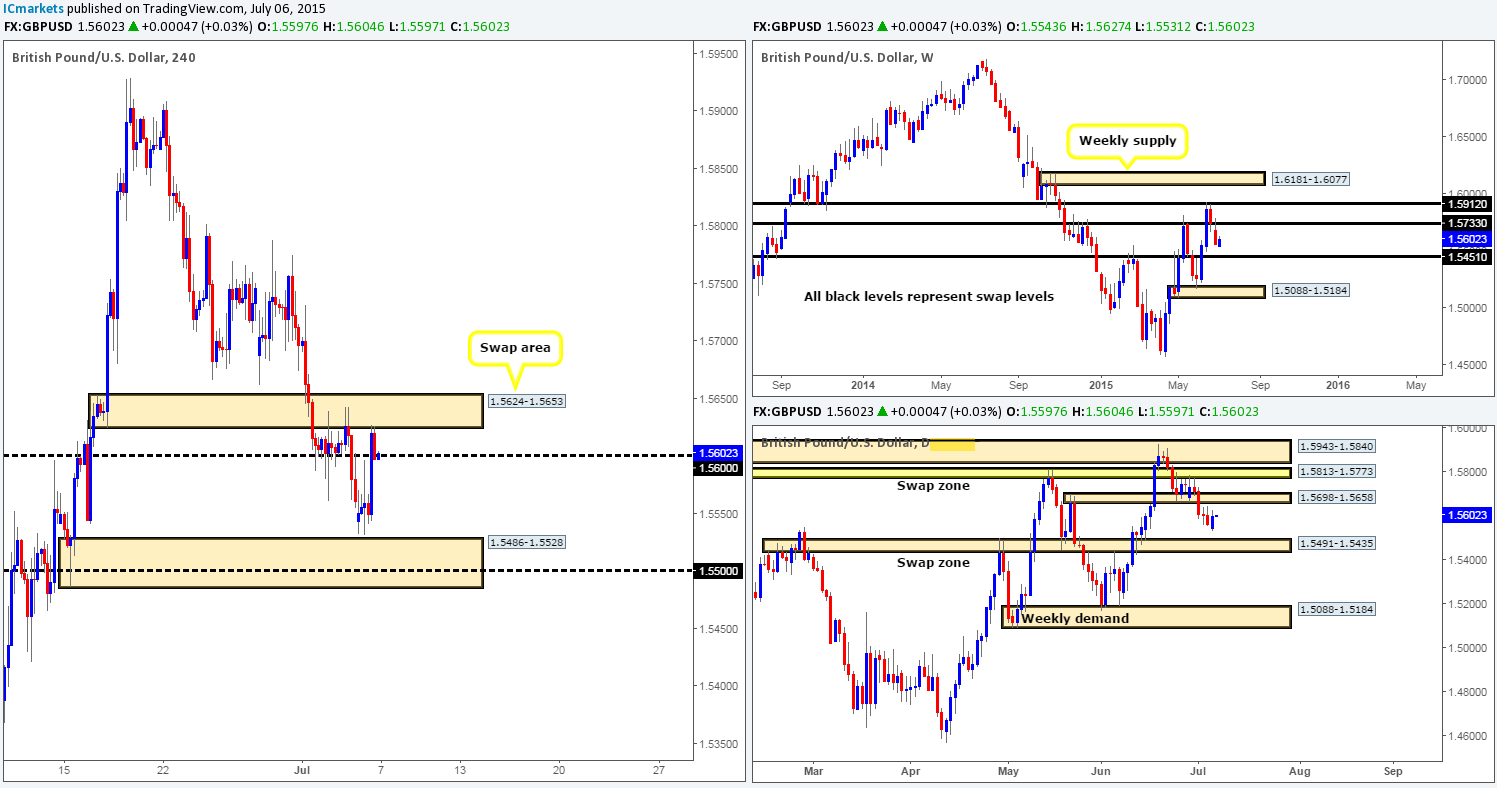
For those who read our previous report on Cable http://www.icmarkets.com/blog/monday-6th-july-weekly-technical-outlook-and-review/ you may recall us mentioning to not only keep an eye on the 1.5600 handle for possible sells yesterday, but also to remain aware of the possibility that price could fake higher here to connect with the 4hr swap area coming in at 1.5624-1.5653. As we can see, a fakeout did indeed take place, which produced almost perfect price action to short on the 5 minute timeframe around a Quasimodo resistance level at 1.5624. Unfortunately, we were not quick enough to catch this trade. For any of our readers who did though, great work!
Going forward, the move south from the aforementioned 4hr swap area has, as you can see, forced price to close below 1.5600, which could potentially stimulate a further decline today. Agreement is also being seen across the board regarding the higher timeframe technical structures. Both the weekly and daily timeframes show little support, the closest being seen at this time is the daily swap zone at 1.5491-1.5435.
Therefore, should the sellers remain strong around the 1.5600 region, we’d likely consider a small intraday short position, targeting the mid-level number 1.5550, or given enough time and effort from the sellers, the combined 4hr demand /round number area at 1.5486-1.5528/1.5500.
Levels to watch/ live orders:
- Buys: Flat (Stop loss: N/A).
- Sells: 1.5600 [Tentative – confirmation required] (Stop loss: dependent on where one confirms this level).
AUD/USD:
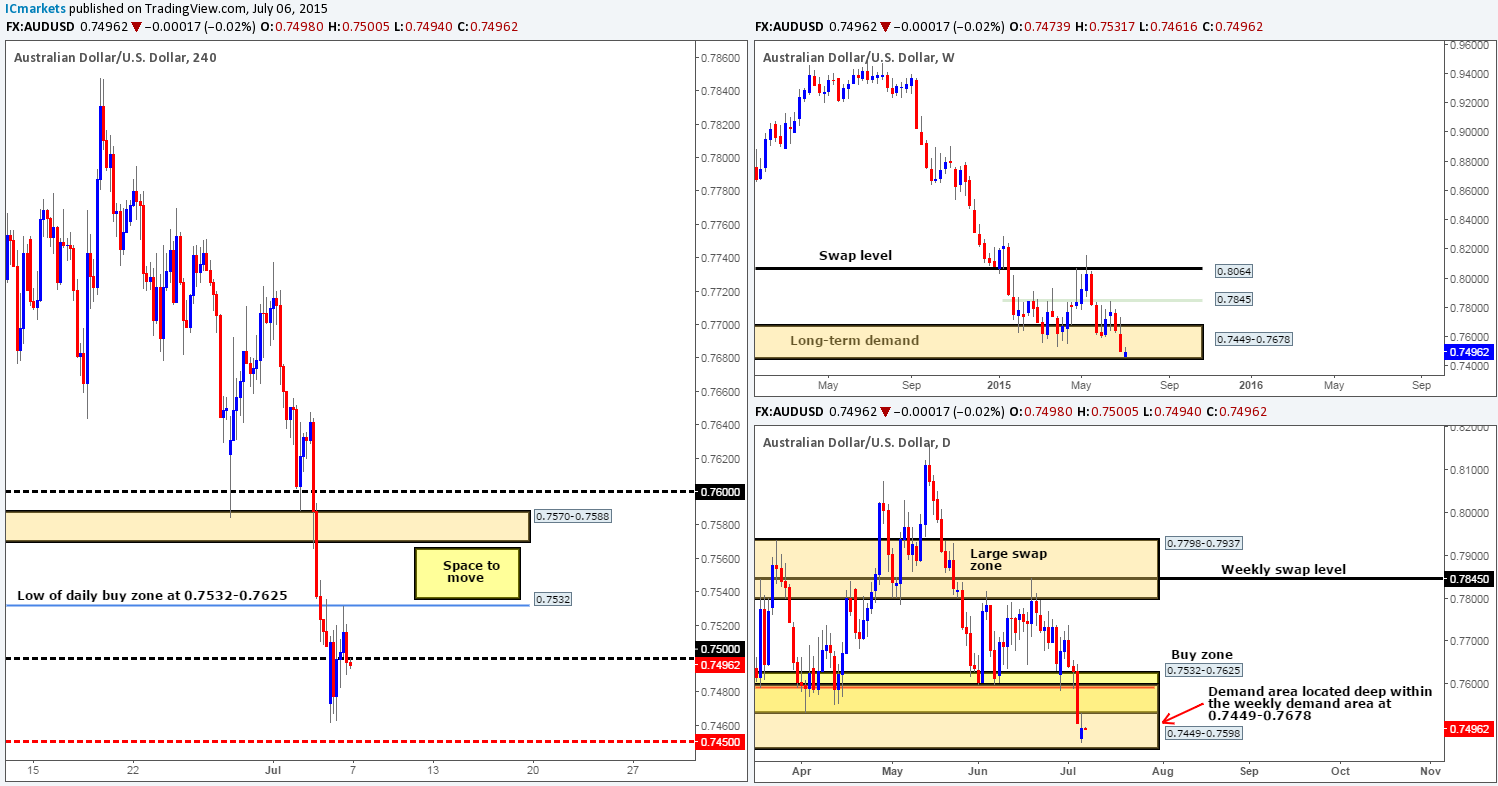
Throughout yesterday’s trading sessions, we can see that price begun recovering from Friday’s free-fall, which saw price surpass 0.7500 and shake hands with the recently broken daily buy zone low at 0.7532. Although the AUD/USD is currently trading deep within both weekly and daily demand (0.7449-0.7678 – 0.7449-0.7598) at the moment, it is difficult to permit buying when price is essentially trending south (check weekly timeframe), and is also, as you can see, clearly still finding resistance at the underside of 0.7532.
That being the case, we will not consider longs on this pair until 0.7532 is consumed. We’d much rather wait to get into the space above this level as there is effectively little resistance in the way to stop price from reaching the 4hr swap area at 0.7570-0.7588. With regards to shorting this market, however, our team has come to a general consensus that selling will not be an option for us (even though the weekly downtrend is strong) until a convincing DAILY close below the aforementioned daily demand area takes place.
Levels to watch/ live orders:
- Buys: Flat (Stop loss: N/A).
- Sells: Flat (Stop loss: N/A).
USD/JPY:
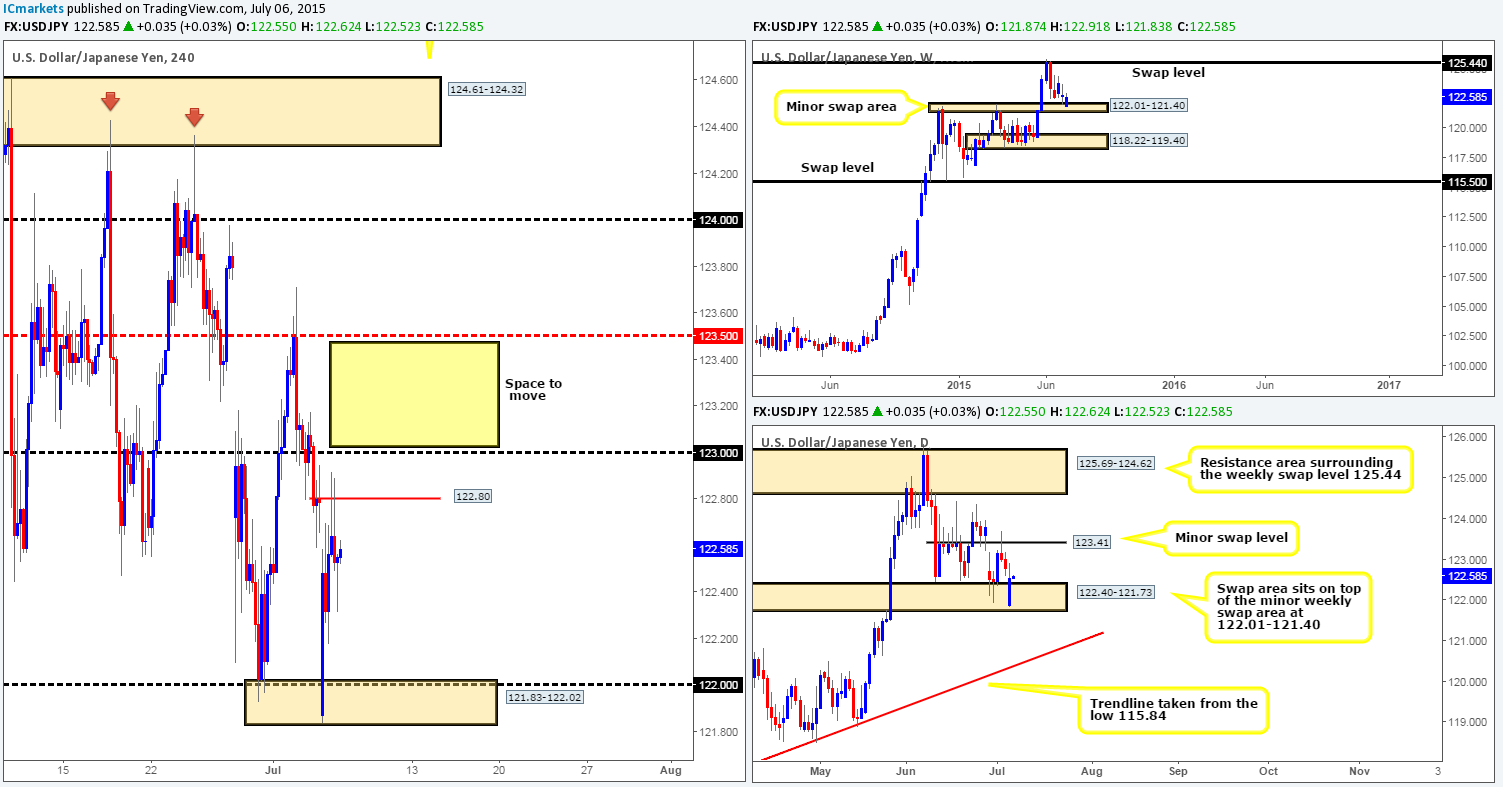
Consequent to Sunday’s gap lower, the USD was heavily bid going into yesterday’s Asian session. This continued as we moved into the European/London sessions, forcing price to cross swords with the 4hr level 122.80, which was clearly enough to hold this market lower.
With both the weekly and daily charts showing price trading side-by-side in demand (122.01-121.40 – 122.40-121.73) at the moment, our attention will mostly be driven toward longs today/this week. With that, we are currently eyeing two levels for potential buy trades. The first comes in at 121.83-122.02 (round-number 122.00 convergence). Dependent on the approach of course, an entry long from here could provide fantastic risk/reward. The second level is a little trickier. We’d first need to see a convincing break above the 123.00 level, then wait to see if price retests this number as support. If a retest is seen, we’re good to go for a buy trade up to at least 123.50.
However, due to ongoing political situation in Greece, the USD/JPY will likely be affected. As such, we would highly recommend waiting for the lower timeframe price action to confirm your entry before pulling the trigger. This will possibly help save you from unnecessary losses.
Levels to watch/ live orders:
- Buys: 121.83-122.02 [Tentative – confirmation required] (Stop loss: 121.80).
- Sells: Flat (Stop loss: N/A).
USD/CAD:
The USD/CAD pair may have pushed higher during yesterday’s sessions, but all the while price trades within overall market supply (see list below), it is difficult for us to find the confidence to even begin looking for buys.
- Congested weekly area at 1.2439/1.2765.
- Daily supply zone seen at 1.2666-1.2573.
- 4hr supply zone at 1.2666-1.2633.
Therefore, until a sustained move above the daily supply area is seen, our team is not permitted to enter long. Intraday long trades would likely be ok, nonetheless, but we tend to stick to the higher timeframes and only use the lower timeframes for entry. As such, similar to yesterday’s report, our objective for today is simple. Watch for lower timeframe price action confirmation within the current 4hr supply zone. If all goes well and an entry south is spotted, we’d consider adding to this short position as the week progresses. Troublesome hurdles to keep an eye on are of course the three ignored 4hr Quasimodo levels below at 1.2537/1.2490/1.2446, but also the near-term 4hr demand zone coming in at 1.2562-1.2590.

Levels to watch/ live orders:
- Buys: Flat (Stop loss: N/A).
- Sells: 1.2666-1.2633 [Tentative – confirmation required] (Stop loss: 1.2672).
USD/CHF:
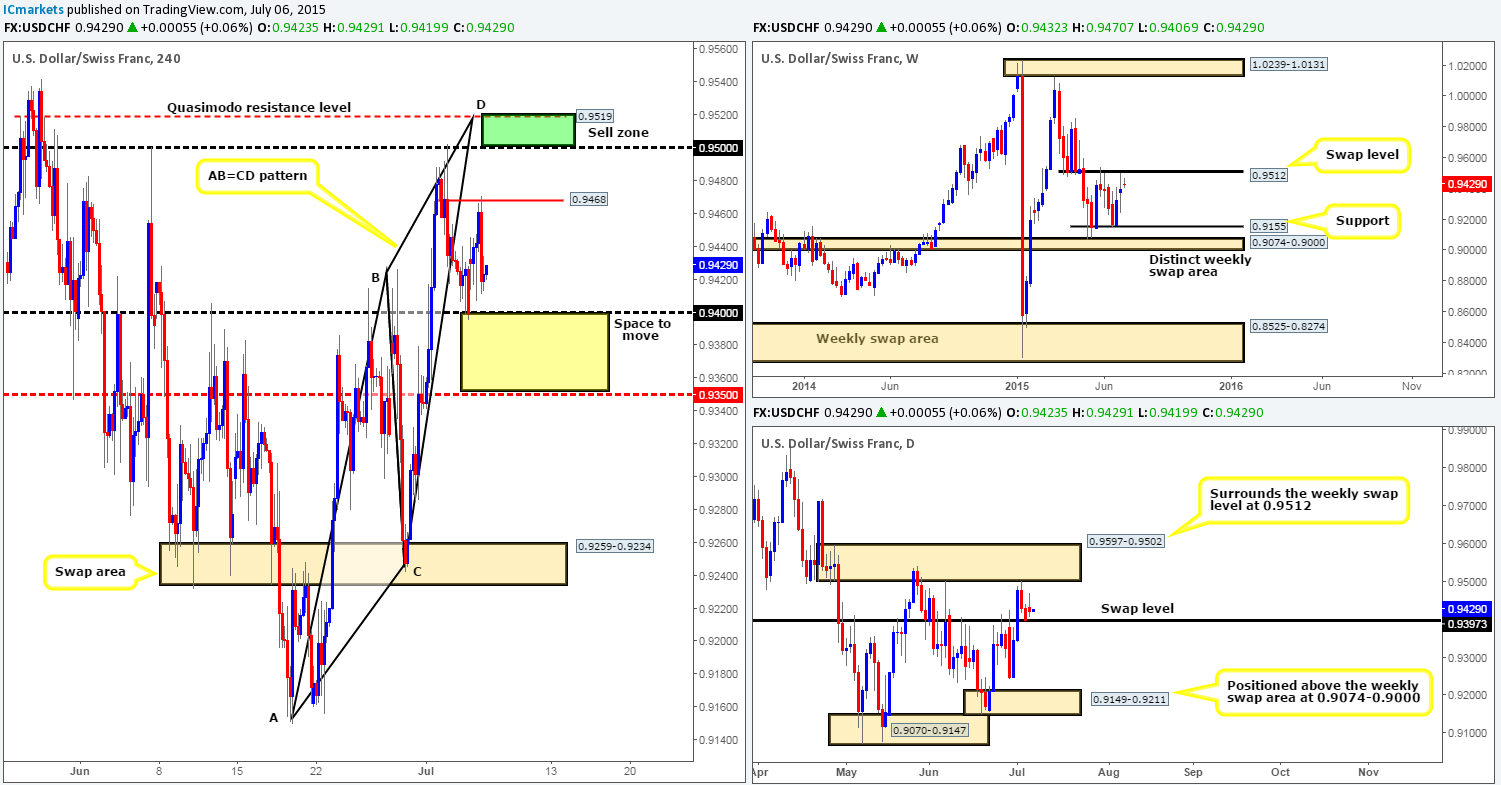
Following the gap north at yesterday’s open, price continued to advance during the European/London morning session up to 0.9468 – this was a level we should have had marked up, but completely missed it! It was at this point, US traders began placing their orders, which as you can see, reversed price beautifully from this hurdle going into the close 0.9423.
In the bigger picture, price is still seen hovering just below a weekly swap level coming in at 0.9512. Meanwhile, on the daily timeframe, price is actually trading a little above a daily swap level seen at 0.9397. Therefore in a step-by-step fashion here is our view on the most likely scenarios today/and possibly into the week:
- A violation of 0.9400 (which is essentially the aforementioned daily swap level all being said and done) would likely stimulate a decline down towards the mid-level hurdle 0.9350, since the space in between these two barriers is just perfect. However, our team would only be interested in trading this move if 0.9400 was retested as resistance and showed some sort of lower timeframe shorting signal such as, a small trendline break, or an engulf of a minor demand area etc…
- In the event that 0.9468 is taken out today, the river north would likely be ‘ripple free’ so to speak up to at least 0.9500. Between 0.9500 and the 4hr Quasimodo resistance level seen just above it at 0.9519 (the green box) is somewhere we’d be very interested in shorting since at that point the following would be in our favor:
- Price would be nibbling at the weekly swap level (0.9512).
- Price would also be trading within daily supply (0.9597-0.9502).
- 0.9519 (a 4hr Quasimodo resistance level) provides this market a beautiful fakeout barrier above 0.9500 to repel price.
- A 4hr Harmonic AB=CD pattern completes right at the point of our 4hr Quasimodo resistance level.
Levels to watch/ live orders:
- Buys: Flat (Stop loss: N/A).
- Sells: 0.9500/0.9519 [Tentative – confirmation required] (Stop loss: dependent on where one confirms this area).
DOW 30:
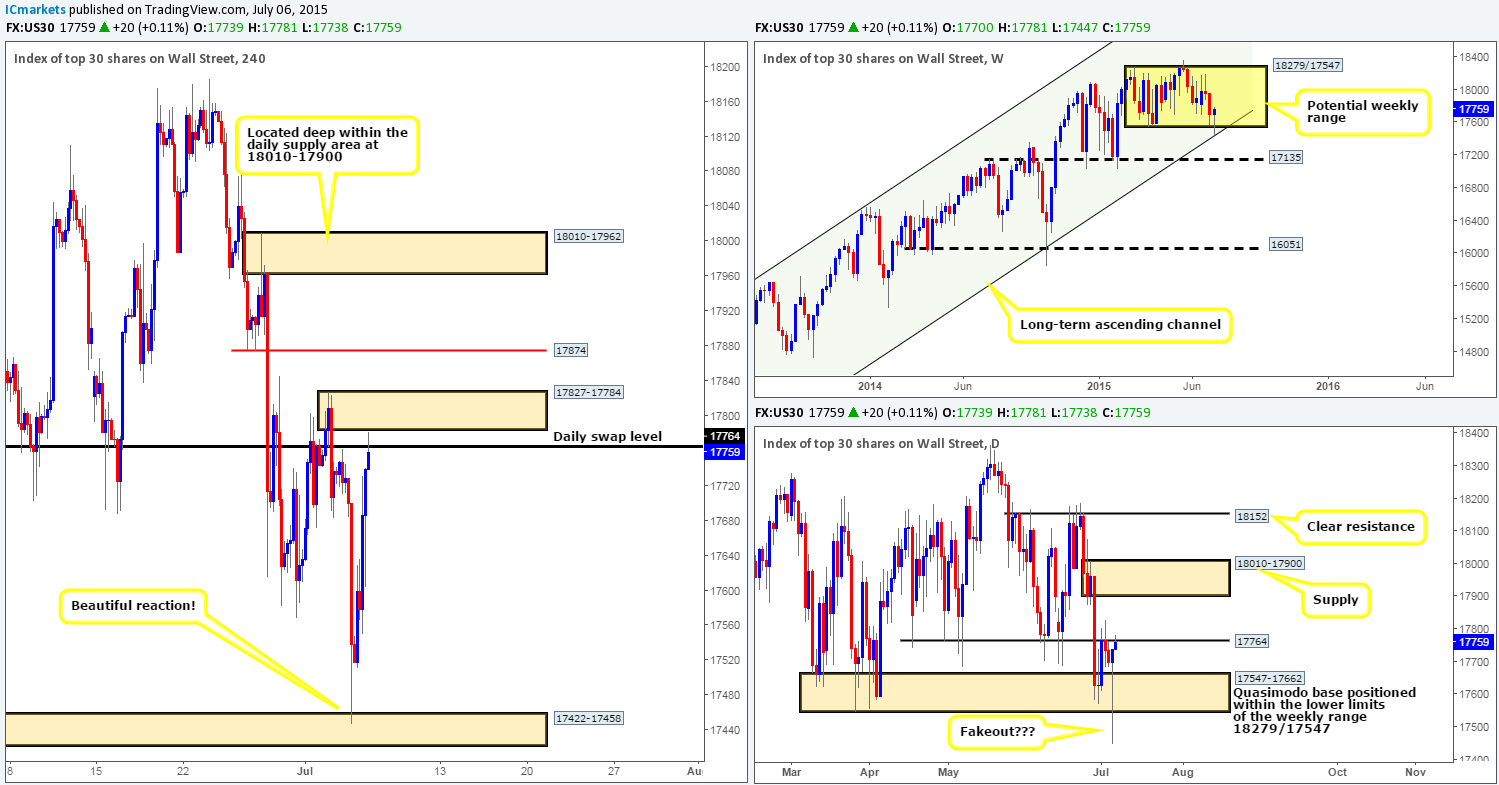
Consequent to the 253 point free fall around the open yesterday, price quickly corrected itself at the 4hr demand area seen at 17422-17458, which as you can see saw price eventually stab into the daily swap level at 17764 and just miss connecting with a 4hr supply area floating above it at 17827-17784.
On the subject of the daily timeframe, price recently spiked below a daily Quasimodo base at 17547-17662, and until we see a close above the daily swap level 17764 located just above it, it is very difficult to deduce whether or not this was a fakeout. However, alongside this, price is seen trading at the lower limits of a potential weekly range at 18279/17547. The interesting thing about this though is that price has also collided with support from a long-term weekly ascending channel taken from the low 10402 and high 13270 – fantastic confluence!
So, with all of the above taken on board, we’d ultimately like to see price close above the aforementioned daily swap level on the 4hr timeframe today, and push into any offers residing within the 4hr supply area at 17827-17784. Knowing that some of the offers have likely been chewed up here, we could then potentially begin looking for a buy trade on any retest seen at 17764, targeting 17874 as the first take-profit target, and all being the well the 4hr supply zone coming in at 18010-17962 (located deep within the aforementioned daily supply area) as our second and final take-profit zone.
With regards to selling this market, we agree, there is ample room for price to drop south, but with price seen trading off of a weekly range limit that converges with a long-term ascending channel line (see above); we believe sells are best placed on the back burner for the being.
Levels to watch/ live orders:
- Buys: Flat (Stop loss: N/A).
- Sells: Flat (Stop loss: N/A).
XAU/USD: (Gold)
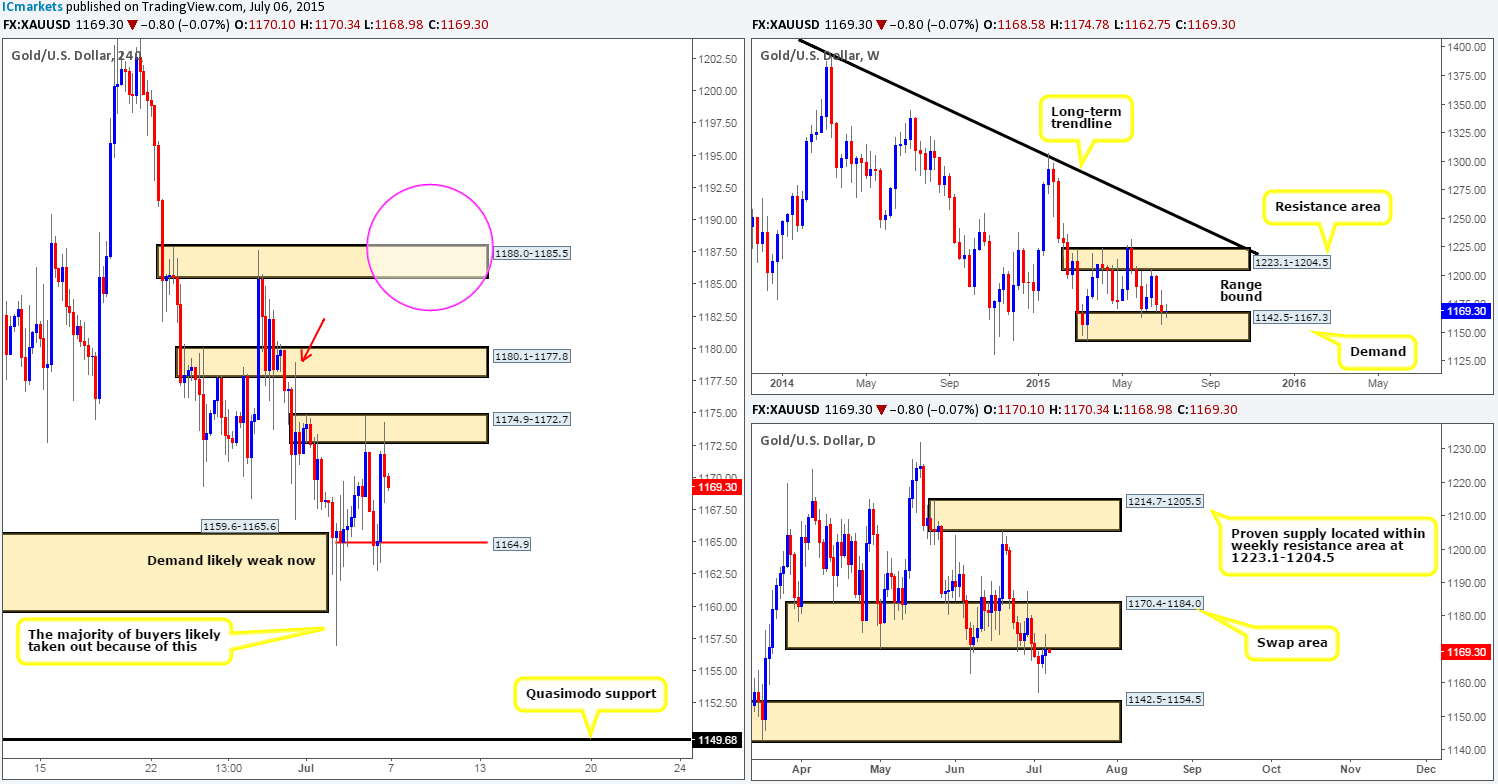
Following Thursday’s NFP induced fakeout below 4hr demand at 1159.6-1165.6, price has been seen ping-ponging between a small 4hr supply area at 1174.9-1172.7 and 4hr support visible at 1164.9.
Now, considering that the 4hr supply zone just mentioned above is located around the lower limits of a daily swap (supply) area at 1170.4-1184.0, and the 4hr support level is backed by weekly demand coming in at 1142.5-1167.3, which currently forms the lower limit of the weekly range (1142.5-1167.3/ 1223.1-1204.5), it is very difficult to judge direction at this stage. As a consequence, the best thing we believe we can do right now is sit back and watch. Granted, one could potentially trade within this 4hr capped area, but we would much prefer to wait for the break to happen since the risk/reward would in fact be much larger.
A push above the current 4hr supply area would almost immediately expose the 4hr swap area at 1180.1-1177.8. We agree that if this was our target, the risk/reward would be terrible. That said, take note of the wick 1178.9 seen marked with a red arrow – this wick has already likely consumed a ton of offers at this area, and considering it was relatively deep, we’d be confident that this zone would eventually break and clear the path north up to the target 4hr supply seen marked with a pink circle at 1188.0-1185.5.
Conversely, should this market turn south and break below 1164.9, we believe that since demand at 1159.6-1165.6 has already likely been consumed by the NFP push lower on Thursday, price will now be free to attack the 4hr Quasimodo support level coming in below at 1149.68 (located within both the weekly demand area just discussed and the daily demand area at 1142.5-1154.5).
In closing, either a breakout north or south would need to see the following before we’re permitted to pull the trigger. First, a retest of the violated area that MUST be seen holding firm, and secondly, supporting lower timeframe confirmation would also need to accompany the retest.
Levels to watch/ live orders:
- Buys: Flat (Stop loss: N/A).
- Sells: Flat (Stop loss: N/A).


