Lower timeframe confirmation: simply means waiting for price action on the lower timeframes to confirm direction within a higher timeframe area. For example, some traders will not enter a trade until an opposing supply or demand area has been consumed, while on the other hand, another group of traders may only need a trendline break to confirm direction. As you can probably imagine, the list is endless. We, however, personally prefer to use the two methods of confirmation mentioned above in our trading.
EUR/USD:
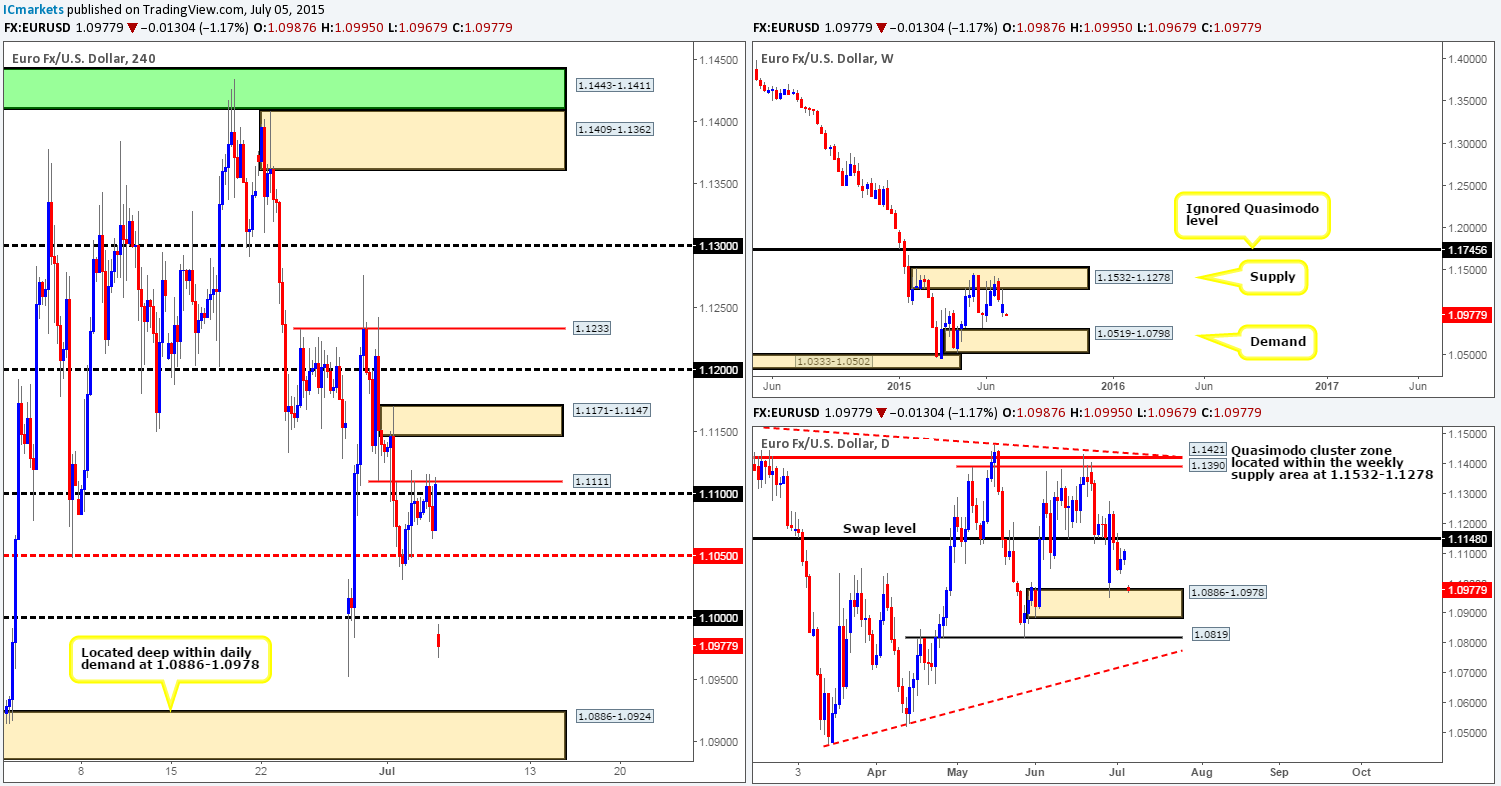
Weekly recap: The EUR/USD pair had quite an intense week last week as price battled with not only the ongoing Greek situation but also with the notoriously volatile NFP release as well. With that, however, the EUR surprisingly only lost a mere 49 pips into the close 1.1108. In the bigger (technical) picture, it is clear to see that price was held lower by a weekly supply area coming in at 1.1532-1.1278, which, going into Wednesday’s session, forced this market to trade below a historically respected daily swap level at 1.1148. The respect for this beast goes all the way back to 1997 so do have this level noted down! The 4hr timeframe on the other hand, shows that offers around 1.1111 (Tuesday’s low which was broken now acting as support) held price lower through Thursday’s NFP release, and also again going into Friday’s sessions.
Moving forward, we can see that Sunday’s open 1.0987 saw the EUR pair gap 120 pips as Greece votes ‘NO’ to austerity demands. This caused price to steam into the top-side of a daily demand at 1.0886-1.0978. Caution is advised entering long on the basis of this as the weekly chart still shows room to drop further down to at least the weekly demand at 1.0519-1.0798. At this point it is very difficult to tell what the market is thinking!
Due to the expected volatility, our team believes there will be a few difficult trading days ahead in the Euro market. Here are the levels we have noted so far:
For buys:
- 4hr demand at 1.0886-1.0924 (located deep within the aforementioned daily demand area).
For sells (possible retesting opportunities):
- Round number 1.1000.
- Mid-level number 1.1050.
- (If the gap is indeed filled watch for a reaction between 1.1100 and 1.1111.
Waiting for lower timeframe confirmation at the above said levels is highly recommended. Trade carefully.
Levels to watch/live orders:
- Buys: 1.0886-1.0924 [Tentative – confirmation required] (Stop loss: 1.0880).
- Sells: 1.1000 [Tentative – confirmation required (Stop loss: dependent on where one confirms this level) 1.1050 [Tentative – confirmation required (Stop loss: dependent on where one confirms this level) 1.1100/1.1111 [Tentative – confirmation required (Stop loss: dependent on where one confirms this level).
GBP/USD:
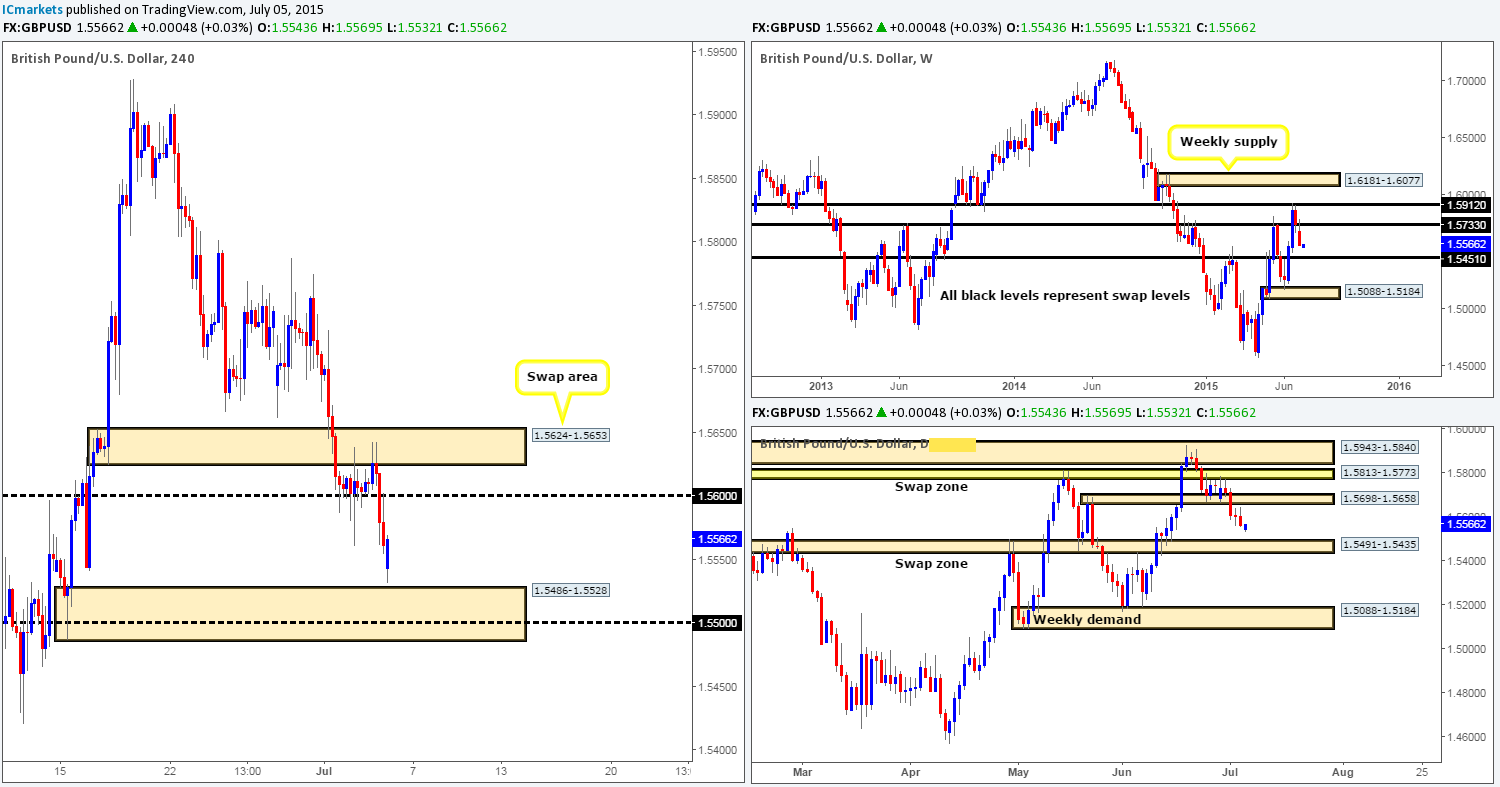
Weekly recap: The GBP/USD pair suffered once again last week as strong resistive pressure came into the market on a retest of a recently broken weekly timeframe swap level at 1.5733, consequently forcing price to close on its lows at 1.5561. Moving down to the daily chart, we can see that price aggressively closed below a daily swap area at 1.5698-1.5658 on Wednesday, which as you can probably see held nicely until Friday’s close. As we zoom into the 4hr timeframe, it’s clear that Friday’s action saw heavy offers come in from the confines of a 4hr swap area at 1.5624-1.5653. This move, as you can see, broke below and retested (we mentioned in Thursday’s analysis to watch for this to happen and attempt to trade it with lower timeframe confirmation) the round number 1.5600, and pierced Thursday’s NFP low 1.5560 by a pip.
In comparison to the EUR pair, this morning’s opening gap (filled already) at 1.5543 was mild. Price fell 18 pips which just missed connecting with the combined 4hr demand /round number area at 1.5486-1.5528/1.5500 by only a few pips.
In the bigger picture, it is clear that there is room to move south this week. The weekly timeframe shows little support until we reach the weekly swap level 1.5451. And by the same token, the daily timeframe also shows little support until price marries up with a daily swap zone coming in at 1.5491-1.5435. So, where does this leave us on the 4hr timeframe? Well, with the heavy dollar buying at the moment and the technical picture showing very little higher timeframe support, we’re going to place buys on the back burner for now. With regards to sells, there may be a potential shorting opportunity today at the 1.5600 region should price reach this high. However, be prepared for the possibility of a fakeout at this number up to the 4hr swap area at 1.5624-1.5653. This could catch a lot of traders off guard! Therefore, we would recommend waiting for the lower timeframes to confirm this number before jumping in.
Levels to watch/ live orders:
- Buys: Flat (Stop loss: N/A).
- Sells: 1.5600 Tentative – confirmation required (Stop loss: dependent on where one confirms this level).
AUD/USD:
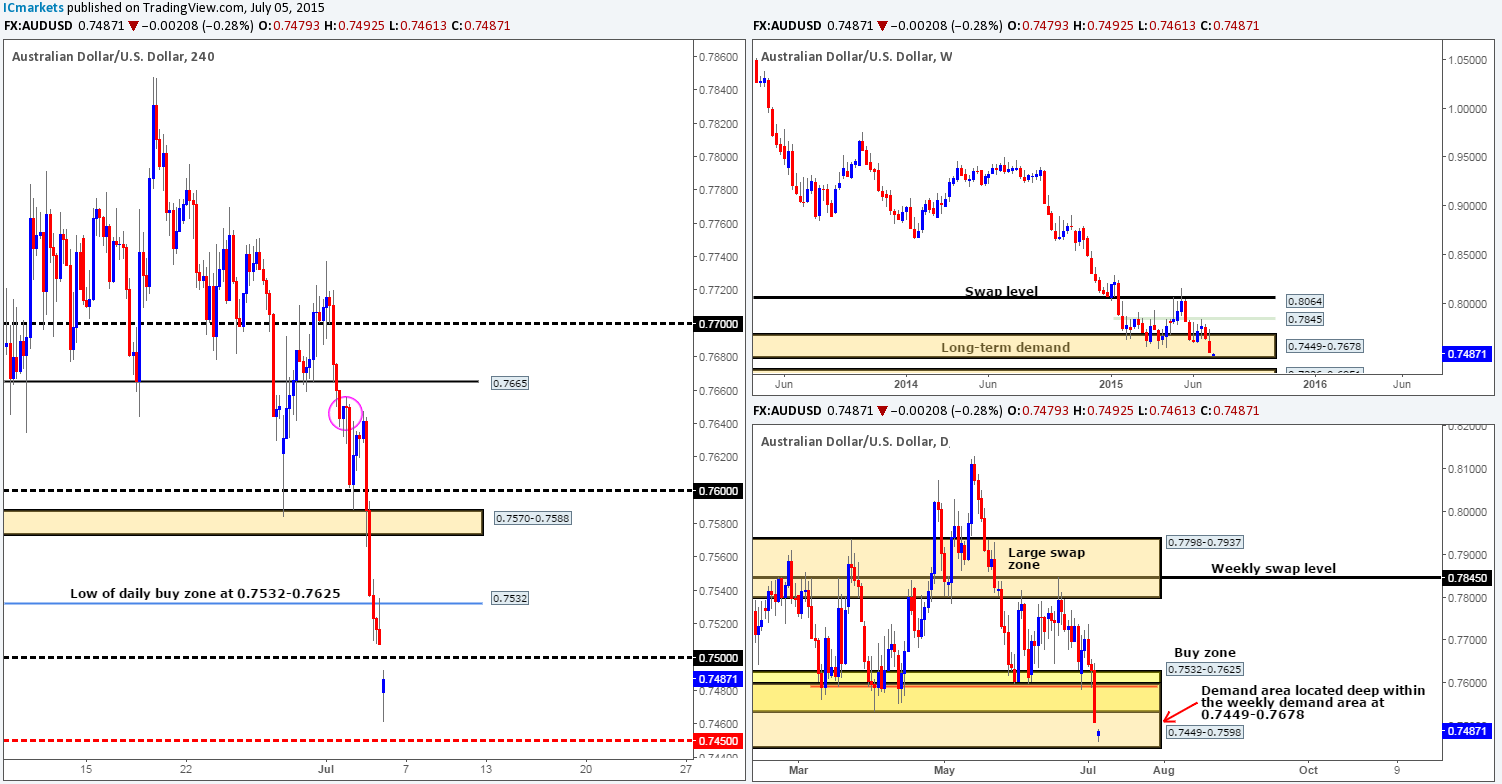
Weekly recap: Further damage was seen on the Aussie pair last week, as price dived deeper into a long-term weekly demand area at 0.7449-0.7678, shaving close to 145 pips off its value into the close 0.7507. This move also likely triggered a ton of sell stops on the daily timeframe due to price smashing through a daily buy zone at 0.7532-0.7625, which consequently forced price to enter into the jaws of a large daily demand area at 0.7449-0.7598 (positioned deep within the aforementioned weekly demand area). Moving on to our traded timeframe (4hr), price action shows that Friday’s descent from the 4hr supply area at 0.7650-0.7637 (circled) took out several 4hr technical levels during its onslaught, and as a result closed within shouting distance of the round number 0.7500.
This morning’s trade opened 28 pips lower that Friday’s close (0.7507) at 0.7479, taking out the 0.7500 handle and diving to a low (at the time of writing) of 0.7461.From a technical perspective, this pair is in oversold territory from where we’re standing. Both the weekly and daily timeframes still show price trading in demand (see above for levels) which could help push this market north this week. However, with price now lurking below 0.7500, and the recently broken daily buy zone low at 0.7532, it is difficult to condone buying this pair at this time. For us to trade, we need concrete space to our target!
Therefore, with everything taken into consideration, our team has decided that the best position to take on this pair right now is to remain flat at least until more conducive price action presents itself.
Levels to watch/ live orders:
- Buys: Flat (Stop loss: N/A).
- Sells: Flat (Stop loss: N/A)
USD/JPY:
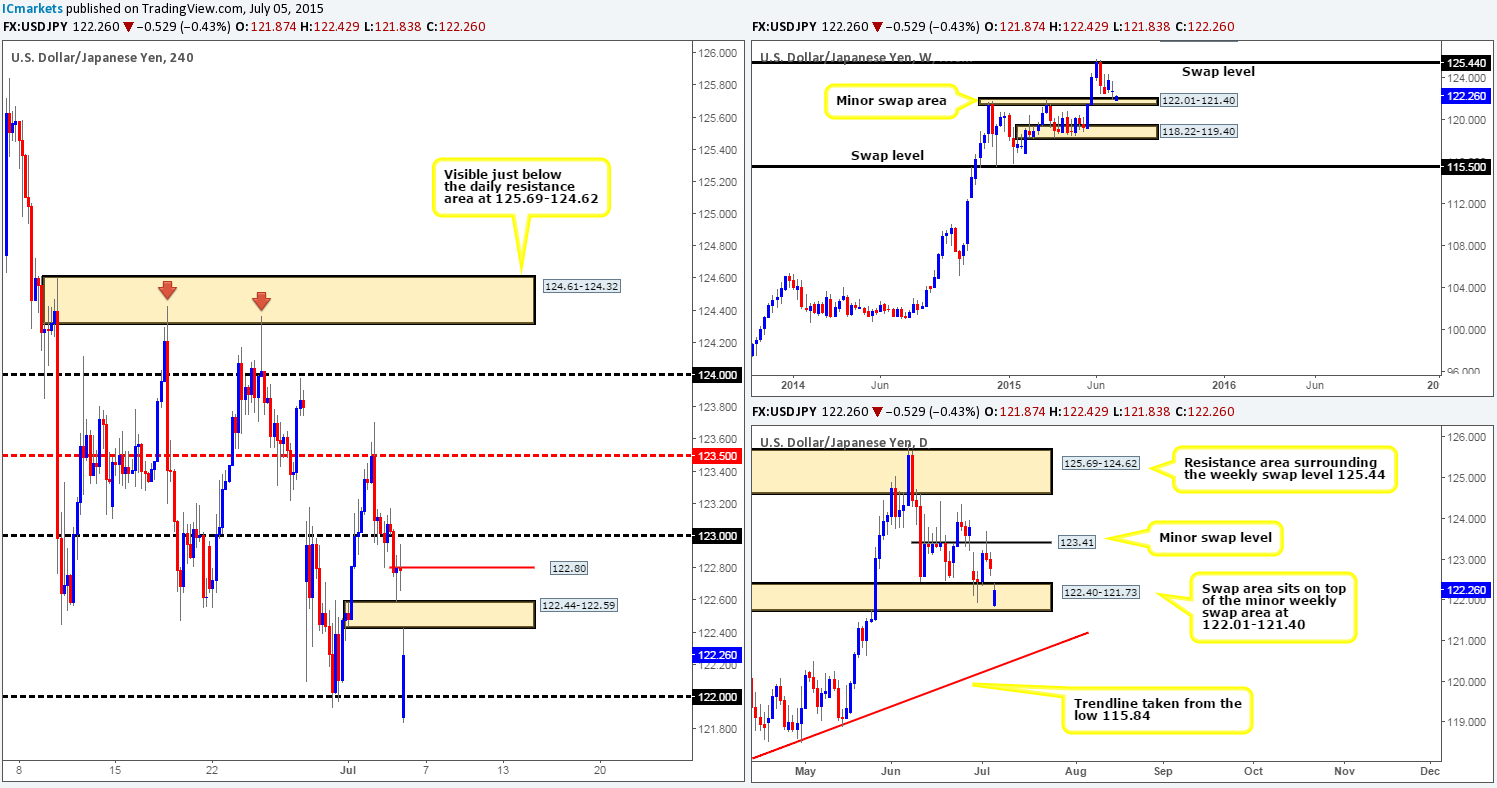
Weekly recap: The USD/JPY ended the week rather neutral with price forming a weekly indecision candle on top of a minor weekly swap area at 122.01-121.40 going into the close 122.78. The daily timeframe shows that the weekend gap from last week was eventually filled which saw strong offers come into the market from a minor daily swap level at 123.41. Looking to the 4hr timeframe, we can see that price took out the 123.00 number and attacked a small, yet clearly resilient 4hr demand area at 122.44-122.59.
This morning’s open 121.87 saw the Japanese Yen rally as investors flocked to safe-haven assets after Greece collectively voted ‘no’ to the terms of a bailout. With that, however, the USD quickly reversed, consequently forcing price to cross swords with a 4hr swap area coming in at 122.44-122.59.
Technically, this market is still in a strong weekly uptrend, and price is now, as you can see, positioned deep within both a weekly swap area mentioned above and a daily swap area at 122.40-121.73. Therefore, from this standpoint, the market does have upside potential. Nonetheless, the wire will likely be filled with rumors today/this week, which could cause this pair to continue falling.
The levels we currently have our eye on for confirmed trades are as follows:
For buys:
- Round number 122.00.
- 4hr demand area at 121.44-121.52 (located just below the daily swap area mentioned above).
For sells:
- 4hr swap area at 122.44-122.59.
- 4hr supply level 122.80.
- The Round number 123.00.
Levels to watch/ live orders:
- Buys: 122.00 [Tentative – confirmation required] (Stop loss: dependent on where one confirms this level) 121.44-121.52 [Tentative – confirmation required] (Stop loss: 121.41).
- Sells: 122.44-122.59 [Tentative – confirmation required] (Stop loss: 122.63) 122.80 [Tentative – confirmation required] (Stop loss: dependent on where one confirms this level) 123.00 [Tentative – confirmation required] (Stop loss: dependent on where one confirms this level).
USD/CAD:
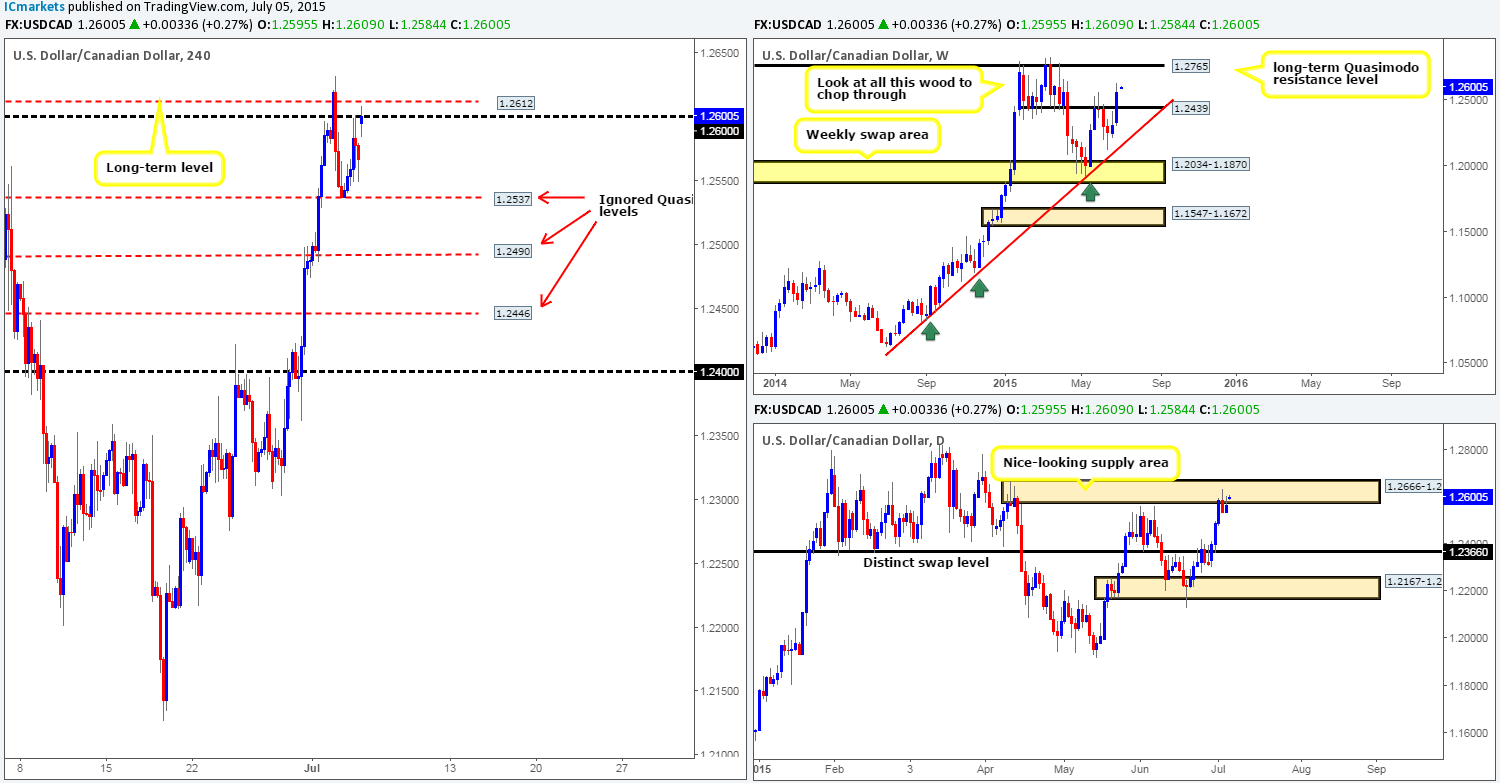
Weekly recap: The USD/CAD broke higher last week smashing through a weekly swap level at 1.2439, gaining about 250 pips into the close 1.2566. However, let’s all not get too excited by this as there is still a ton of wood to chop through seen between 1.2439/1.2765. In addition to this, price was also seen stalling around the underside of a daily supply area at 1.2666-1.2573 towards the end of the week. With Thursday’s NFP result dragging this pair lower, the 4hr timeframe reveals that supportive bids came in literally to-the-pip at an ignored 4hr Quasimodo level at 1.2537 on Friday. This move pushed price back up to 1.2600 where strong offers held this market lower into the week’s close.
The open 1.2595 saw price gap 29 pips north this morning back up to test the round number 1.2600. Now, considering the location of price on the higher timeframe picture at the moment (see above), we are still bearish on this pair. As such, our objective for today is simple. Watch lower timeframe price action carefully around the 1.2600/1.2612 area for confirmed short entries. If all goes well, we’d consider adding to this short position as the week progresses. Troublesome hurdles to keep an eye on are the three ignored 4hr Quasimodo levels below at 1.2537/1.2490/1.2446.
Levels to watch/ live orders:
- Buys: Flat (Stop loss: N/A).
- Sells: 1.2612/1.2600 [Tentative – confirmation required] (Stop loss: dependent on where one confirms this area).
USD/CHF:
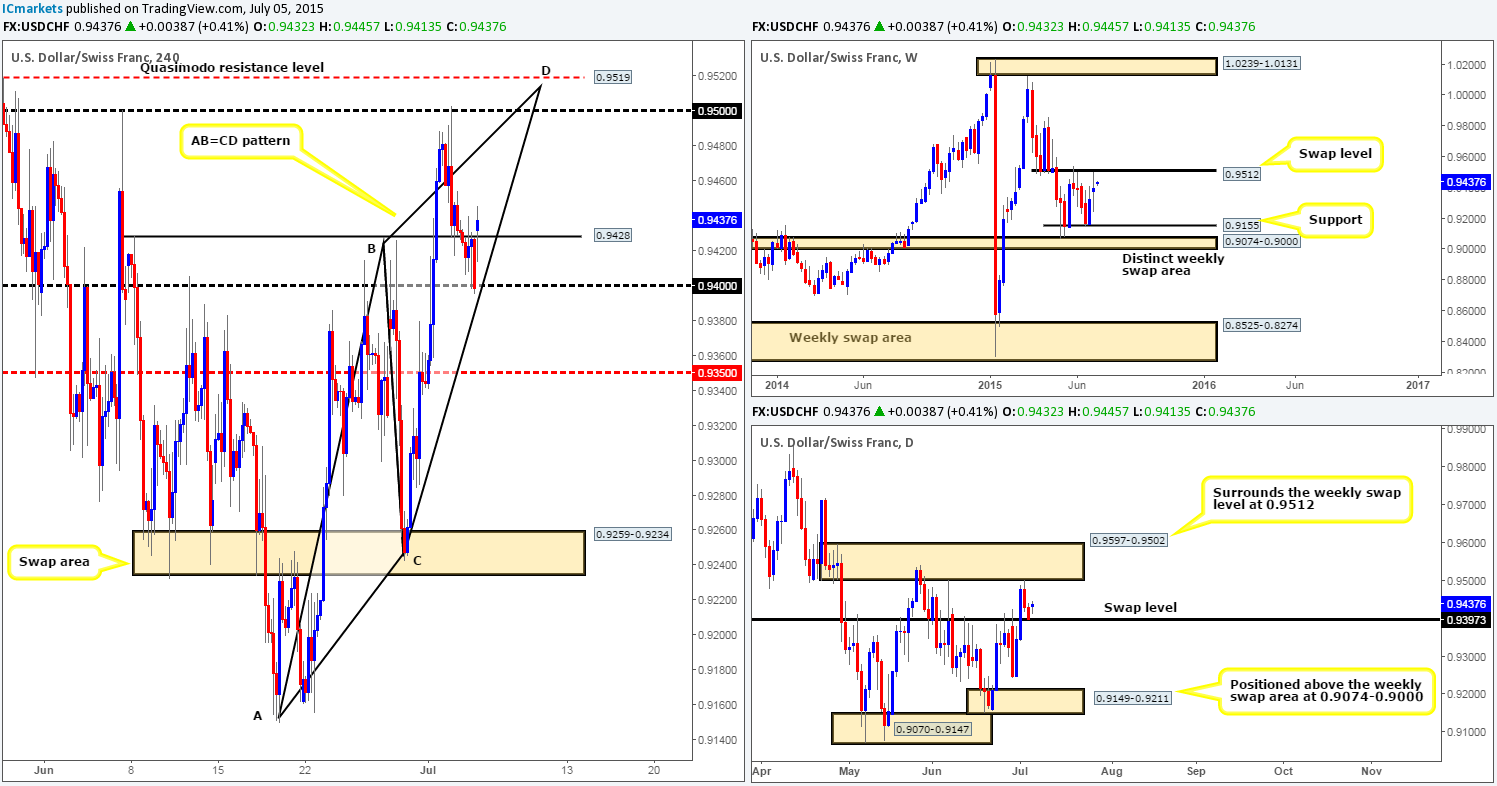
Weekly recap: Like the USD/JPY pair, the USD/CHF also ended the week rather neutral, printing a weekly indecision candle at the underside of a weekly swap level at 0.9512 into the close 0.9398. Daily action on the other hand, reveals that price sold off on Thursday-Friday from a daily supply area at 0.9597-0.9502 down to a daily swap level coming in at 0.9389. Moving down to the 4hr timeframe, price was seen breaking through a 4hr swap level at 0.9428, which was retested as resistance before plummeting down to the 0.9400 region.
Sunday’s price action begun with a 34 pip move north, forcing price back above a 4hr swap level coming in at 0.9428. This move may have potentially opened the gates for further upside towards the round number 0.9500, or even the 4hr Quasimodo resistance level just above it at 0.9519.
Should a rally higher take place, we’d be reluctant to buy due to how close price is trading to the aforementioned weekly swap level. Nonetheless, we would be very interested in selling this pair with lower timeframe confirmation between the 0.9500/0.9519 area this week, since at that point the following would be in our favor:
- Price would be nibbling at the weekly swap level (0.9512).
- Price would also be trading within daily supply (0.9597-0.9502).
- 0.9519 (a 4hr Quasimodo resistance level) provides this market a beautiful fakeout barrier above 0.9500 to repel price.
- A 4hr Harmonic AB=CD pattern completes right at the point of our 4hr Quasimodo resistance level.
Levels to watch/ live orders:
- Buys: Flat (Stop loss: N/A).
- Sells: 0.9500/0.9519 [Tentative – confirmation required] (Stop loss: dependent on where one confirms this area).
DOW 30:
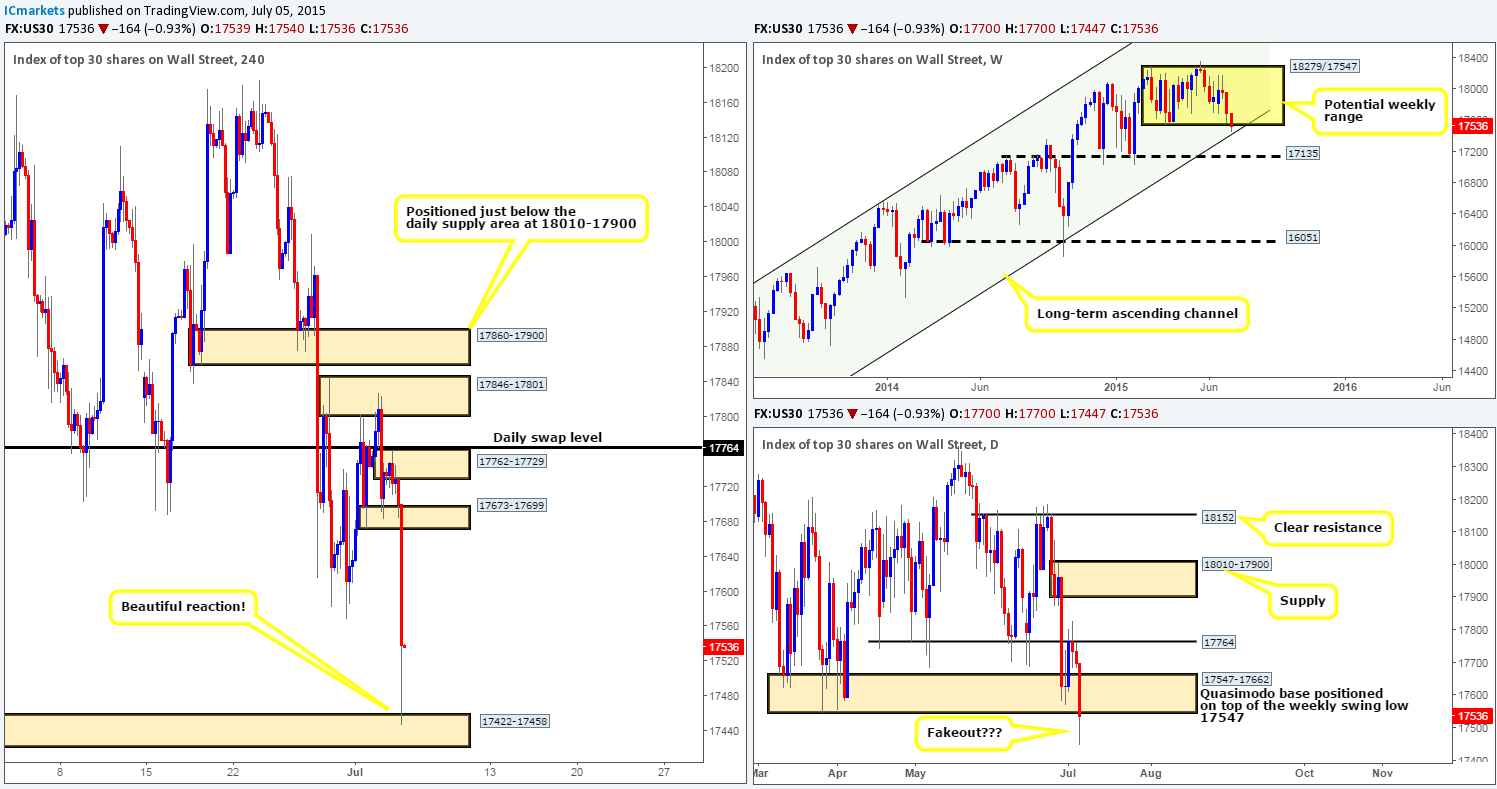
Weekly recap: Overall, the DOW 30 index lost 262 points on the week, closing at 17700. This action saw price break the lower limits of the weekly range (18279/17741) and just miss connecting with the weekly swing low at 17547. With this, we have decided to expand the range on this timeframe to 18279/17547. The move lower also pushed price deep into a daily timeframe Quasimodo support base at 17547-17662. Strong bids were clearly sitting in wait here, however, as price was pushed back up to the recently broken daily support level 17764, which as you can see held as resistance going into the weekend.
Similar to last week, this morning’s open 17700 saw the floor literally drop from this index, as prices plummeted (at the time of writing) 253 points stabbing below both the recently adapted weekly range, and the aforementioned daily Quasimodo base. It was only once price collided with a small, almost ‘kink like’ 4hr demand area at 17422-17458, did we see this market begin to reverse.
With all of the above taken into consideration, we believe that as long as the daily candle closes back within the aforementioned daily Quasimodo base, then this market may see further upside this week on the basis that the recent spike lower may have just been one huge fakeout . With that being said, we’re going to humbly take a step back here and let price do its thing today, since as far as we can see there are no logical safe entries into this market for the time being.
Levels to watch/ live orders:
- Buys: Flat (Stop loss: N/A).
- Sells: Flat (Stop loss: N/A).
XAU/USD: (Gold)
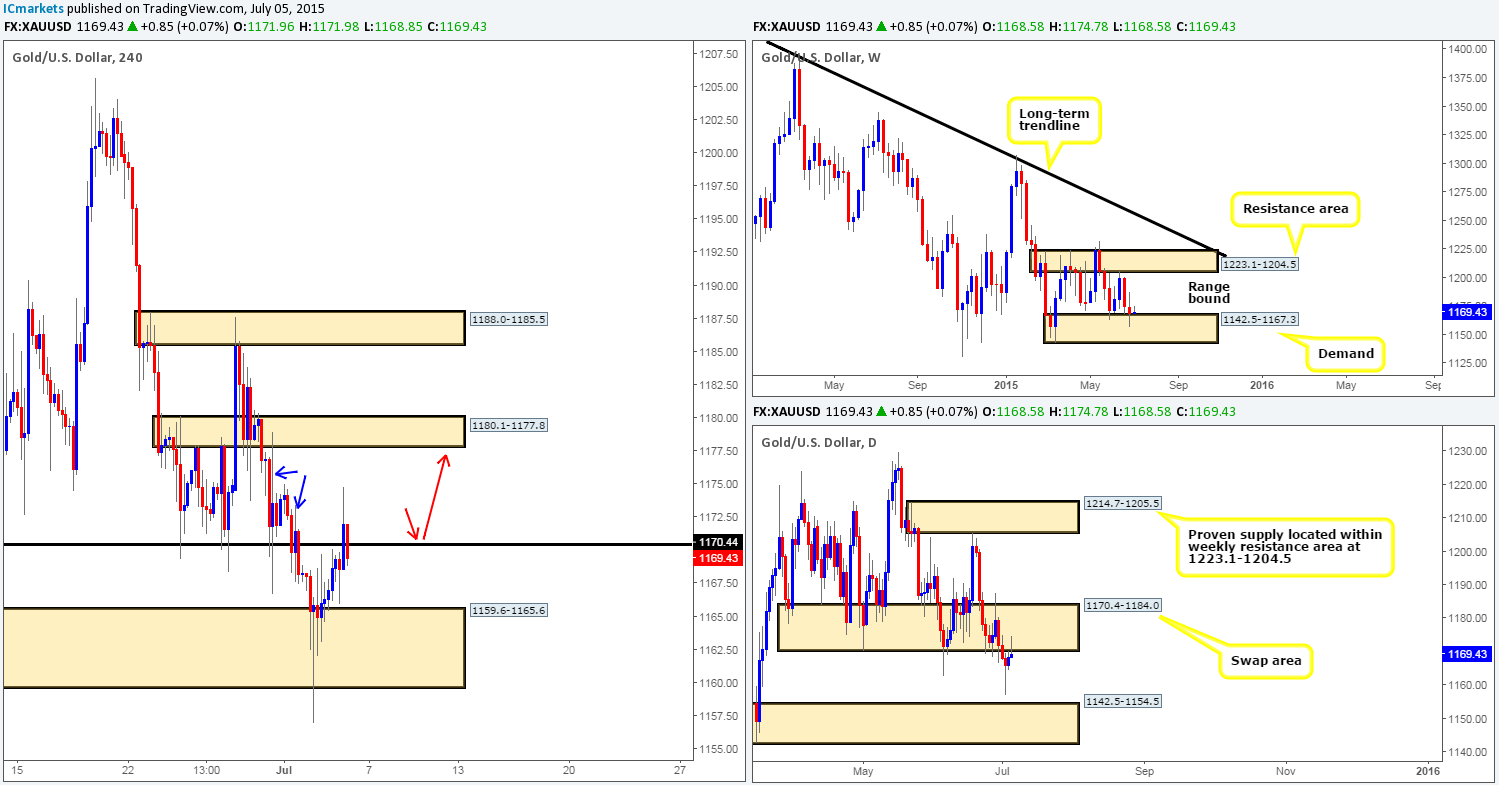
Weekly recap: The Gold markets dropped 630 pips (or $6.30) during the course of last week. However, looking at the weekly timeframe, price managed to hold firm above a weekly demand area coming in at 1142.5-1167.3, which currently forms the lower limit of the weekly range (1142.5-1167.3/ 1223.1-1204.5). The daily timeframe on the other hand was not so positive. Buyers were consumed on Wednesday as price broke below a daily support zone seen at 1170.4-1184.0, thus potentially opening the path south for a run down to the daily demand area at 1142.5-1154.5 (located deep within the aforementioned weekly demand area). From the 4hr action, we can see that Friday’s close 1168.5 saw price hover below 1170.4 – the lower limit of the daily swap area 1170.4-1184.0, which initially we thought may get broken during Friday’s trade.
This morning, nonetheless, saw strong bids enter the market at the open 1168.5, resulting in price breaking above 1170.4, which as we can all see is being aggressively retested as support right now. If this number holds we may see price head towards the 4hr swap area seen at 1180.1-1177.8, which would provide us with a nice base in which to look for confirmed buys into this market. The reason for believing price could reach this high from here simply comes from the wicks marked with blue arrows at 1173.3/1178.9. These spikes represent what we like to call supply consumption wicks, in other words – supply has already very likely been consumedJ. Of course none of this matters if the buyers do not manage to hold out above 1170.4!
Should 1170.4 fail to hold on the other hand, this will likely force prices back down to the already weak looking 4hr demand area at 1159.6-1165.6. If this happens, we’d likely consider shorting this market down to a 4hr Quasimodo level at 1149.6 (located deep within both weekly and daily demand areas mentioned above). The plan is that any shorts taken will be liquidated a little before 1149.6, where at which point we’d shift over to looking for confirmed longs into this market as this is a very high probability turning point.
Levels to watch/ live orders:
- Buys: 1149.6 if price manages to hold above 1170.4 [Tentative – confirmation required] (Stop loss: dependent on where one confirms this level) 1149.6 [Tentative – confirmation required] (Stop loss: dependent on where one confirms this level).
- Sells: Flat (Stop loss: N/A).


