
EUR/USD:
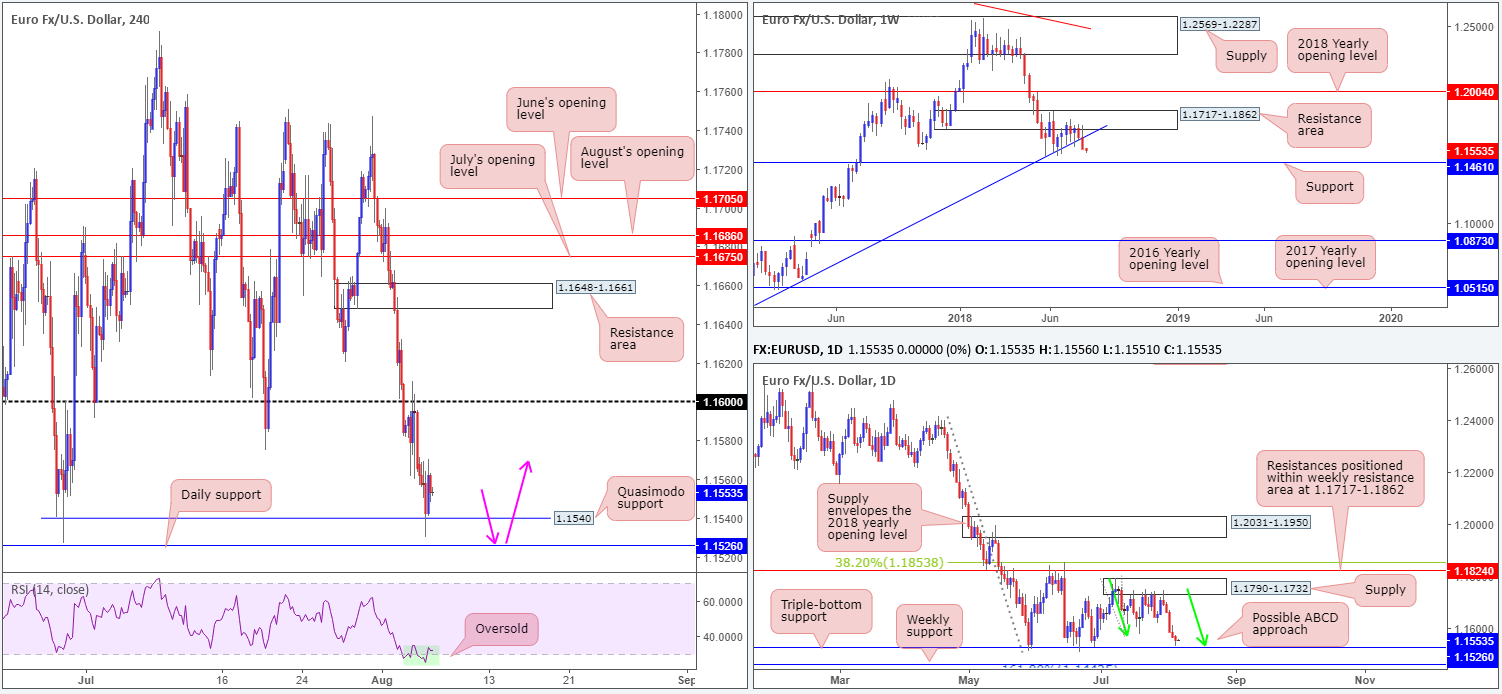
The single currency witnessed an additional wave of selling on Monday against its US counterpart. Although registering a fifth consecutive daily loss, H4 price has, as you can see, respected nearby Quasimodo support priced in at 1.1540. Note, however, the response was far from perfect, given a near-touch of nearby triple-bottom daily support at 1.1526! Also notable on the H4 scale, the RSI indicator is seen displaying oversold values.
The daily triple-bottom support mentioned above at 1.1526 is an enticing barrier, as it happens to converge with an ABCD completion (see green arrows). The only drawback to buying this line, though, can be seen on the weekly scale. Flavor for EUR/USD longs soured over the course of last week after jabbing the underside of a resistance area seen at 1.1717-1.1862, forcing weekly price beneath trend line support (taken from the low 1.0340). Beneath here, there’s a clear run towards support at 1.1461.
Areas of consideration:
Despite weekly action suggesting lower prices may be on the cards, a bounce from the aforementioned daily support level remains a high-probability trade, in our humble view (pink arrows).
Those long from the current H4 Quasimodo support will, assuming our read is correct, likely be stopped out today as daily traders attempt to load up on longs from the noted daily support level. The ultimate upside target from 1.1526 can be seen around daily supply at 1.1790-1.1732. Before reaching this target, nevertheless, expect active selling to reside around the 1.16 handle on the H4 timeframe and the collection of monthly opening levels seen directly above it between 1.1705/1.1675.
Today’s data points: Limited.
GBP/USD:
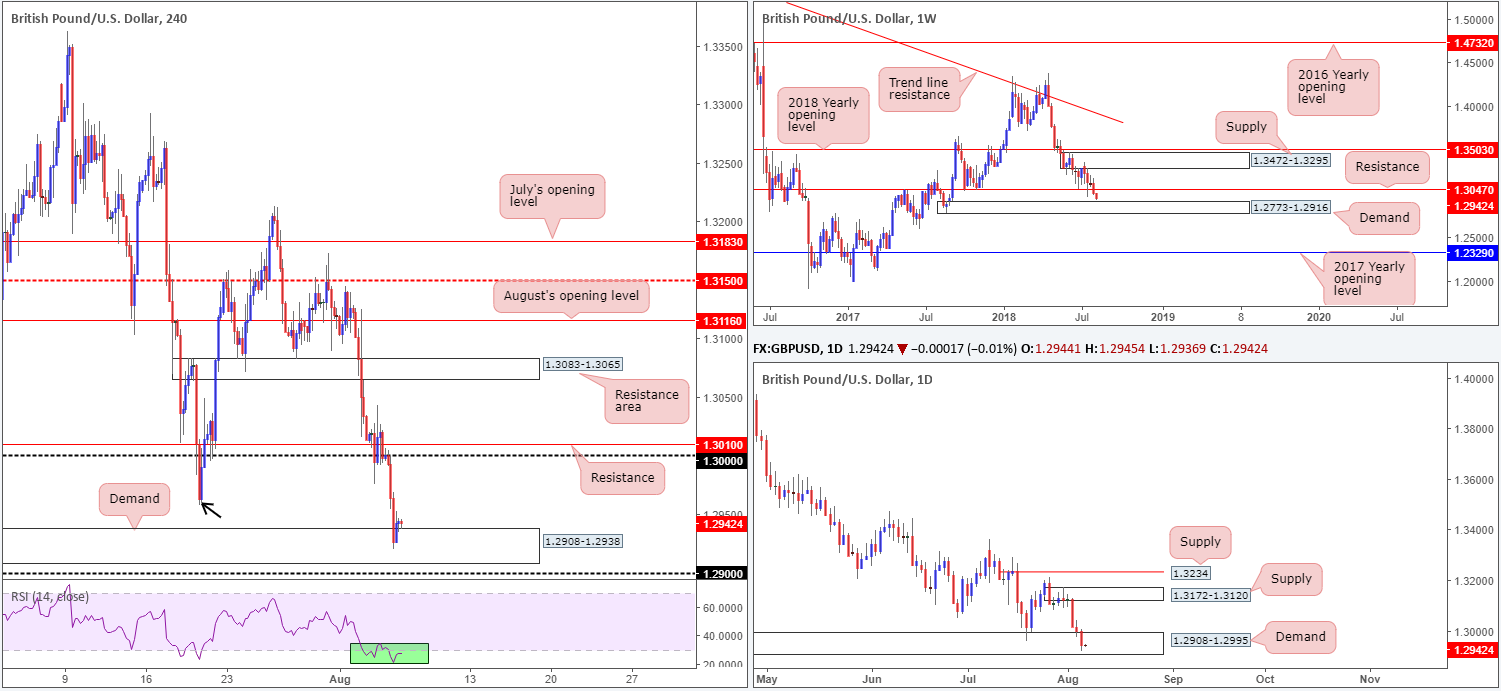
The British pound continued to ‘feel the heat’ on the Monday in the wake of last week’s BoE policy meeting on a combination of ‘dovish’ rate guidance and concern about a no-deal or hard Brexit. According to UK’s international Trade Secretary Liam Fox, chances of a no-deal Brexit is now around 60%.
While the political situation in the UK is not the prettiest right now, the technical picture shows strong demand in view. Yesterday’s selling pulled the H4 candles towards demand coming in at 1.2908-1.2938 (also see the RSI indicator on this timeframe is testing oversold waters). Although formed all the way back in early September of 2017, this H4 area boasts strong momentum from its base, thus indicating possible strength. What’s also interesting here is this H4 zone is seen positioned within the lower limits of a daily demand base coming in at 1.2908-1.2995, which also happens to be bolstered by the top edge of a weekly demand area drawn from 1.2773-1.2916.
Areas of consideration:
As is evident from the H4 timeframe, the current demand zone is being respected. Although our eyes are drawn to the 1.30 figure as the next upside target from here, the July 19 low marked with a black arrow at 1.2959 may act as resistance also.
We’re sure you’ll agree this market is a troubled one. While we do have muscular demand in the fight, potential nearby resistance on the H4 timeframe (also clearly visible on the daily scale as well) and a bearish fundamental picture unfortunately makes this a difficult buy, in our humble view. For that reason, we’ve labelled this market ‘flat’ going into today’s session.
Today’s data points: Halifax HPI m/m.
AUD/USD:
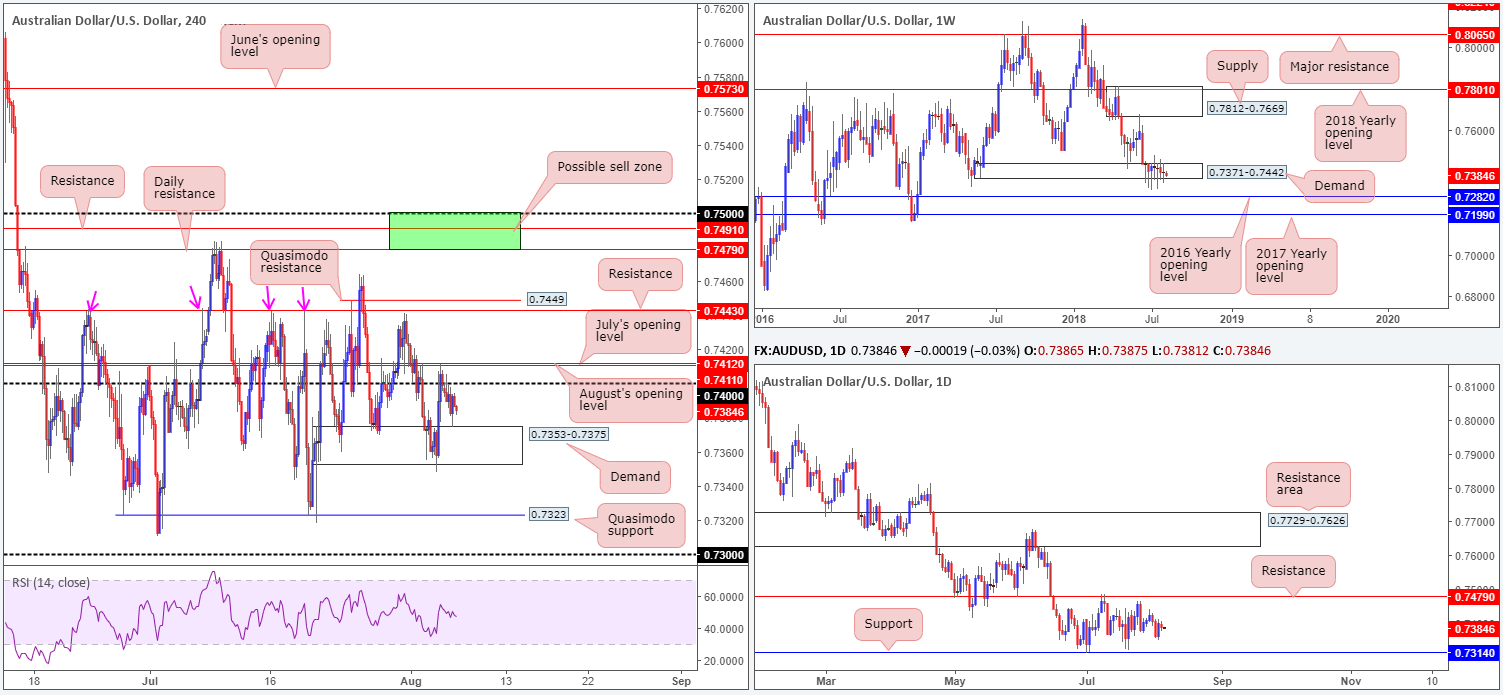
Coming in from the top this morning, weekly demand at 0.7371-0.7442, as you can see, remains in a fragile state at the moment, opening the window to a possible test of the 2016 yearly opening level at 0.7282 sometime down the road. In the event the bulls regain consciousness, however, a retest of weekly supply at 0.7812-0.7669 may eventually be on the cards.
The reason behind the lack of movement on the weekly timeframe, technically that is, likely has something to do with the fact daily flow continues to respect its current range. Since early July, the commodity currency has fluctuated between support drawn from 0.7314 and resistance chalked up at 0.7479.
In terms of Monday’s movement on the H4 timeframe, the underside of the 0.74 handle maintained resistance and forced the unit towards demand marked at 0.7353-0.7375.
H4 structure remains restricted right now. Between 0.7412 (August’s opening level) and 0.7443 (a resistance level), one has less than 30 pips to play with, whereas between the 0.74 handle and the current demand, there’s even less room! A break through this demand has Quasimodo support at 0.7323 to target, followed closely by the daily support mentioned above at 0.7314 – again, limited room to maneuver.
Areas of consideration:
Unless you’re a lower-timeframe trader, content with 15/20-pip moves, this is a challenging market to trade at this time.
On the data front, the RBA is set to release their latest rate statement in early Asia, with the Australian central bank widely expected to remain on hold on interest rates until the later quarters of 2019. Therefore, today’s statement is unlikely to provide much impetus for traders.
Today’s data points: RBA rate statement and rate decision.
USD/JPY:
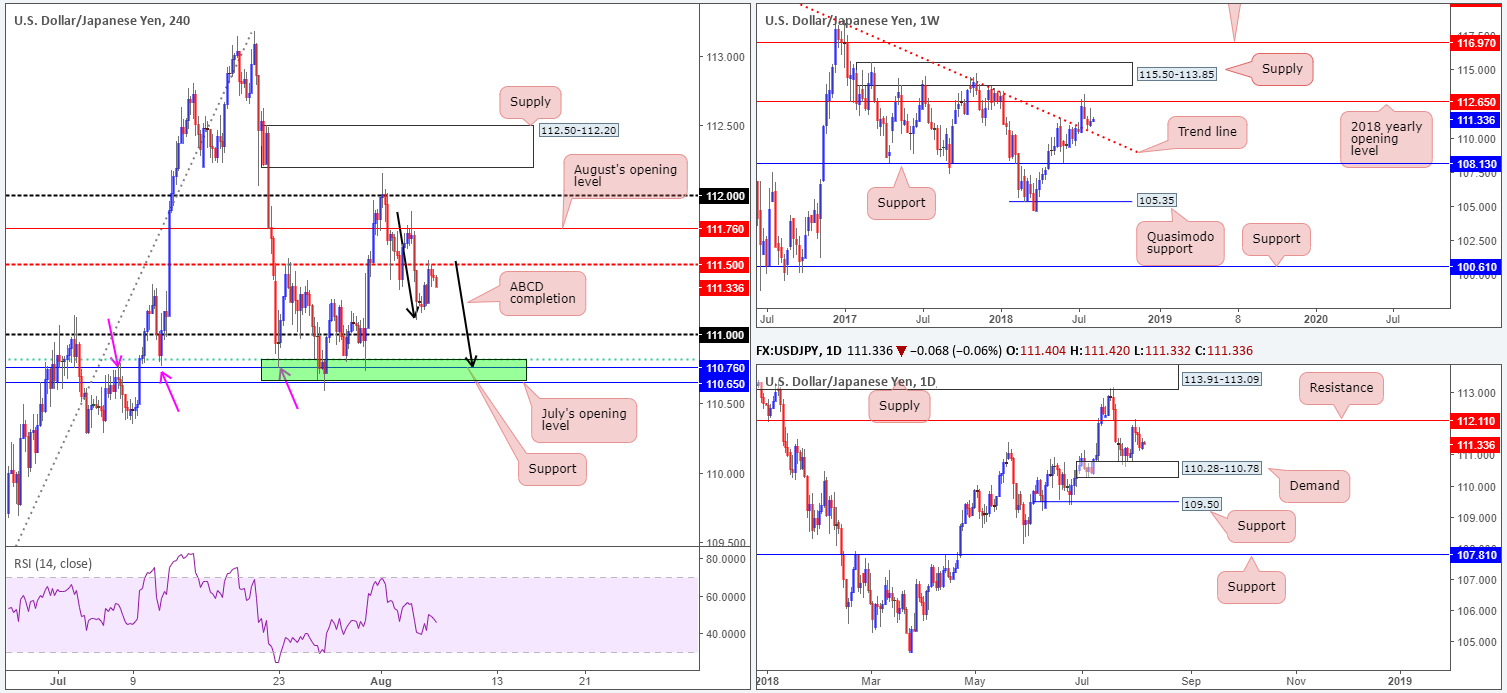
USD/JPY advanced modestly on Monday as a scarce macroeconomic calendar kept investors sidelined. Intraday movement on the H4 timeframe, however, did shake hands with mid-level resistance at 111.50 in early US trade, consequently capping upside into the closing bell.
While traders are likely honing in on 111 today, the team has noted to keep a close eye on the green area marked below it at 110.65/110.81 for possible longs. Why we like this area comes down to its following construction:
- July’s opening level at 110.65.
- H4 support at 110.76.
- 61.8% H4 Fib support at 110.81.
- Potential H4 ABCD completion (black arrows).
Also bear in mind the top edge of daily demand at 110.28-110.78 converges with 110.65/110.81. In addition to this, we can see the current weekly trend line resistance-turned support (taken from the high 123.57) intersects with the lower edge of the daily zone.
Areas of consideration:
On account of the above, 110.65/110.81 is an area of interest for possible buy trades today/this week (conservative stops can be placed around the 110.57 neighborhood). A H4 close back above 111 from this area would, in our view, be a solid cue to begin thinking of reducing risk to breakeven and taking partial profits off the table.
Today’s data points: Limited.
USD/CAD:
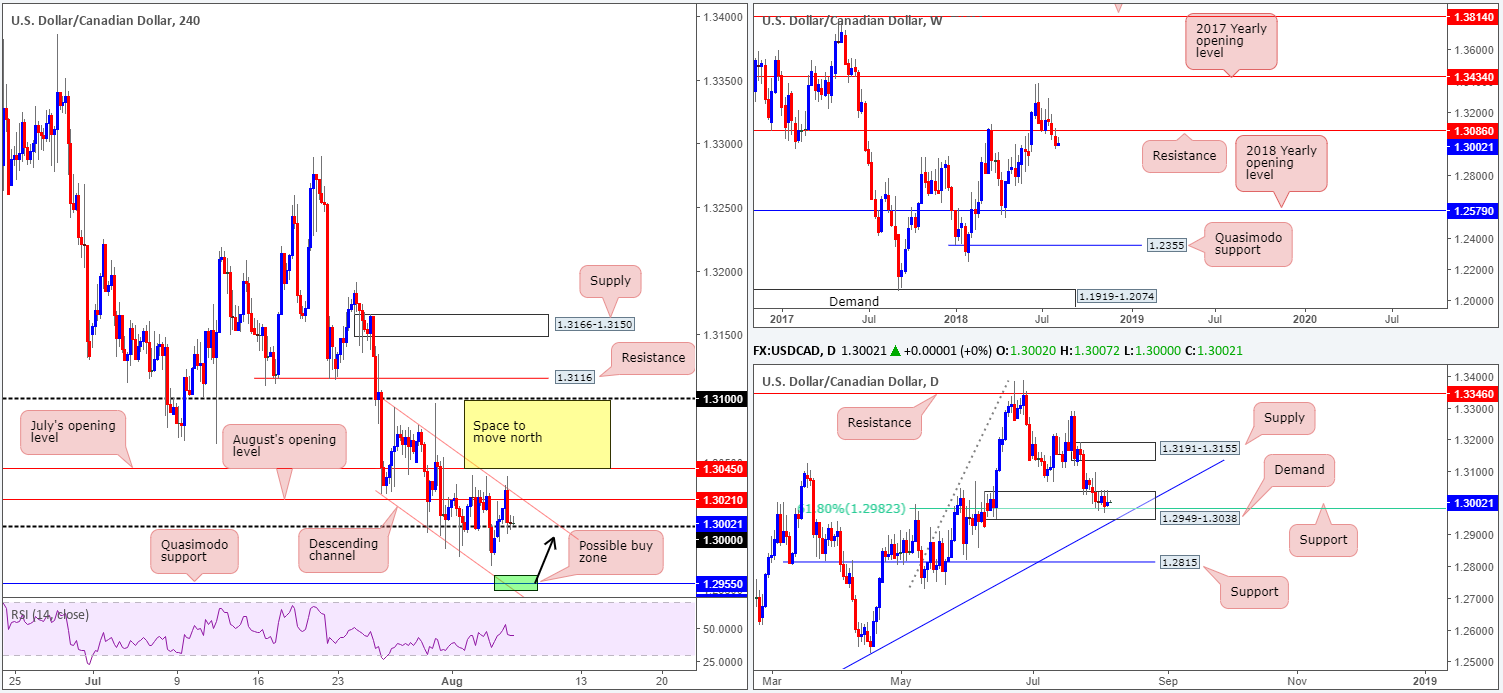
Try as it might, H4 price failed to sustain gains beyond August’s opening level at 1.3021 and the channel resistance edge (taken from the high 1.3093) on Monday. In consequence, this forced the unit back into defensive mode, retreating to the key figure 1.30 and ending the day pretty much unchanged.
Meanwhile, over on the bigger picture, weekly movement continues to establish a home beneath the underside of a recently engulfed support at 1.3086 (now acting resistance). In terms of obvious support beneath 1.3086, we do not see a whole lot stopping this market from reaching as far south as 1.2579: the 2018 yearly opening level. On the other side of the field, nevertheless, daily price remains toying with a rather attractive demand area visible at 1.2949-1.3038. Within this area we also see a 61.8% Fib support value at 1.2982. Another key structure to note on this scale is the nearby trend line support (etched from the low 1.2247). The next upside target from the current demand area falls in around supply fixed at 1.3191-1.3155.
Areas of consideration:
Buying from 1.30 today is not a trade we’d label high probability, due to heavy H4 resistance seen nearby. Not only is there August’s opening level and channel resistance in view, July’s opening level seen above here at 1.3045 has yet to enter the fray! According to this structure, a H4 close above July’s level is required before longs are considered.
Should 1.30 give way, on the other hand, the next support target on the H4 timeframe falls in at 1.2955: a Quasimodo support that converges closely with H4 channel support (etched from the low 1.3024). Given this level also resides within the lower limits of the current daily demand and nearby the daily trend line support, longs from this region are an option today we believe. Should this line come into play, stop-loss orders can be positioned BENEATH daily demand around 1.2945 (a 10-pip stop), targeting the 1.30 barrier as the initial take-profit zone (45 pips) – incredibly attractive risk/reward!
Today’s data points: CAD Ivey PMI.
USD/CHF:
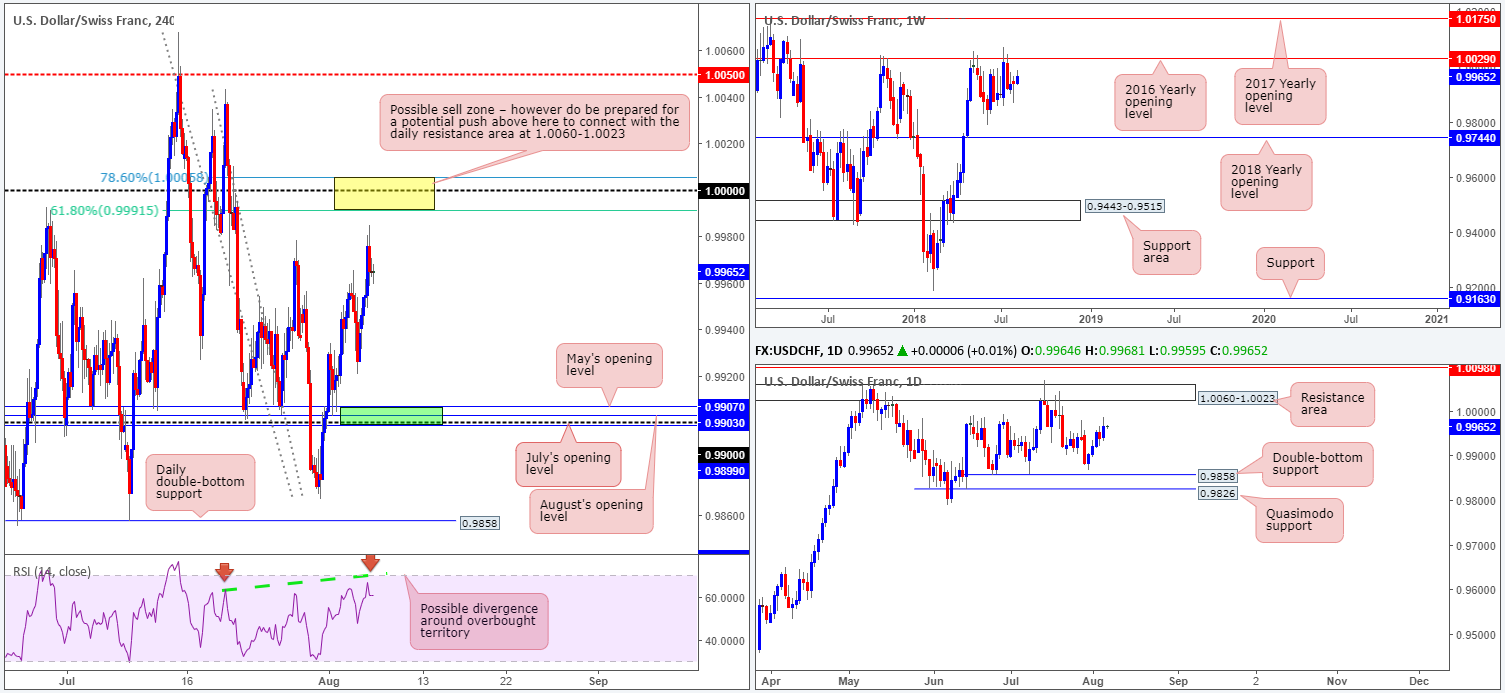
Persistent USD demand helped lift the USD/CHF higher on Monday, consequently breaking through the July 27 high at 0.9978 and potentially setting the stage for a run up to parity (1.0000) on the H4 timeframe. Surrounding this widely watched psychological number are two Fibonacci ratios: 78.6% at 1.0005 and 61.8% at 0.9991 (yellow zone). What’s also notable from a technical perspective on this scale is possible RSI divergence around overbought territory. Another area that remains ‘stand out’ on the H4 timeframe can be seen in green at 0.9899/0.9907 (comprised of July’s opening level at 0.9899, the 0.99 handle, August’s opening level, a 61.8% Fib support and May’s opening level at 0.9907).
Turning our attention to the higher timeframes, weekly price appears poised to retest key resistance at 1.0029: the 2016 yearly opening level. Holding price lower on two occasions in 2017, and twice already in 2018, this level commands attention! The story on the daily scale shows price action heading in the direction of 1.0060-1.0023: a resistance area that encapsulates the 2016 yearly opening level mentioned above on the weekly timeframe at 1.0029.
Areas of consideration:
On the whole, our attention remains fixed on 1.0000 this morning. Before considering a short from this region, nonetheless, traders are urged to wait for additional H4 candle confirmation, preferably a full or near-full-bodied bearish candle. The reason being is round numbers tend to attract ‘stop runs’ (fakeouts). Additionally, there’s also a chance of price ignoring 1.0000 and heading for the weekly 2016 yearly opening level mentioned above at 1.0029, which, as we already know, is captured within the walls of a daily resistance area at 1.0060-1.0023.
Today’s data points: Limited.
Dow Jones Industrial Average:
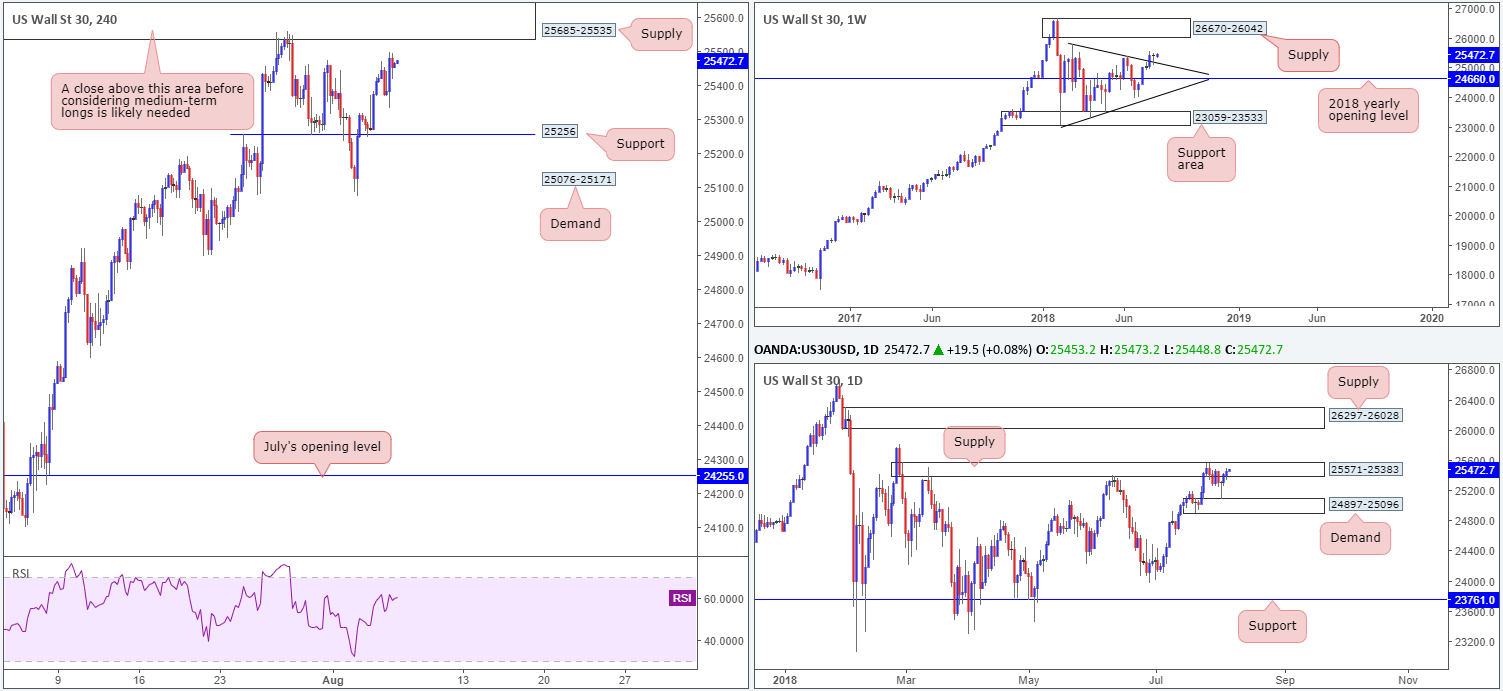
Upbeat earnings from Berkshire Hathaway improved market sentiment on Monday, allowing the DJIA to register its third consecutive bullish gain. As a result of this, H4 players likely have their crosshairs’ fixed on nearby supply coming in at 25685-25535.
Before we reach this H4 area, though, buyers will need to contend with daily supply penciled in at 25571-25383. A crack above this barrier has another layer of daily supply to target at 26297-26028. Supporting buyers in this market, however, is the weekly timeframe. Weekly price recently retested broken trend line resistance-turned support (etched from the high 25807) in the shape of a reasonably nice-looking bullish pin-bar formation. From this point, a run up to supply coming in at 26670-26042 is a possible scenario to keep tabs on this week.
Areas of consideration:
With weekly action indicating additional bullish sentiment, and daily flow hovering within the walls of a supply, neither a long nor short seems attractive right now. It’s also worth remembering H4 structure displays supply at 25685-25535, which happens to be positioned around the top edge of the current daily supply.
Technically speaking, waiting for H4 price to CLOSE above the current supply zone before considering longs in this market (from current price that is) remains a logical route. A retest to the top edge of this zone that holds firm will likely be enough to draw in buyers and bring the unit towards the aforesaid weekly supply, and is therefore a viable long setup to keep eyes on going forward.
Entering short at the current daily supply is visibly a chancy move, given we know where we’re coming from on the weekly timeframe!
Today’s data points: Limited.
XAU/USD (Gold)
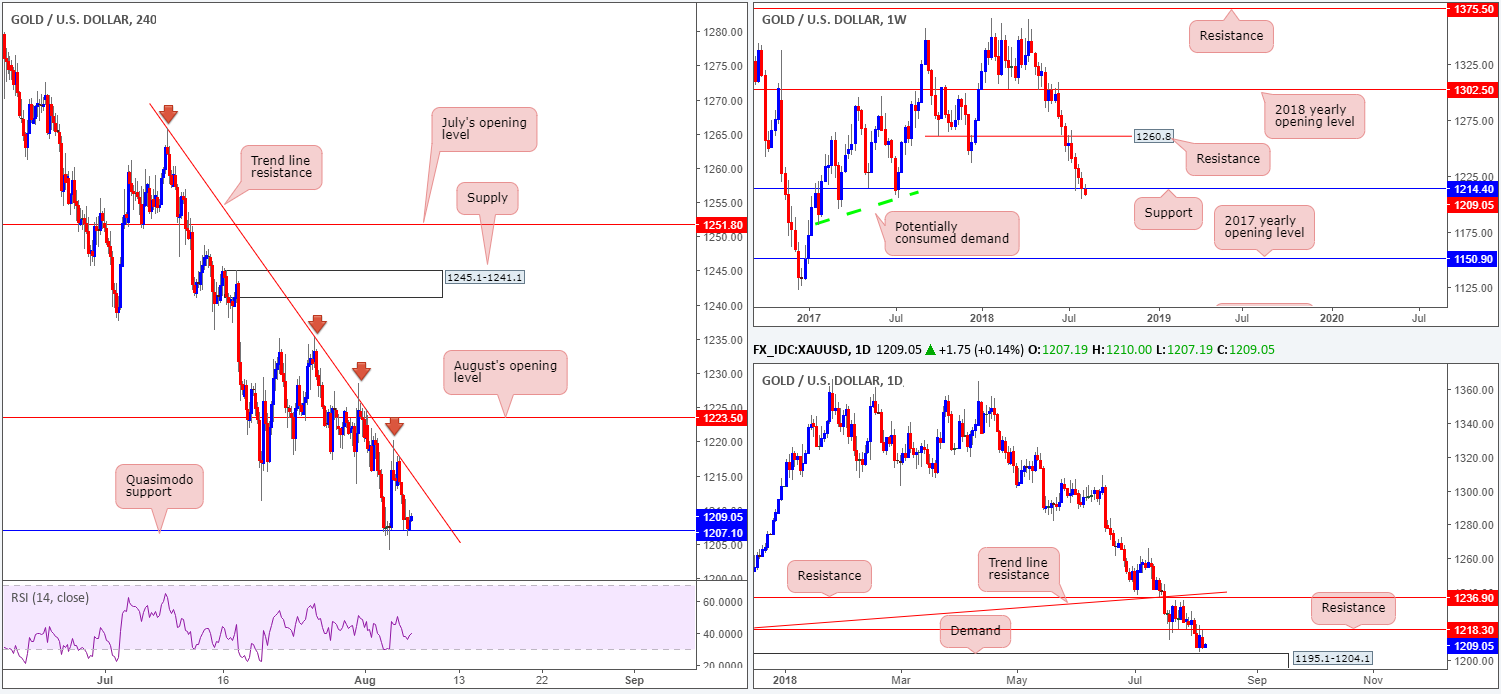
For those who read Monday’s report you may recall the team highlighting a possible shorting opportunity on the H4 timeframe. Shorts based on the H4 bearish pin-bar candle formation off trend line resistance (taken from the high 1265.9) worked beautifully, bringing the unit towards a Quasimodo support level marked at 1207.1. What ‘sealed the deal’ here was the fact daily resistance at 1218.3 converged with the aforementioned H4 trend line. Those who remain short might want to consider reducing risk to breakeven and maybe taking some profits off the table at this point. The remainder of the position should be ‘left to run’ down to daily demand plotted at 1195.1-1204.1 – the next downside target on the daily scale and also beyond the current H4 Quasimodo support.
In terms of weekly price action, the metal is seen trading beneath key support at 1214.4. A close beneath here would, in our technical opinion, open up the possibility for further downside as far south as the 2017 yearly opening level at 1150.9. Note there’s limited active demand to the left of current price between these two levels.
Areas of consideration:
Aside from the sell from H4 trend line resistance yesterday, we do not see much else to hang our hat on today. Buying from the current H4 Quasimodo support is certainly not a notable trade, given daily price poised to test the top edge of daily demand seen just below it and weekly support appearing to be on its last legs!
We would also advise caution regarding a buy from daily demand, as you’re effectively buying a market which has just broken key weekly support and could, therefore, act as resistance!
In light of the above, if you remain short from the noted H4 trend line resistance, look to cover the position within the current daily demand. Should you have missed this trade, nevertheless, remaining flat may be the better path to take right now.
The use of the site is agreement that the site is for informational and educational purposes only and does not constitute advice in any form in the furtherance of any trade or trading decisions.
The accuracy, completeness and timeliness of the information contained on this site cannot be guaranteed. IC Markets does not warranty, guarantee or make any representations, or assume any liability with regard to financial results based on the use of the information in the site.
News, views, opinions, recommendations and other information obtained from sources outside of www.icmarkets.com.au, used in this site are believed to be reliable, but we cannot guarantee their accuracy or completeness. All such information is subject to change at any time without notice. IC Markets assumes no responsibility for the content of any linked site. The fact that such links may exist does not indicate approval or endorsement of any material contained on any linked site.
IC Markets is not liable for any harm caused by the transmission, through accessing the services or information on this site, of a computer virus, or other computer code or programming device that might be used to access, delete, damage, disable, disrupt or otherwise impede in any manner, the operation of the site or of any user’s software, hardware, data or property.


