
Key risk events today:
Australia Trade Balance; RBA Cash Rate and Rate Statement.
(Previous analysis as well as outside sources – italics).
EUR/USD:
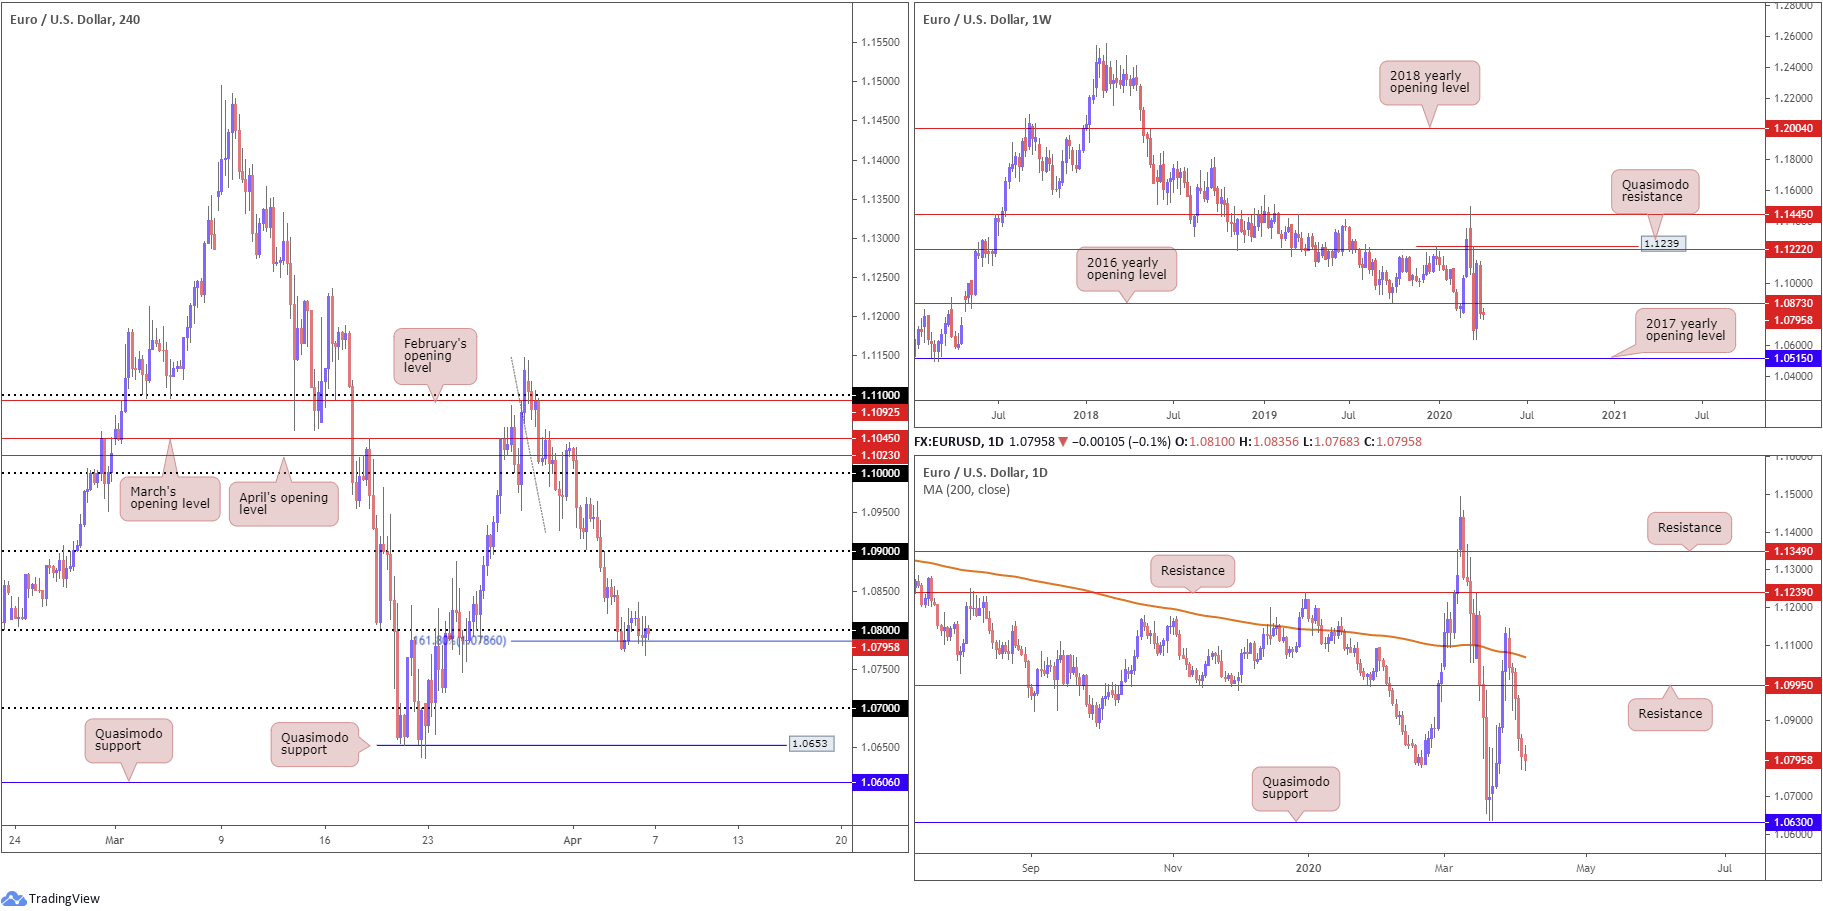
Monday put out a somewhat subdued session, with buyers/sellers feasting on sell-stop liquidity a touch beneath the 1.08 handle while simultaneously establishing minor support off the 161.8% H4 Fibonacci extension point at 1.0786. EUR/USD upside appears capped by intraday resistance off 1.0820. The US dollar index, or DXY, on the other hand, ended mixed vs. major rivals, holding north of 100.00 with eyes remaining on 101.00.
A break south of 1.08 today reveals limited support until reaching the 1.07 handle, sited above a Quasimodo formation at 1.0653.
Weekly flow crossed back through the 2016 yearly opening level at 1.0873 after failing to build on recent gains last week. Chart studies show multi-year lows at 1.0635 as feasible support on the weekly timeframe, followed by the 2017 yearly opening level 1.0515.
The 200-day SMA (orange – 1.1068) delivered a relatively firm ceiling in recent trade, with price movement breaching support at 1.0995, now a serving resistance base. This highlights further loss as a possibility, with the spotlight shining over Quasimodo support drawn from 1.0630 as a logical downside target.
Areas of consideration:
For traders who read Monday’s technical briefing you may recall the following pieces (italics):
The rebound from the 1.08ish neighbourhood is interesting, though could falter in light of the recent close beneath the 2016 yearly opening level on the weekly timeframe at 1.0873. In addition, traders will note the lack of daily support until reaching 1.0630.
On account of the above, a deeper violation of 1.08 is likely on the cards, unlocking the door for bearish scenarios towards 1.07 and H4 Quasimodo support at 1.0653. Conservative traders may seek additional confirmation in the form of a retest setup at the underside of 1.08 before pulling the trigger. This can help avoid whipsaws which are common viewing around psychological levels.
In light of Monday’s lacklustre performance, the outlook for Tuesday remains unchanged.
GBP/USD:
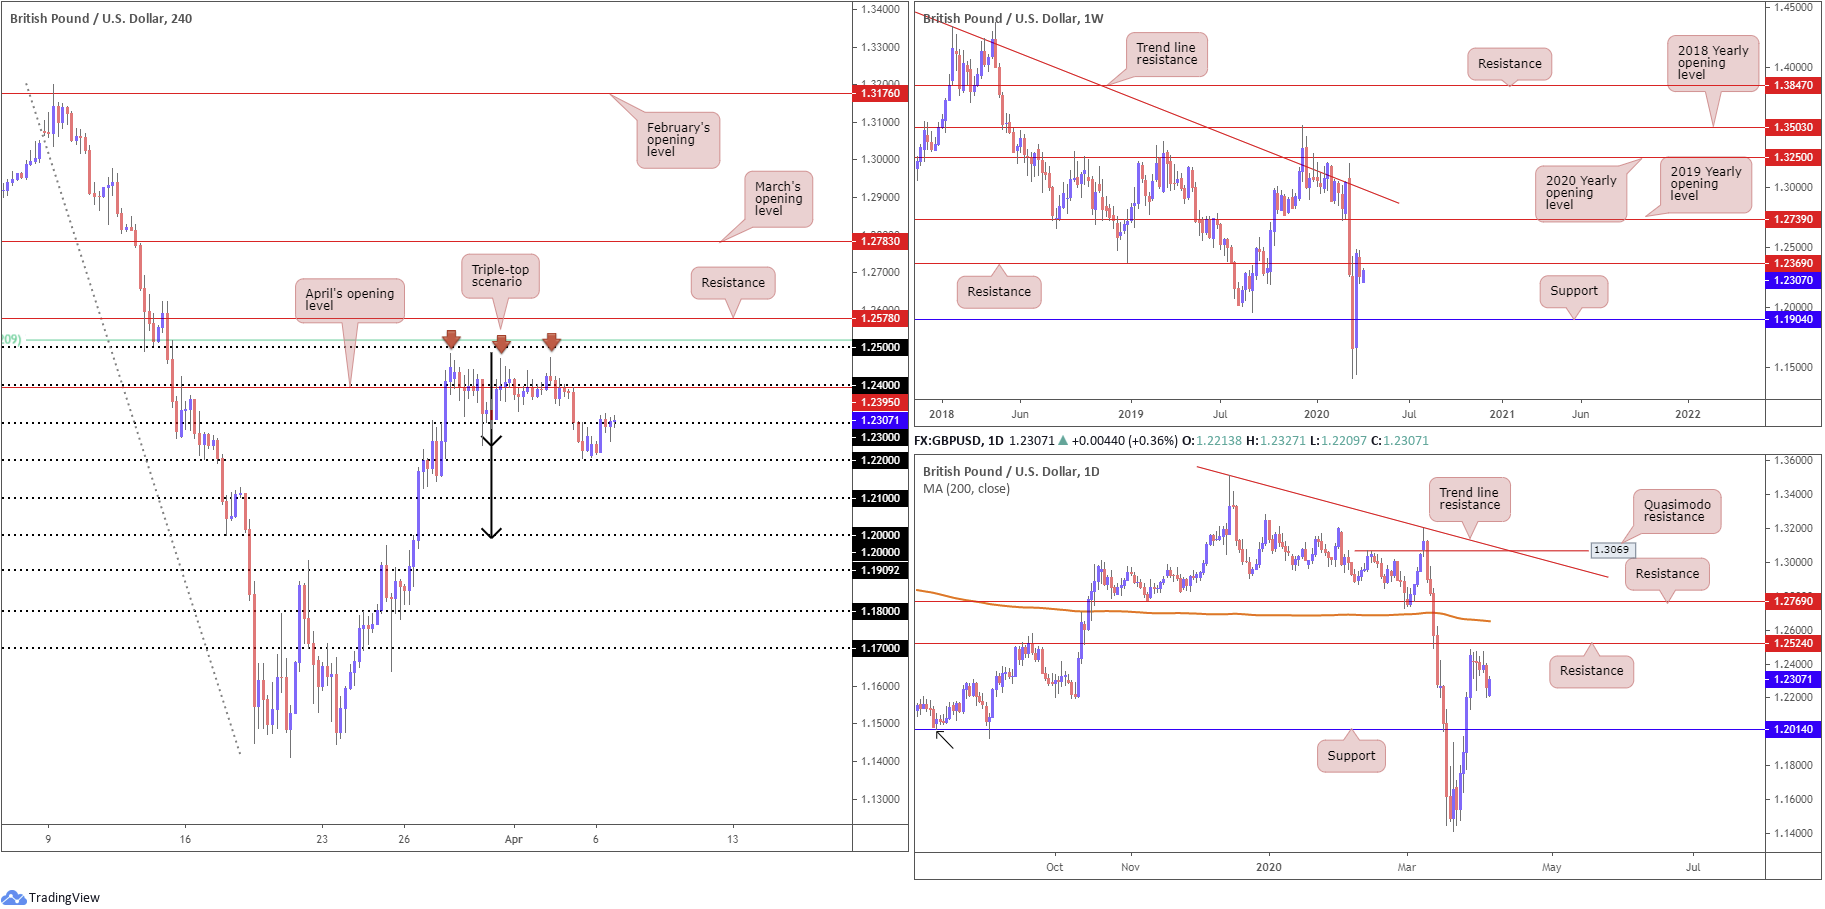
In recent hours, the 1.23 handle welcomed price action which is proving a difficult hurdle to overcome as resistance, following a collapse in the UK construction PMI and UK Prime Minister Boris Johnson remaining hospitalised.
From the weekly timeframe, longer-term flow dipped its toe in waters south of resistance at 1.2369, with the possibility of follow-through moves materialising to support priced in at 1.1904. The next upside target beyond 1.2369, on the other hand, falls in around the 2019 yearly opening level at 1.2739, with a break exposing long-term trend line resistance, taken from the high 1.5930.
The story on the daily timeframe has price action languishing beneath resistance at 1.2524. The 200-day SMA (orange – 1.2652) lurks north of noted resistance, while support resides around the 1.2014 neighbourhood.
Following the formation of a H4 triple-top pattern around 1.2476ish, sited just beneath the 1.25 handle and a 61.8% Fibonacci retracement at 1.2520, cable overpowered 1.23 in the early hours of London Friday amid continued demand for the buck, despite dismal US employment data.
H4 price established support ahead of 1.22 Monday, with the unit shaking hands with 1.23. The break of the lowest trough within the aforementioned triple-top pattern (1.2241) has confirmed the formation as a potential contender for shorts, with a take-profit target (measured by taking the value between the highest peak to the lowest trough and adding this to the breakout point) set around the key figure 1.20 (black arrows).
Areas of consideration:
In view of a reasonably lacklustre start to the week, Monday’s outlook remains unchanged.
Having noted weekly movement garnering resistance from 1.2369 as well as daily price displaying room to stretch lower to support at 1.2014, the triple-top H4 pattern could complete, given the formation’s take profit target residing a touch beneath daily support at 1.20.
Technically, therefore, traders will likely favour short-selling upside corrections from 1.23 and 1.24, with the latter holding April’s opening level close by at 1.2395.
AUD/USD:
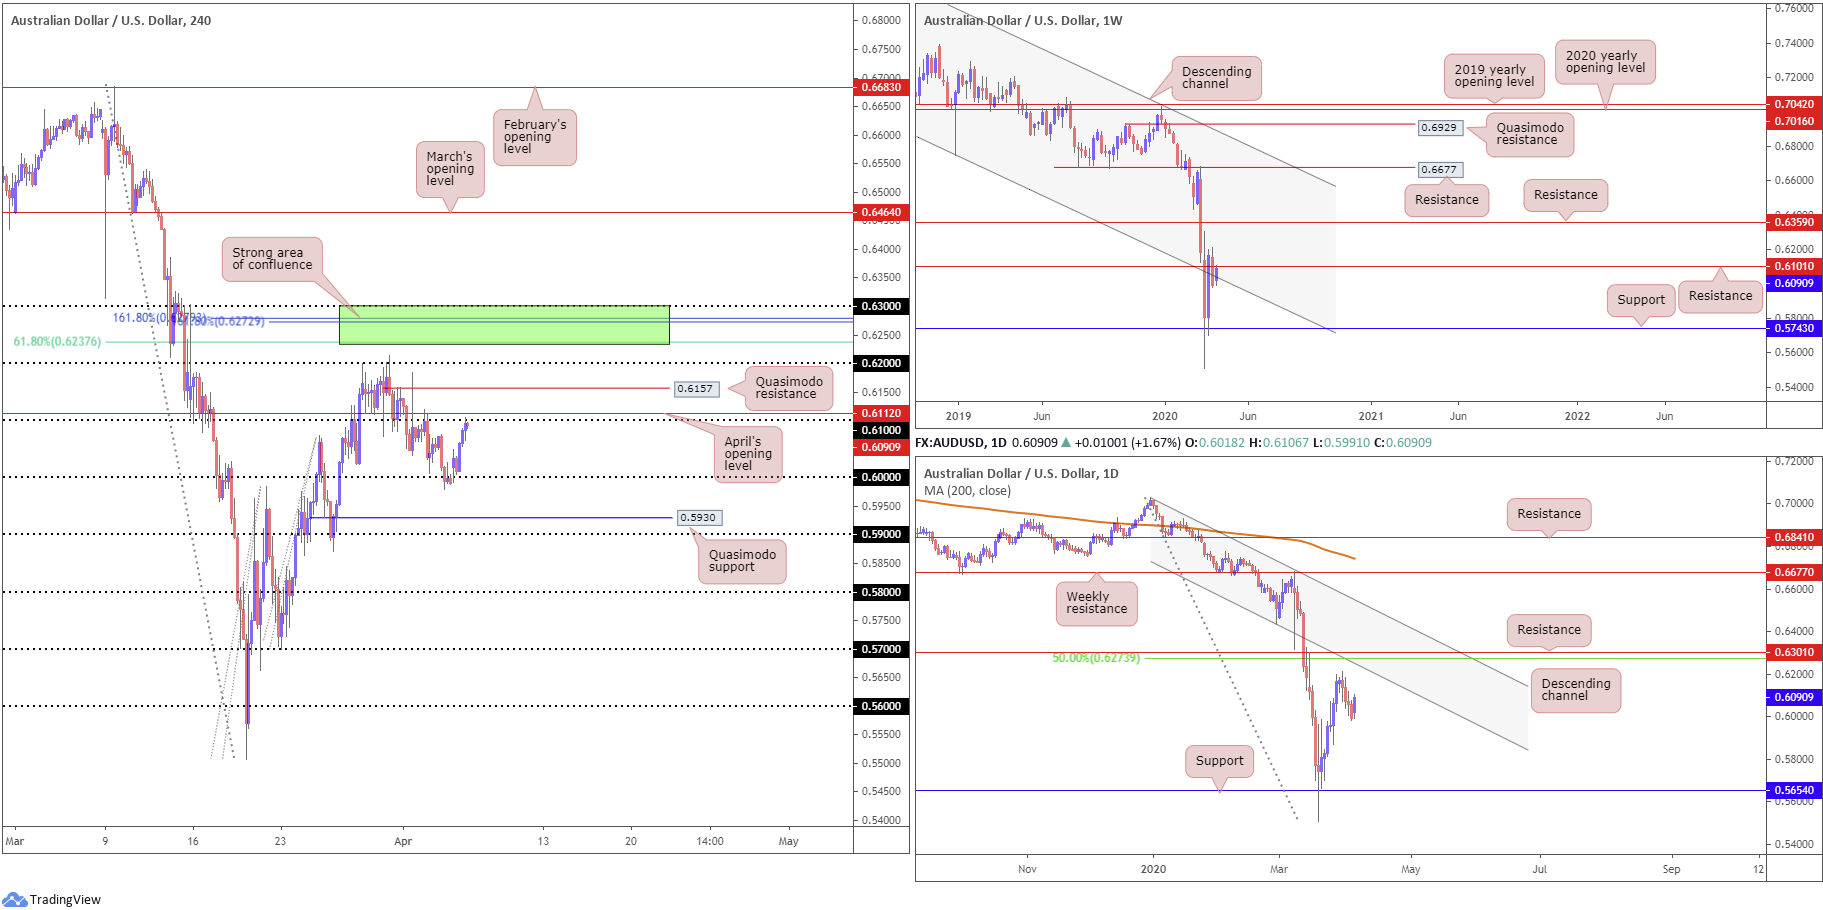
Kicking off the week exhibiting a risk-on tone, AUD/USD gapped north of 0.60 in early trade and crossed swords with 0.61, closely shadowed by April’s opening level at 0.6112. H4 flow identifies possible resistance in the form of a Quasimodo formation around 0.6157, with a break underlining the 0.62 handle. It’s also worth pointing out the strong area of confluence residing around the 0.63 handle (green), comprised of two Fibonacci extension points at 0.6272 and 0.6279 and a 61.8% Fibonacci resistance point at 0.6237.
Further afield, weekly movement recently crossed paths with resistance at 0.6101, aligning closely with a channel support-turned resistance, coming in from the low 0.6744. Support at 0.5743 could eventually be in the offing, a level with history dating as far back as September 1998, whereas a break higher has resistance around the 0.6359ish region.
A closer examination of price action on the daily timeframe has resistance plotted at 0.6301, which converges closely with a 50.0% retracement ratio at 0.6273. Note these barriers are located just north of a channel support-turned resistance, extended from the low 0.6433.
Areas of consideration:
0.61 will likely be interpreted as an area of interest for sellers, knowing the base merges with weekly resistance at 0.6101 and April’s opening level at 0.6112. The flip side to this, of course, is a fakeout above 0.61 towards H4 Quasimodo resistance at 0.6157. This will likely trip buy stops and provide liquidity to short 0.6157. A H4 close sub 0.61 off 0.6157 may, therefore, entice a wave of selling back to 0.60.
USD/JPY:
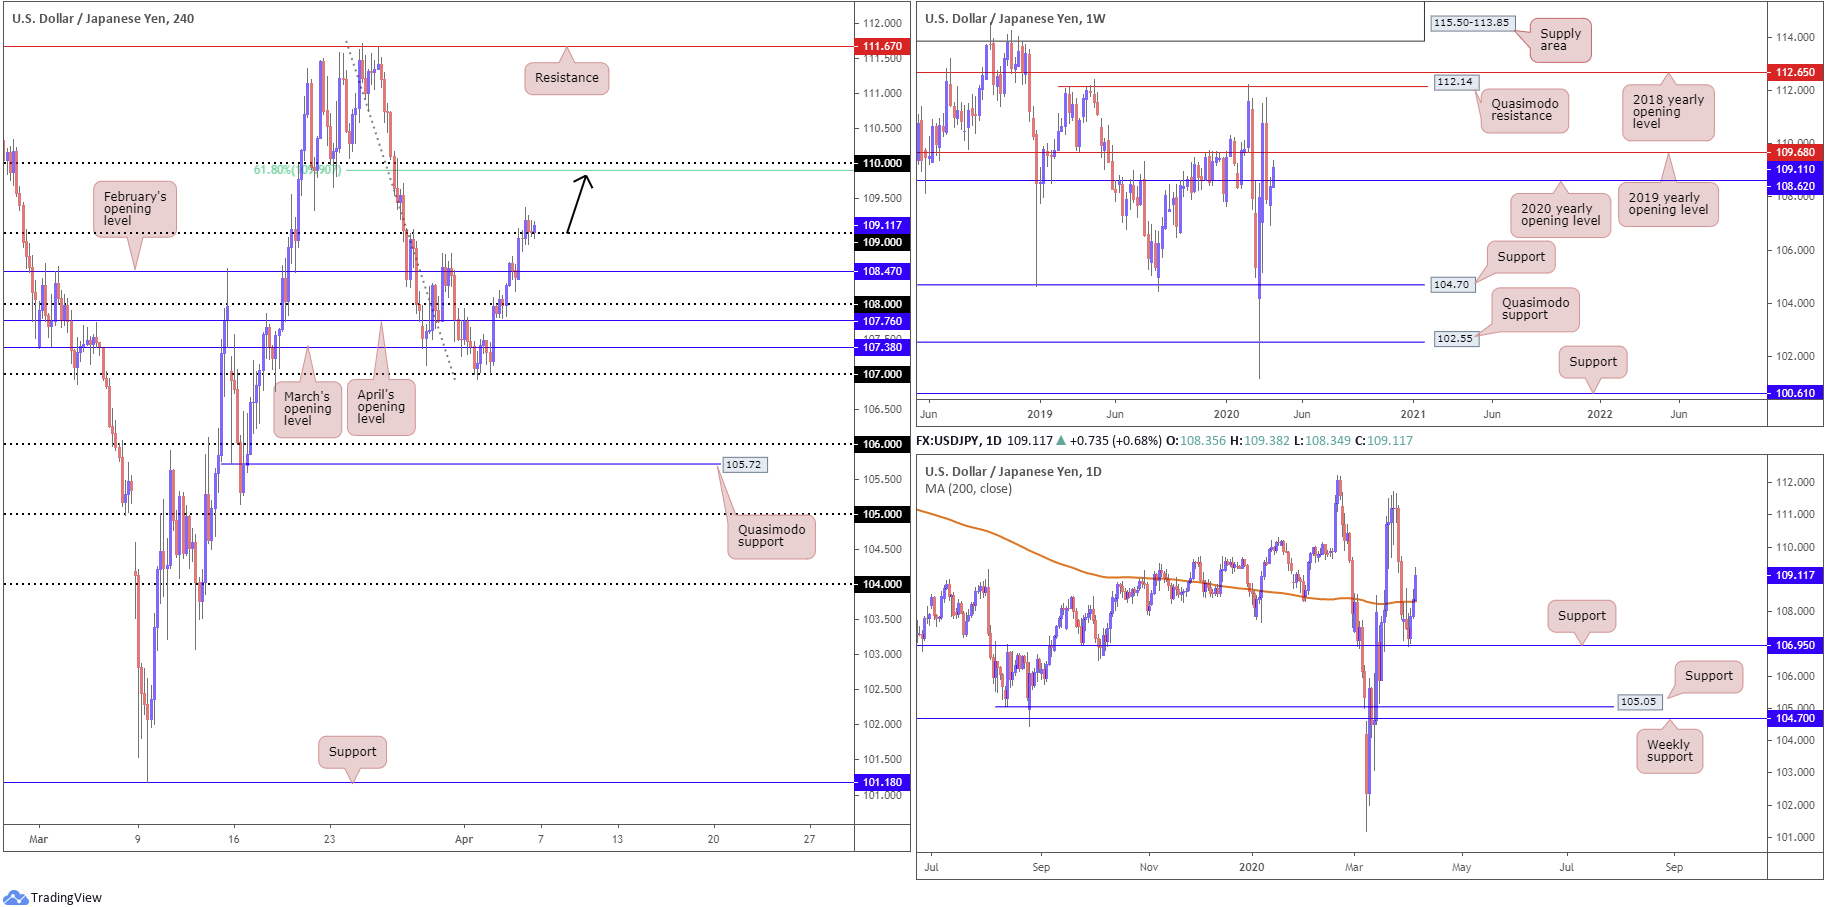
The Japanese yen was a clear underperformer vs. the buck Monday, as a result of unwinding safe-haven flows due to a clear risk-on environment.
Technical studies moved weekly price through its 2020 yearly opening level at 108.62 in recent trade consequently drawing the 2019 yearly opening level at 109.68 into sight as possible resistance. Lower on the curve, daily price toppled its 200-day SMA at 108.31, potentially providing an early cue we may be headed for 109.68 on the weekly timeframe.
Across the page on the H4 timeframe, intraday action conquered 109 to the upside in early Europe, reaching highs of 109.38, before retesting 109 into the close as support. There’s little (technical) evidence to suggest sellers want to engage, thus a run to 110 is a possibility, placed just above a 61.8% Fibonacci retracement at 109.90.
Areas of consideration:
Technical traders will likely be watching price action for signs of buying off 109, likely in the shape of a bullish candlestick formation – think hammer or engulfing pattern – targeting weekly resistance at 109.68, followed by the 110 handle on the H4.
USD/CAD:
The US dollar index concluded Monday mostly unmoved, while WTI crude oil prices plunged sub $26.50/bbl. In addition, the Bank of Canada, in its quarterly Business Outlook Survey, noted business sentiment had softened in most regions even before concerns around COVID‑19 intensified in Canada. Confidence deteriorated the most among firms in energy-producing regions[1].
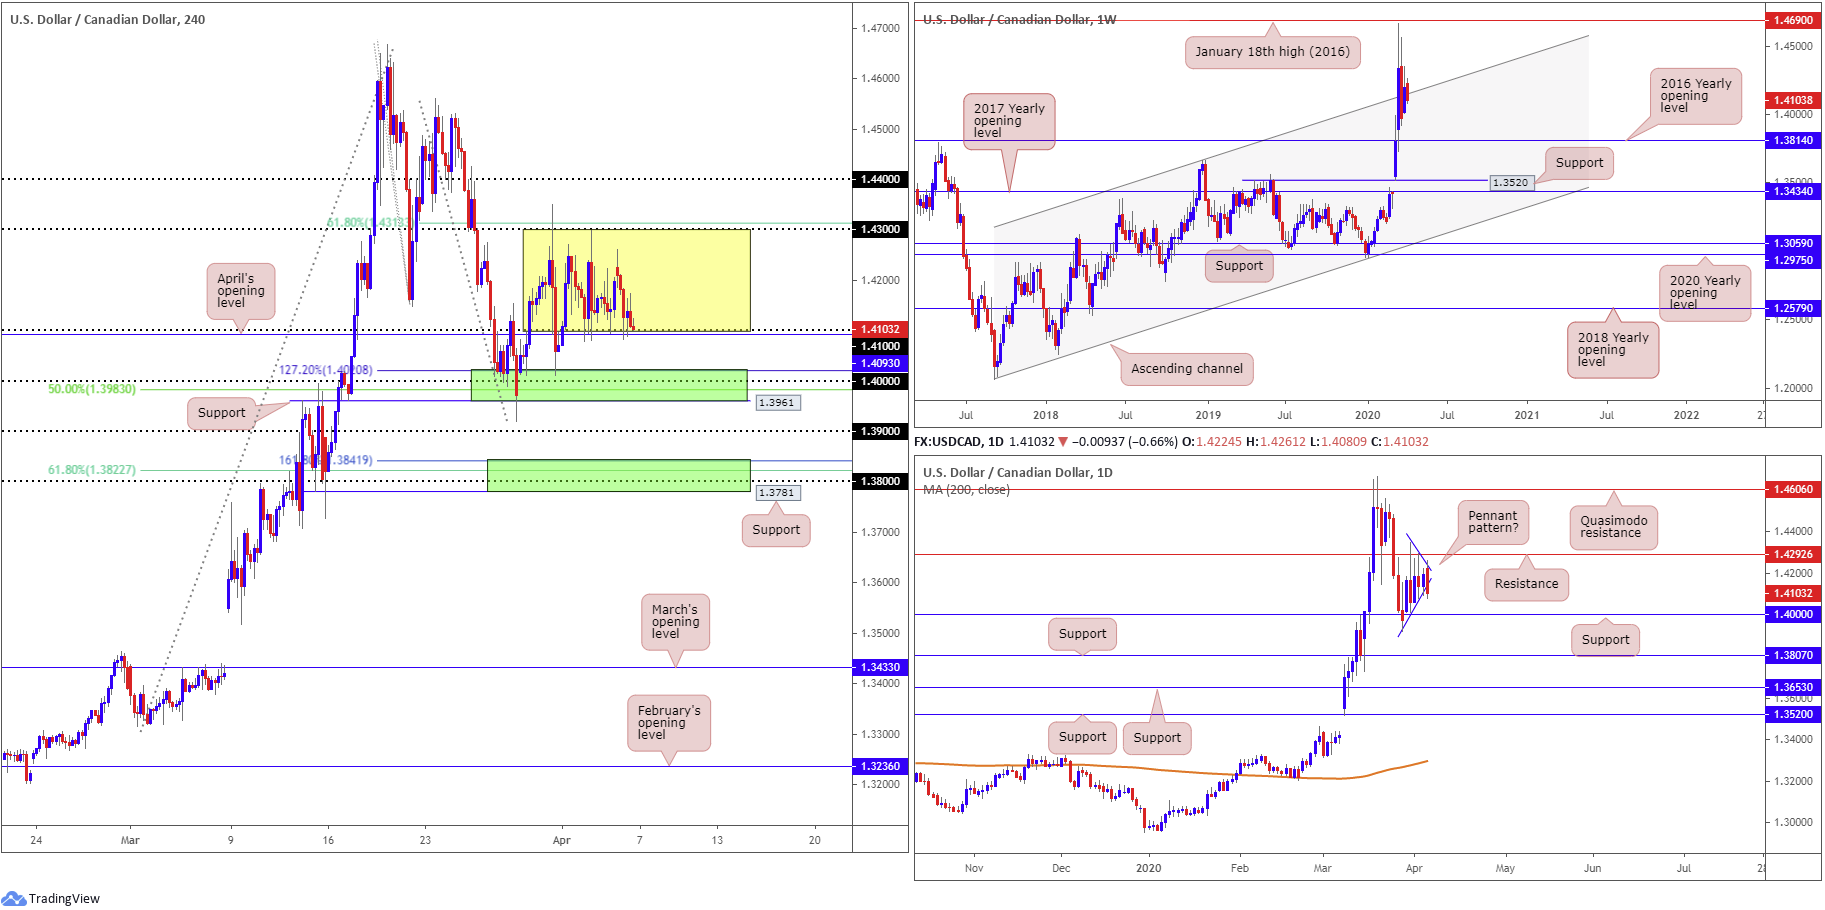
USD/CAD wrapped up Monday lower, testing 1.41 and April’s opening level at 1.4093 on the H4 scale. This represents the lower boundary of a newly formed range, with an upper base situated around 1.43 and a 61.8% Fibonacci retracement at 1.4313. Outside of the current range, 1.44 may offer resistance, while to the downside an interesting area of support resides at 1.3961-1.4020 (upper green zone), made up of a 127.2% Fibonacci extension base at 1.4020, the round number 1.40, a 50.0% retracement at 1.3983 and support coming in at 1.3961.
On a wider perspective, weekly price is seen flirting with channel resistance, extended from the high 1.3661. Buying from this point has January 18th high at 1.4690 (2016) to target, whereas moves lower could draw in support at the 2016 yearly opening level from 1.3814.
A closer reading of price action on the daily timeframe reveals the candles remain somewhat confined between resistance at 1.4292 and support coming in at 1.4000, with the former welcoming more of the action last week. Additional support is seen at 1.3807, in the event we push for lower levels, while a jump higher has eyes for Quasimodo resistance at 1.4606. Pattern traders will also recognise a pennant formation (1.4349/1.4011) having its lower edge tested, generally considered a continuation pattern. However, until this area witnesses a decisive breakout it’s difficult to trade.
Areas of consideration:
Range traders may attempt to engage with the lower boundary of the current H4 consolidation today, though do remain aware this consolidation is in the early stages of forming therefore the likelihood of a whipsaw being seen is certainly there. Waiting for a H4 candlestick pattern to form before engaging can help avoid this.
A break of 1.41 will likely land price back within 1.3961/1.4020, which could offer a ‘floor’, knowing the area also houses daily support at 1.4000.
A breach of 1.43, on the other hand, may look for 1.44 as an upside target.
USD/CHF:
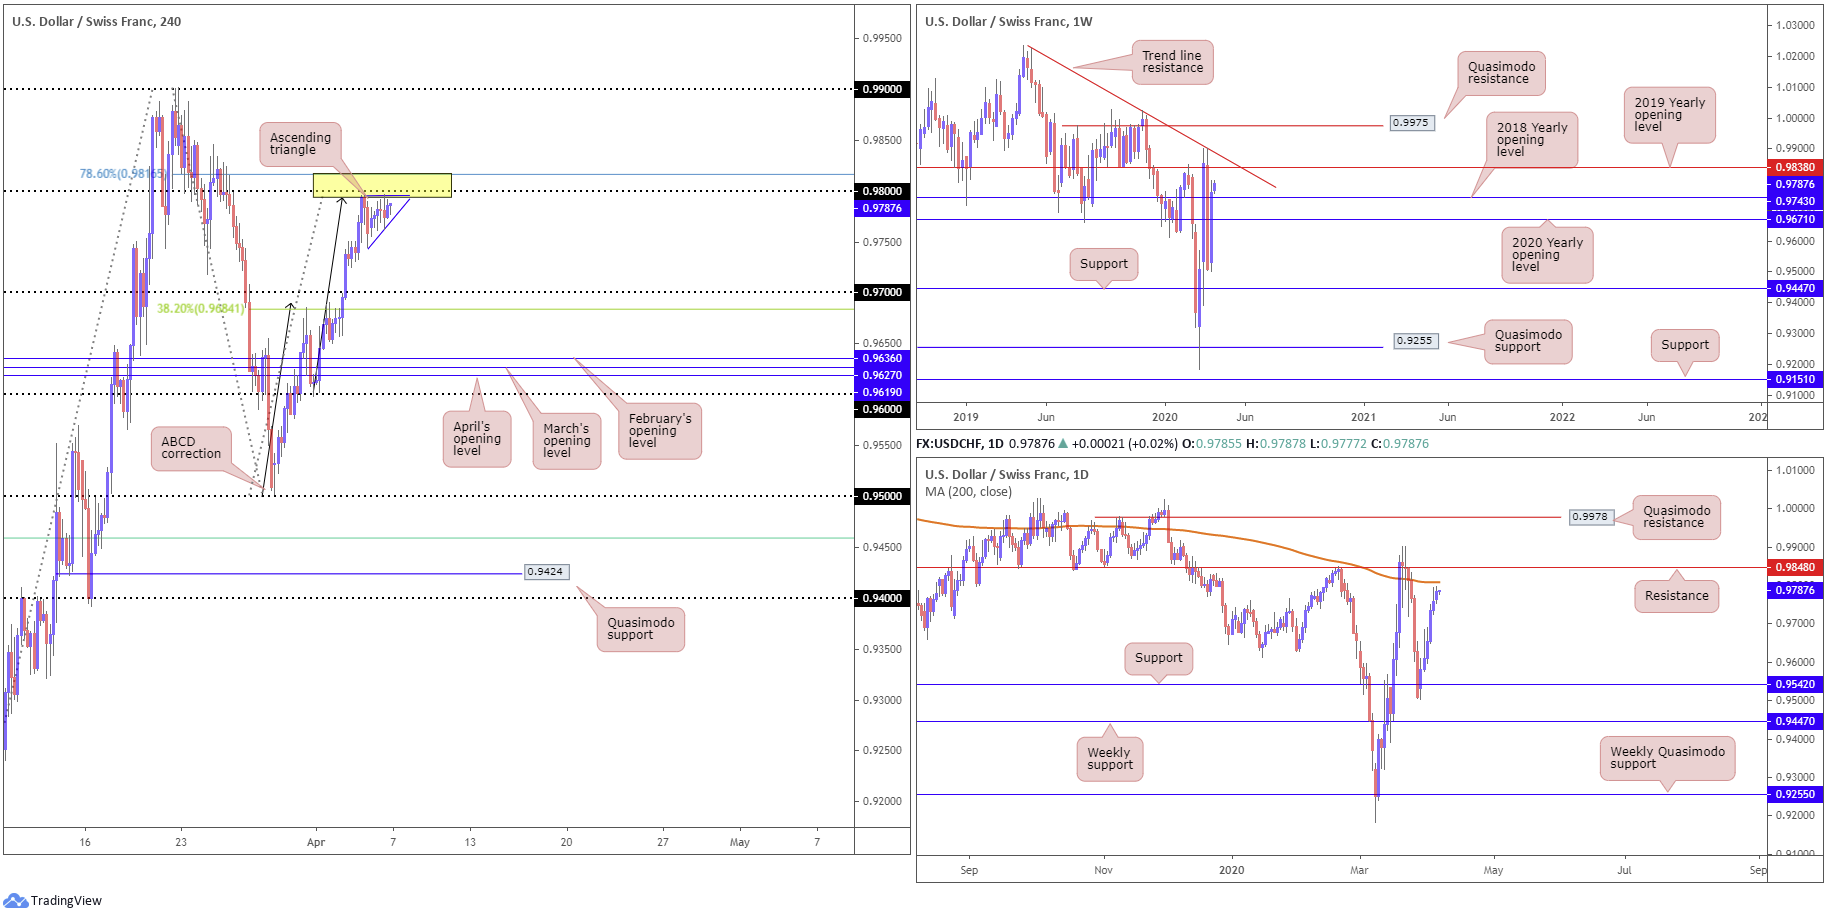
Despite a mixed session for the US dollar index, USD/CHF put in its sixth consecutive daily gain Monday though held at a H4 ABCD bearish completion (black arrows) from 0.9794. Note this formed south of 0.98, shadowed by a 78.6% Fibonacci retracement at 0.9816. What’s also notable is price recently formed an ascending triangle pattern – a breakout can occur to the upside/downside despite often labelled as continuation patterns. Downside targets from 0.98 are the 0.97 handle, followed closely by the 38.2% Fibonacci retracement at 0.9684 (a traditional take-profit target out of ABCD formations).
Last week’s movement, as can be seen from the weekly timeframe, marginally crossed above the 2018 yearly opening level at 0.9743. The break potentially shines the spotlight on the 2019 yearly opening level at 0.9838 and trend line resistance, etched from the high 1.0236.
Price action on the daily timeframe is seen closing in on the 200-day SMA (orange – 0.9808), hovering a few points south of resistance at 0.9848 which boasts moderately healthy history as an S/R level. North of here Quasimodo resistance at 0.9978 is in the offing.
Areas of consideration:
A H4 breakout beneath the ascending triangle’s trend line would likely be viewed as a bearish signal, with many likely to execute short entries on the close of the breakout candle. However, a pop higher might be seen to the 200-day SMA (0.9808) before sellers step in.
As stated above, downside targets can be seen at 0.97, followed by the 38.2% Fibonacci retracement ratio at 0.9684.
Dow Jones Industrial Average:
US equities surged to three-week highs Monday amid easing coronavirus tolls. The Dow Jones Industrial Average added 1627.46 points, or 7.73%; the S&P 500 also added 175.03 points, or 7.03%, and the tech-heavy Nasdaq 100 concluded higher by 553.55 points, or 7.35%.
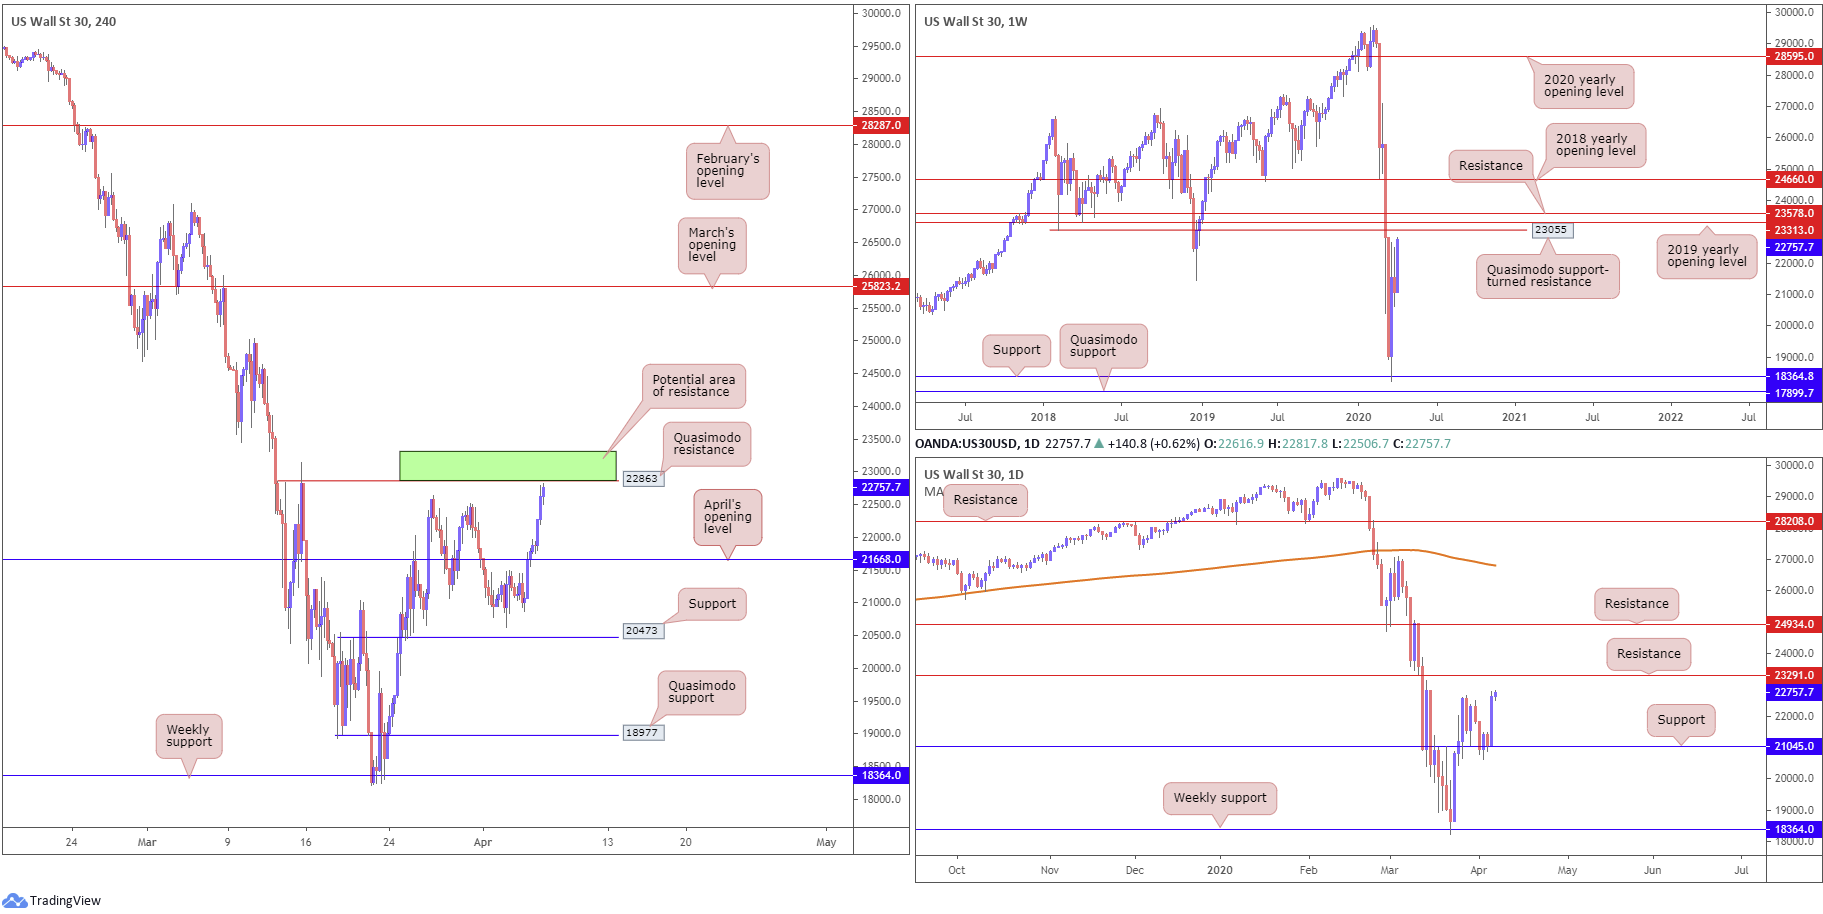
Technically we have the H4 candles approaching Quasimodo resistance at 22863, after firming above April’s opening level at 21668. Interestingly, we also have a daily resistance circulating nearby at 23291 and a weekly Quasimodo resistance at 23055 (green area).
Areas of consideration:
H4 Quasimodo resistance at 22863 represents a healthy level, owing to its surrounding higher-timeframe confluence. Therefore, this is likely to be viewed as a key area today, not only for sellers looking to fade recent moves, but also traders seeking to liquidate long positions.
XAU/USD (GOLD):
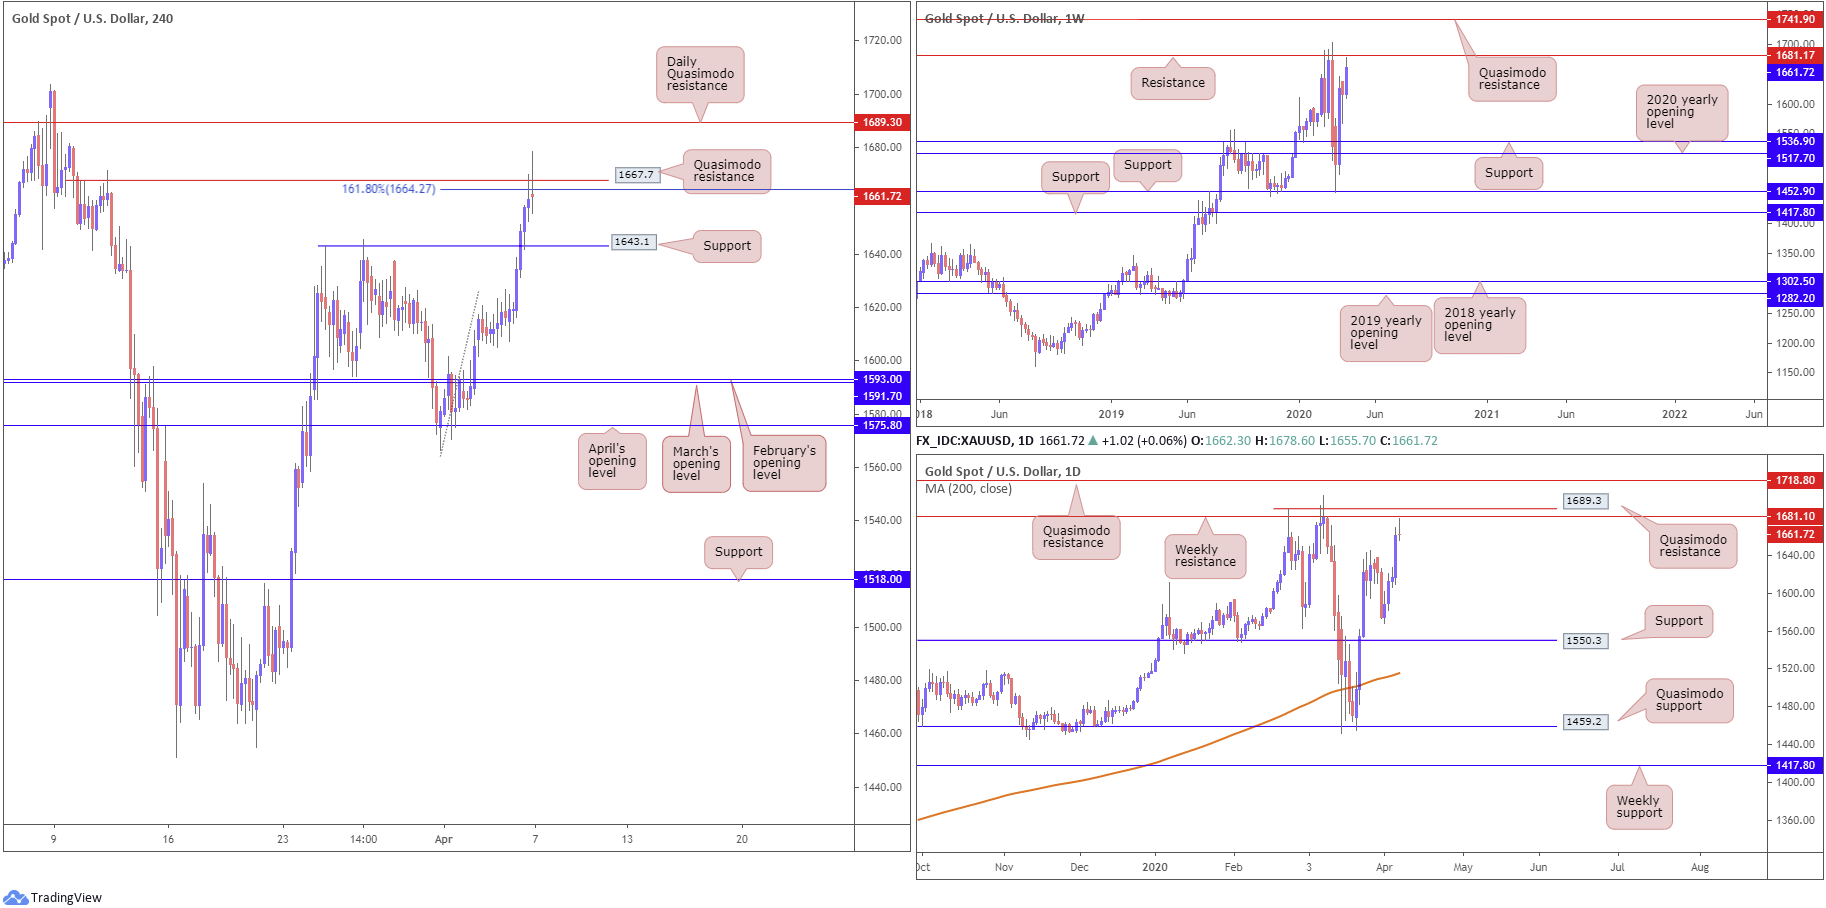
XAU/USD bulls went on the offensive Monday, shrugging off upbeat risk sentiment. Adding more than 2.70%, technicians witnessed H4 price hike through Quasimodo resistance at 1643.1 (now a serving support) and aggressively challenge another layer of Quasimodo resistance at 1667.7, as well as a 161.8% Fibonacci extension at 1664.2. Note also H4 price is currently chalking up a potential shooting star candlestick signal, which typically displays bearish intent.
Further out on the weekly timeframe, we have the current candle a touch off best levels south of resistance at 1681.1, with a break of this base exposing Quasimodo resistance at 1741.9.
The technical story on the daily timeframe had the unit build on recent upside, registering a fourth consecutive daily gain yesterday. As is evident from the chart, price action is retreating a few points beneath weekly resistance at 1681.1, closely followed by daily Quasimodo resistance at 1689.3.
Areas of consideration:
Although we’re not effectively testing weekly resistance at 1681.1, many traders will, however, deem recent moves to be a test of the weekly base, given support and resistance levels are generally considered zones rather than defined price points.
Consequently, in the event we close in the shape of a H4 shooting star candlestick signal off Quasimodo resistance at 1667.7, a run through H4 support at 1643.1 might be in store today, offering traders a possible opportunity to short towards March and April’s opening levels at 1591.7 and 1593.0, respectively.
The accuracy, completeness and timeliness of the information contained on this site cannot be guaranteed. IC Markets does not warranty, guarantee or make any representations, or assume any liability regarding financial results based on the use of the information in the site.
News, views, opinions, recommendations and other information obtained from sources outside of www.icmarkets.com.au, used in this site are believed to be reliable, but we cannot guarantee their accuracy or completeness. All such information is subject to change at any time without notice. IC Markets assumes no responsibility for the content of any linked site.
The fact that such links may exist does not indicate approval or endorsement of any material contained on any linked site. IC Markets is not liable for any harm caused by the transmission, through accessing the services or information on this site, of a computer virus, or other computer code or programming device that might be used to access, delete, damage, disable, disrupt or otherwise impede in any manner, the operation of the site or of any user’s software, hardware, data or property.
[1] https://www.bankofcanada.ca/2020/04/business-outlook-survey-spring-2020/


