
DXY:
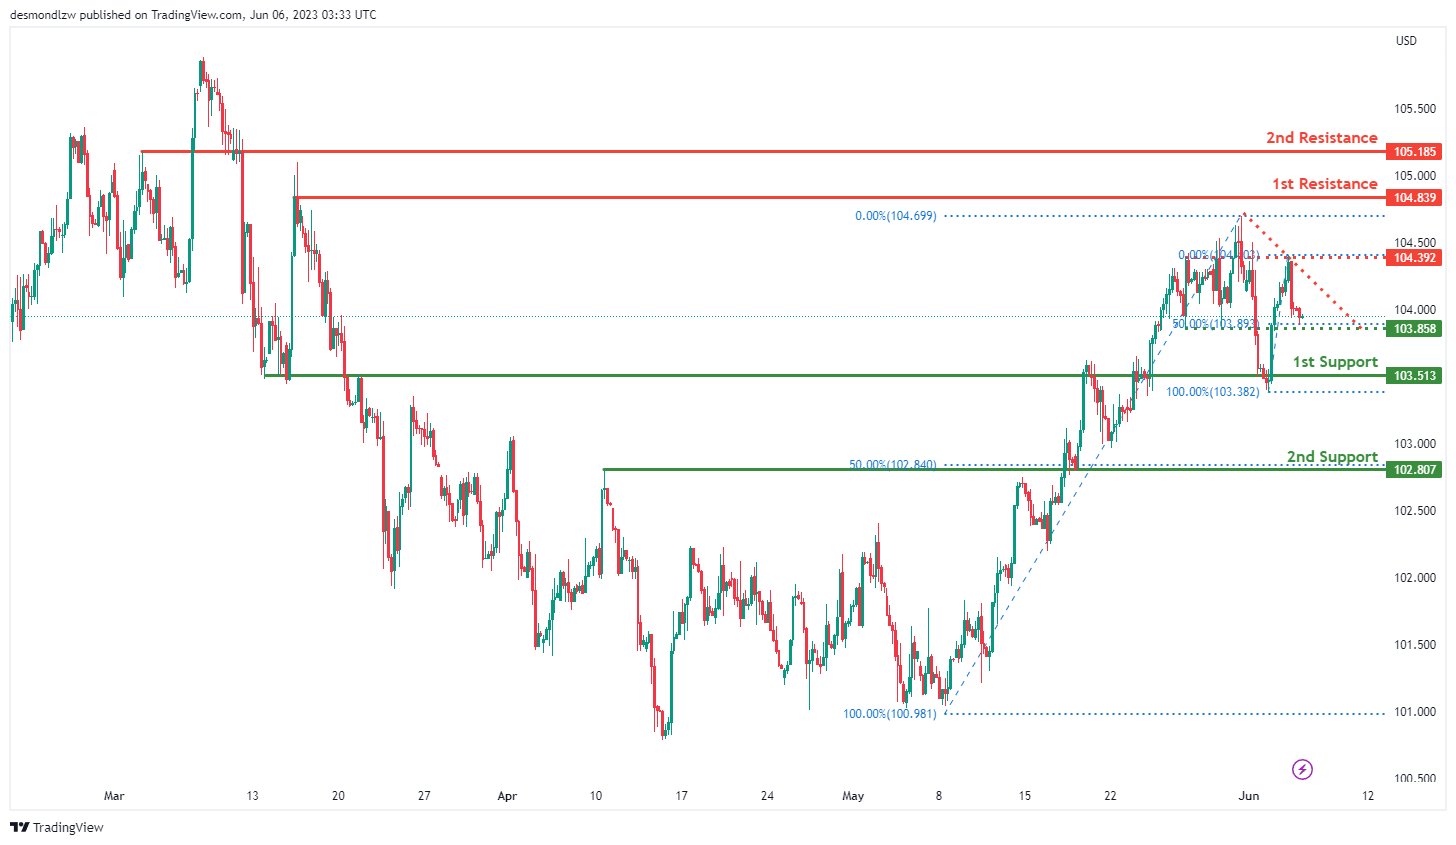
The DXY (US Dollar Index) chart is currently showing bearish momentum, with the price situated below a major descending trend line. This indicates a higher likelihood of continued downward movement. Under these bearish circumstances, it’s predicted that the price could continue its downward trajectory towards the first support level. There is also an intermediate support at 103.86 which is marked by the 50.0% Fibonacci retracement level.
The first support level is at 103.51. This overlap support level represents a zone where the market has previously found a price floor and could potentially do so again.
The second support level is at 102.81. This is another overlap support level, and it aligns with the 50% Fibonacci retracement level. This confluence strengthens the significance of this potential price floor.
The first resistance level is at 104.84. This overlap resistance level represents an area where sellers have previously come into the market and could potentially do so again, acting as a price ceiling.
The second resistance level is at 105.19, which is another overlap resistance level. This level could also serve as a significant barrier to any upward price movement.
EUR/USD:
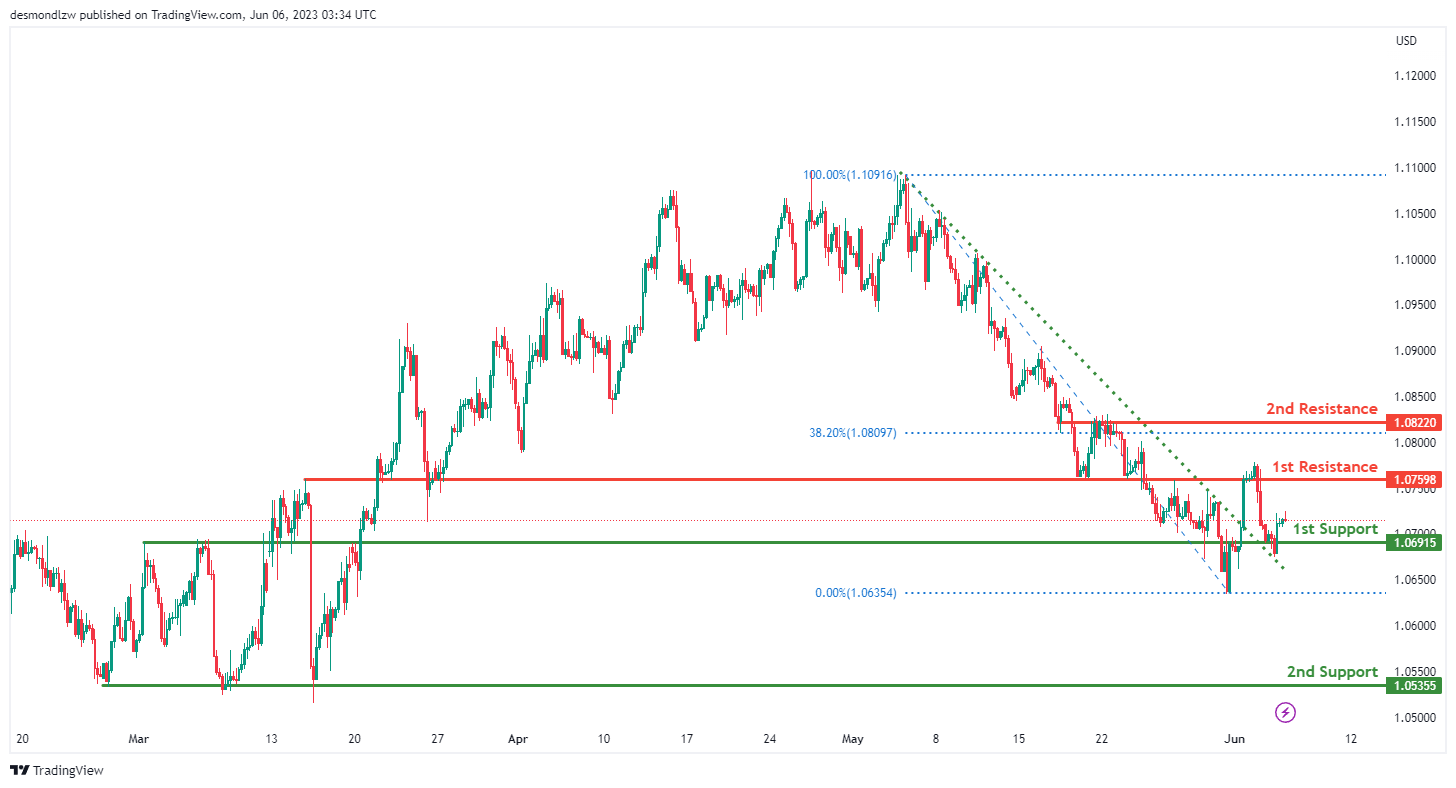
The EUR/USD chart is currently showing weak bullish momentum, which means that while the overall trend is upward, it lacks strength and is somewhat uncertain. Despite this uncertainty, the price has potential to make a bullish continuation towards the first resistance level.
The first support level is at 1.0692, which is identified as an overlap support. Overlap support is an area where price has bounced off before, suggesting that it is a significant level where buyers might enter the market.
The second support level is at 1.0536, another overlap support level. This is another price level where the market has found support previously and could potentially do so again.
The first resistance level is at 1.0760, an overlap resistance level. Resistance is an area where the price has previously been pushed down, suggesting potential selling pressure.
The second resistance level is at 1.0822. This level is also an overlap resistance, but it is further strengthened by the 38.2% Fibonacci retracement level. The combination of resistance and a key Fibonacci level often represents a significant price ceiling.
GBP/USD:
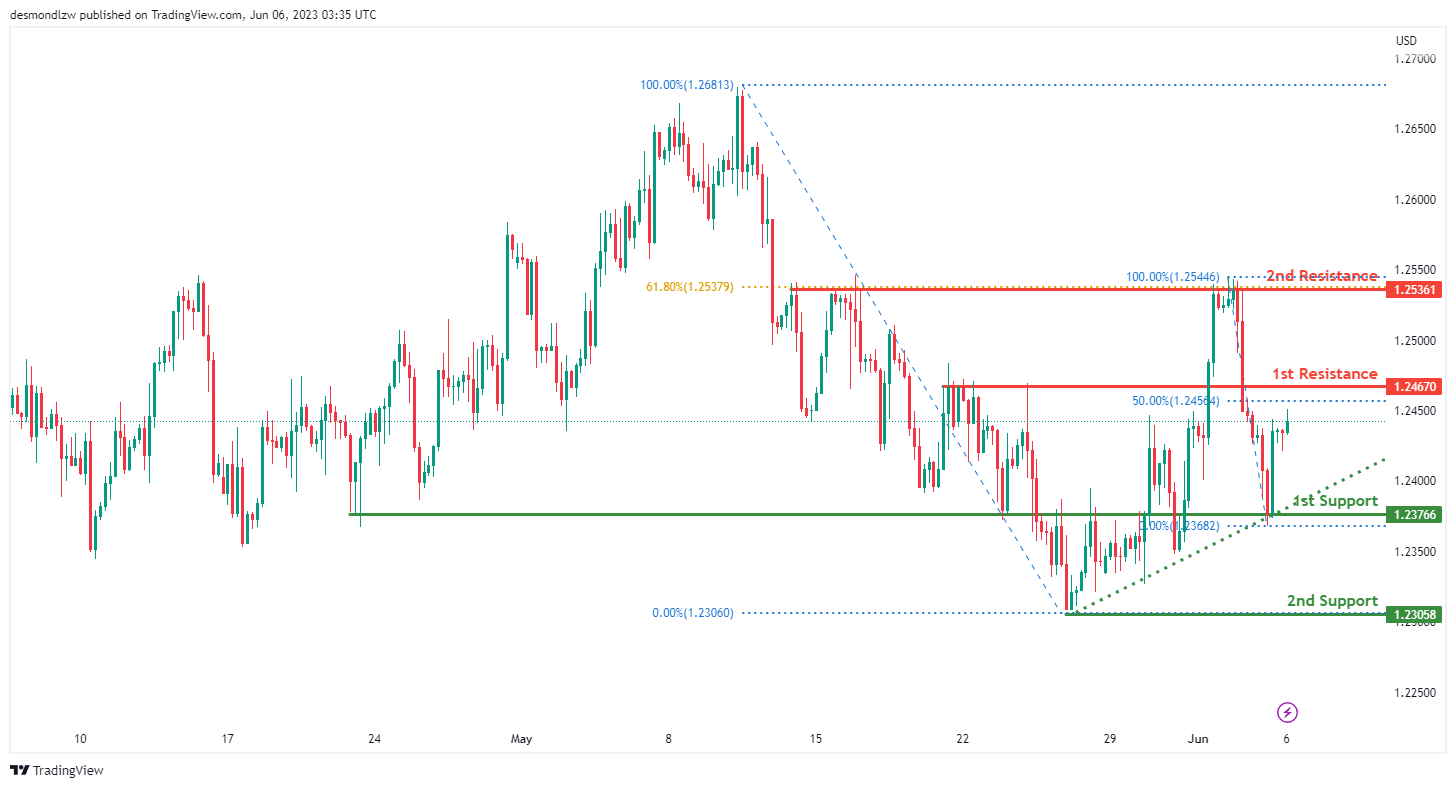
The GBP/USD chart is showing bullish momentum, meaning the trend is upward. This momentum is bolstered by the fact that the price is above a major ascending trend line, which suggests the possibility of further bullish momentum. In this situation, the price might continue its bullish trend towards the first resistance level.
The first support level is at 1.2377, which is classified as an overlap support. Overlap support is a level where price has bounced off before, indicating it as a significant level where buyers might come into the market.
The second support level is at 1.2306, which is a swing low support. This is a price level that acted as support during the most recent downward price swing and may do so again.
The first resistance level is at 1.2467. This level is an overlap resistance and is also marked by the 50% Fibonacci retracement level. This dual identity makes it a significant level where sellers might come into the market.
The second resistance level is at 1.2536. This level is also an overlap resistance and is further strengthened by being at the 61.8% Fibonacci retracement level. The combination of resistance and a key Fibonacci level often indicates a strong price ceiling.
USD/CHF:
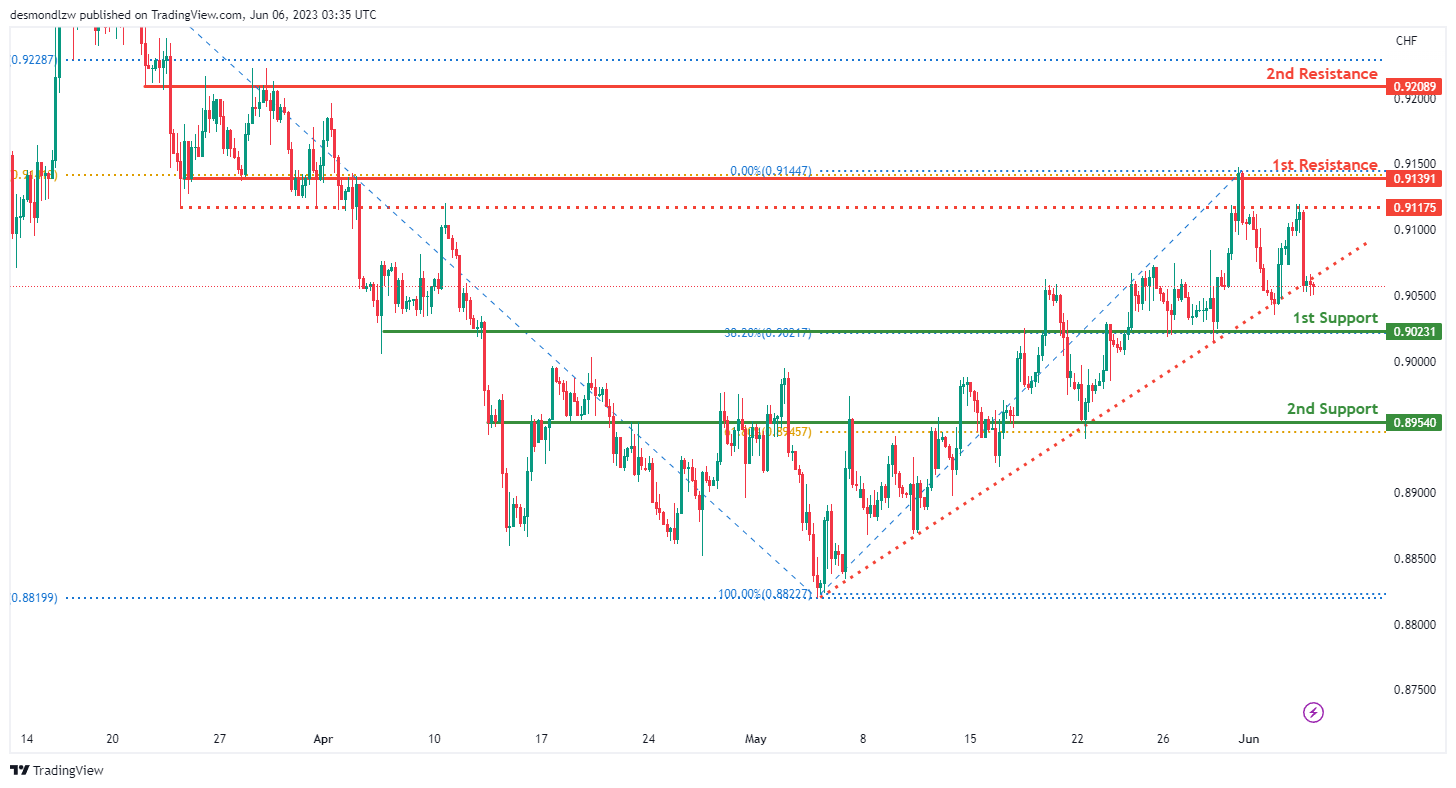
The USD/CHF chart is showing weak bearish momentum, which means the trend is mildly downward. This bearish sentiment could intensify if the price breaks below the ascending trendline, which could trigger a drop to the first support level. In this scenario, the price might continue its bearish trend towards the first support level.
The first support level is at 0.9023. This is an overlap support level and is also at the 38.2% Fibonacci retracement level. The combination of a support level and a key Fibonacci level often indicates a significant price floor where buyers might enter the market.
The second support level is at 0.8954. This is also an overlap support level and is further strengthened by being at the 61.8% Fibonacci retracement level. This dual significance could mark a strong potential buying point.
The first resistance level is at 0.9139. This level is an overlap resistance, suggesting it’s a significant level where sellers might come into the market.
The second resistance level is at 0.9209. This level is also an overlap resistance, marking it as another potential selling point.
USD/JPY:
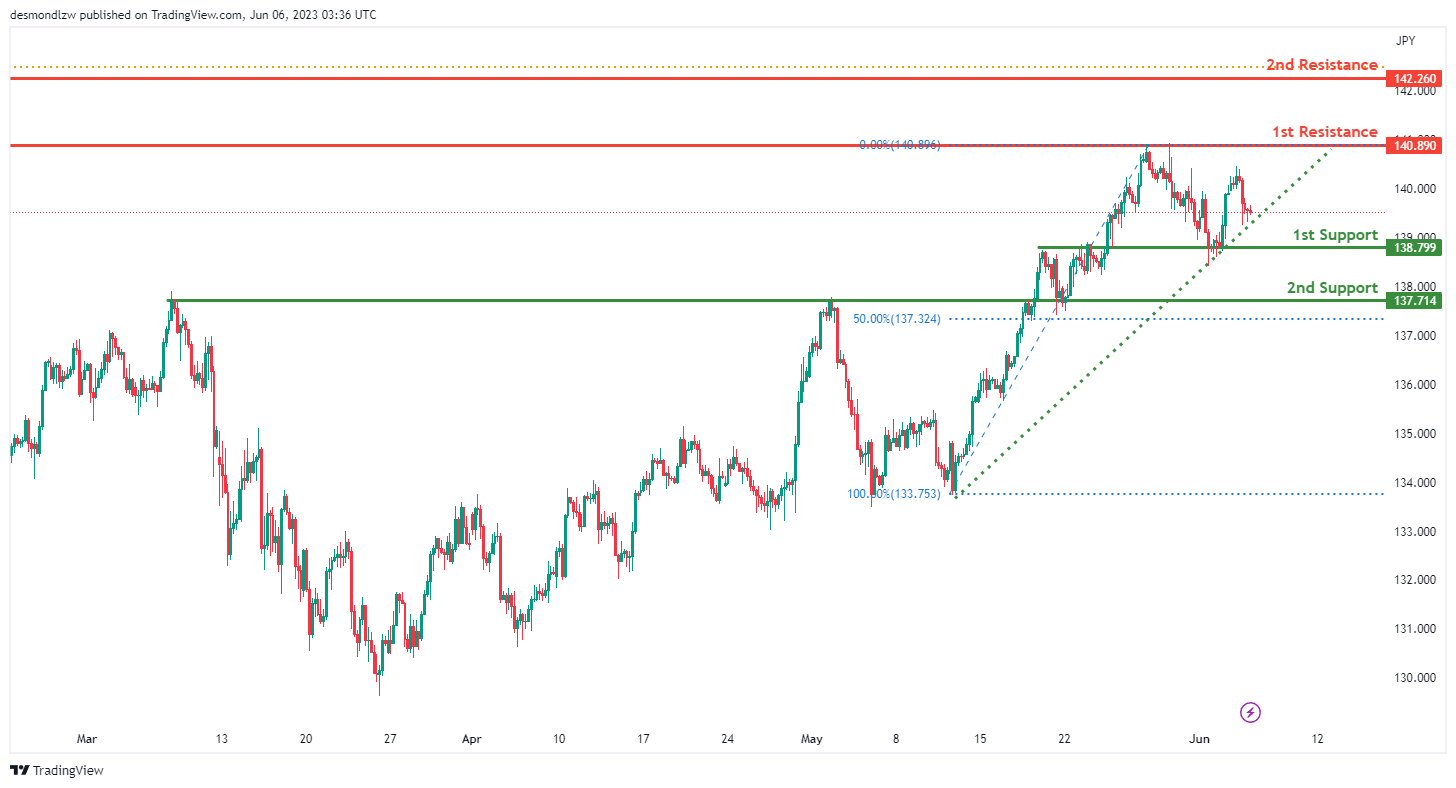
The USD/JPY chart is showing weak bullish momentum, which means the trend is mildly upward. This bullish sentiment could be reinforced as the price is currently above a major ascending trendline, suggesting that further bullish momentum is possible. In this scenario, the price might continue its bullish trend towards the first resistance level.
The first support level is at 138.80. This is an overlap support level, which often indicates a significant price floor where buyers might enter the market.
The second support level is at 137.71. This is also an overlap support level and is further strengthened by being at the 50% Fibonacci retracement level. This dual significance could mark a strong potential buying point.
The first resistance level is at 140.89. This level is an overlap resistance, suggesting it’s a significant level where sellers might come into the market.
The second resistance level is at 142.26. This level is also an overlap resistance, marking it as another potential selling point.
USD/CAD:
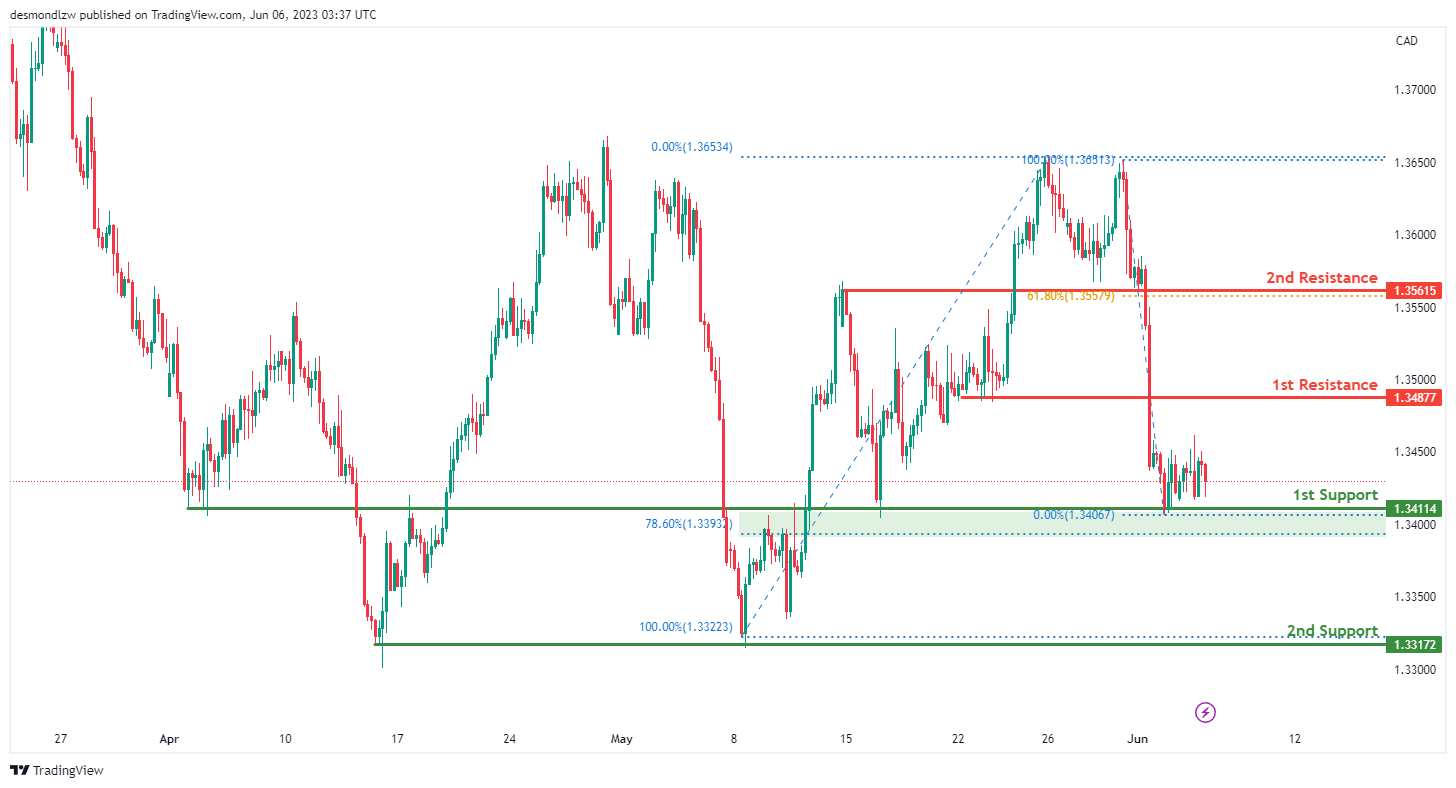
The USD/CAD chart is currently showing weak bullish momentum. Despite the low confidence, it suggests a mild upward trend, but the price may initially drop to the first support level before rebounding and rising towards the first resistance level.
The first support level is at 1.3411. This level is an overlap support, meaning it’s a price point where buyers have previously entered the market. It also corresponds to the 78.60% Fibonacci retracement level, indicating it could be a significant level for potential buyers.
The second support level is at 1.3317. This is another overlap support, which is usually an area of increased buying pressure.
The first resistance level is at 1.3488. This is an overlap resistance level, which often acts as a price ceiling where sellers may enter the market.
The second resistance level is at 1.3562. It is also an overlap resistance level and aligns with the 61.80% Fibonacci retracement level, which could attract sellers and potentially trigger a price reversal.
AUD/USD:
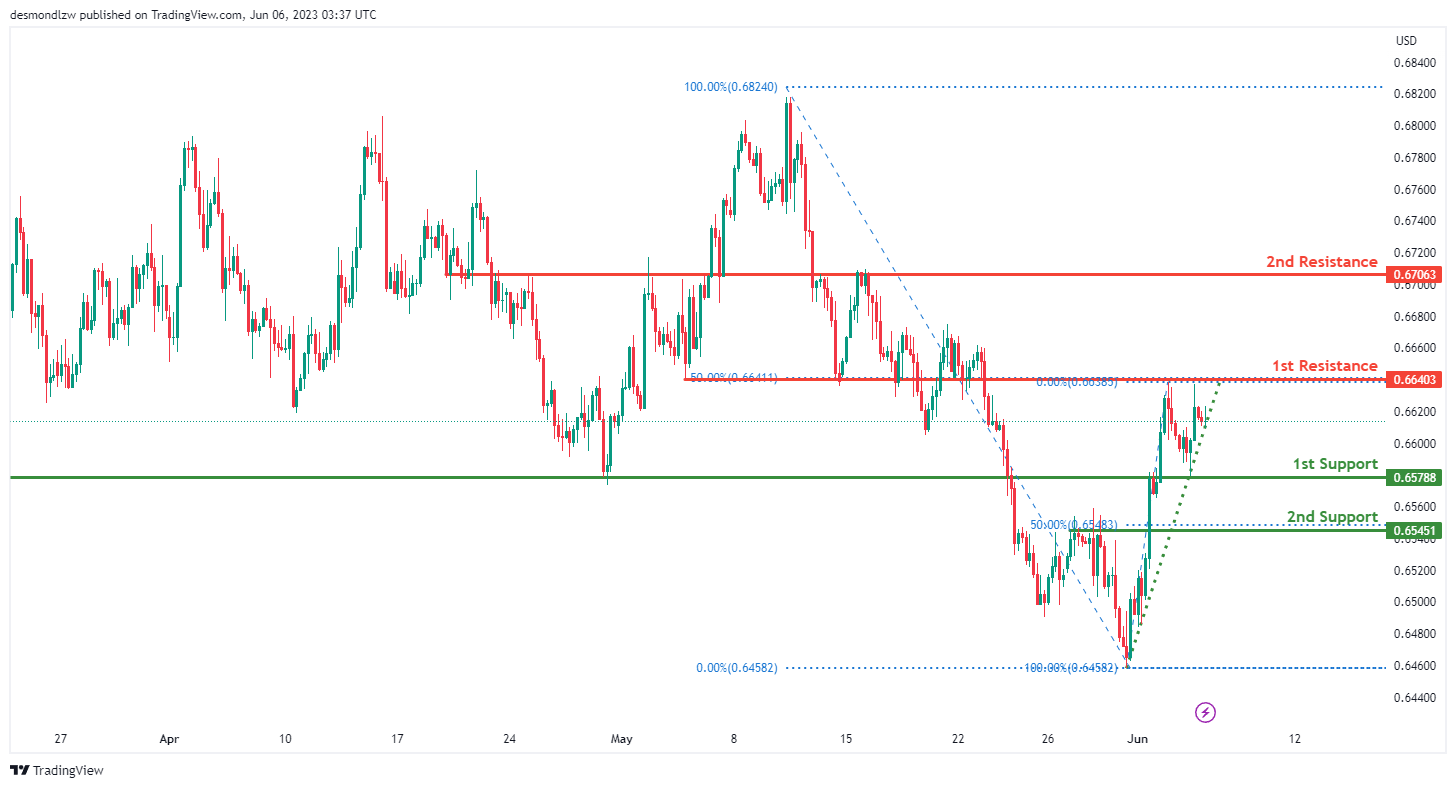
The AUD/USD chart is currently showing weak bullish momentum. Despite the low confidence, the price is above a major ascending trend line suggesting further bullish momentum. There’s the potential for the price to continue rising towards the first resistance level.
The first support level is at 0.6579. This is an overlap support, suggesting it’s a point where buyers have previously entered the market, making it a possible area for a bounce.
The second support level is at 0.6545. This is another overlap support and also corresponds to the 50% Fibonacci retracement level, making it a significant level for potential buyers.
The first resistance level is at 0.6640. This is an overlap resistance level, which often acts as a price ceiling. It is also at the 50% Fibonacci retracement level, potentially marking it as a point of interest for sellers.
The second resistance level is at 0.6706. This level is also an overlap resistance, which means it could act as a point of resistance for further price ascension.
NZD/USD
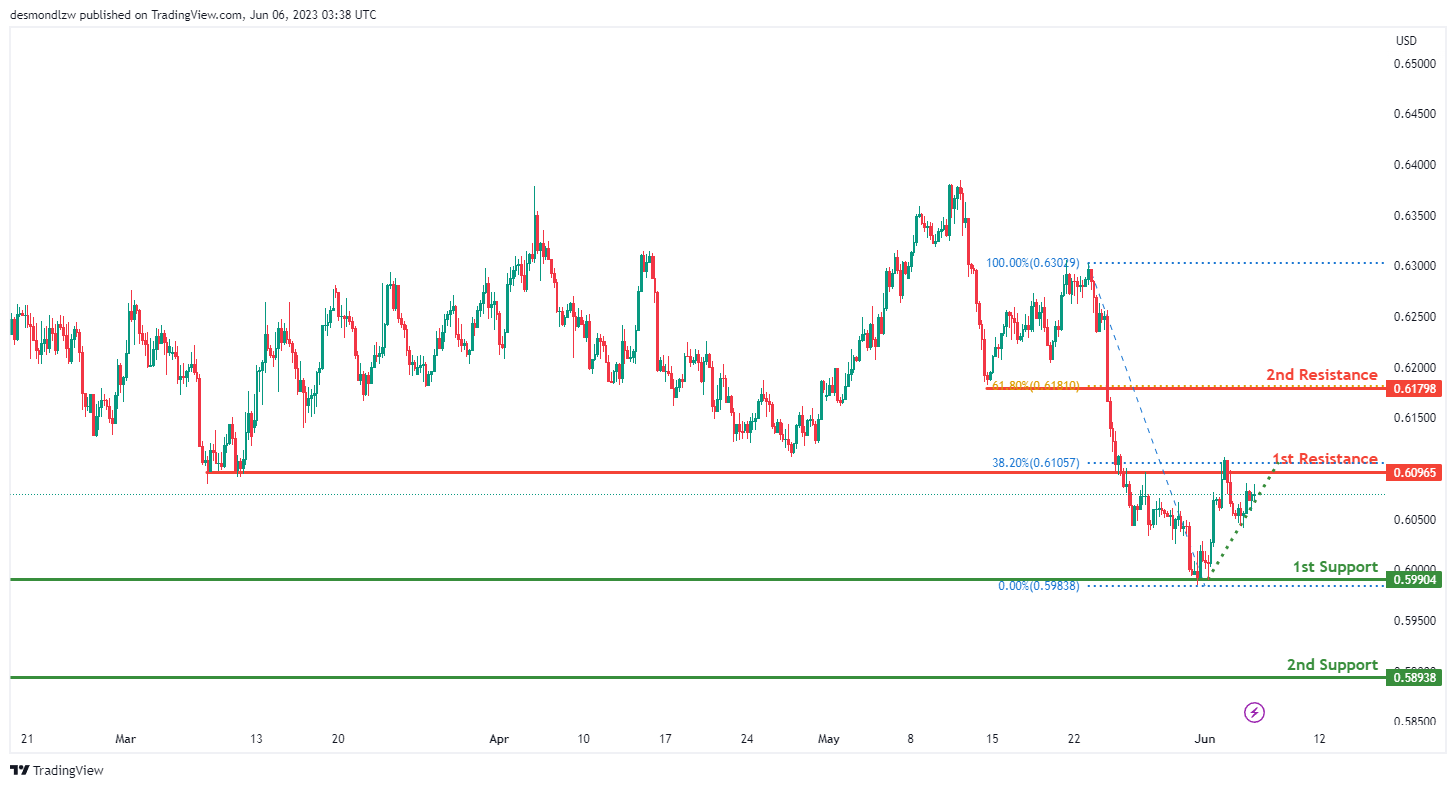
The NZD/USD chart is currently showing bullish momentum. The price is above a major ascending trend line which suggests further bullish momentum could be in the cards. There’s the potential for the price to continue its bullish movement towards the first resistance level.
The first support level is at 0.5990. This is an overlap support, meaning it’s a point where buyers have previously entered the market, making it a possible area for a bounce.
The second support level is at 0.5894. This is another overlap support, again suggesting a possible area of buying interest.
The first resistance level is at 0.6097. This is an overlap resistance level, which often acts as a price ceiling. It is also at the 38.20% Fibonacci retracement level, making it a significant level for potential sellers.
The second resistance level is at 0.6180. This level is also an overlap resistance and corresponds to the 61.80% Fibonacci retracement level. This combination could make it a strong resistance point for further price ascension.
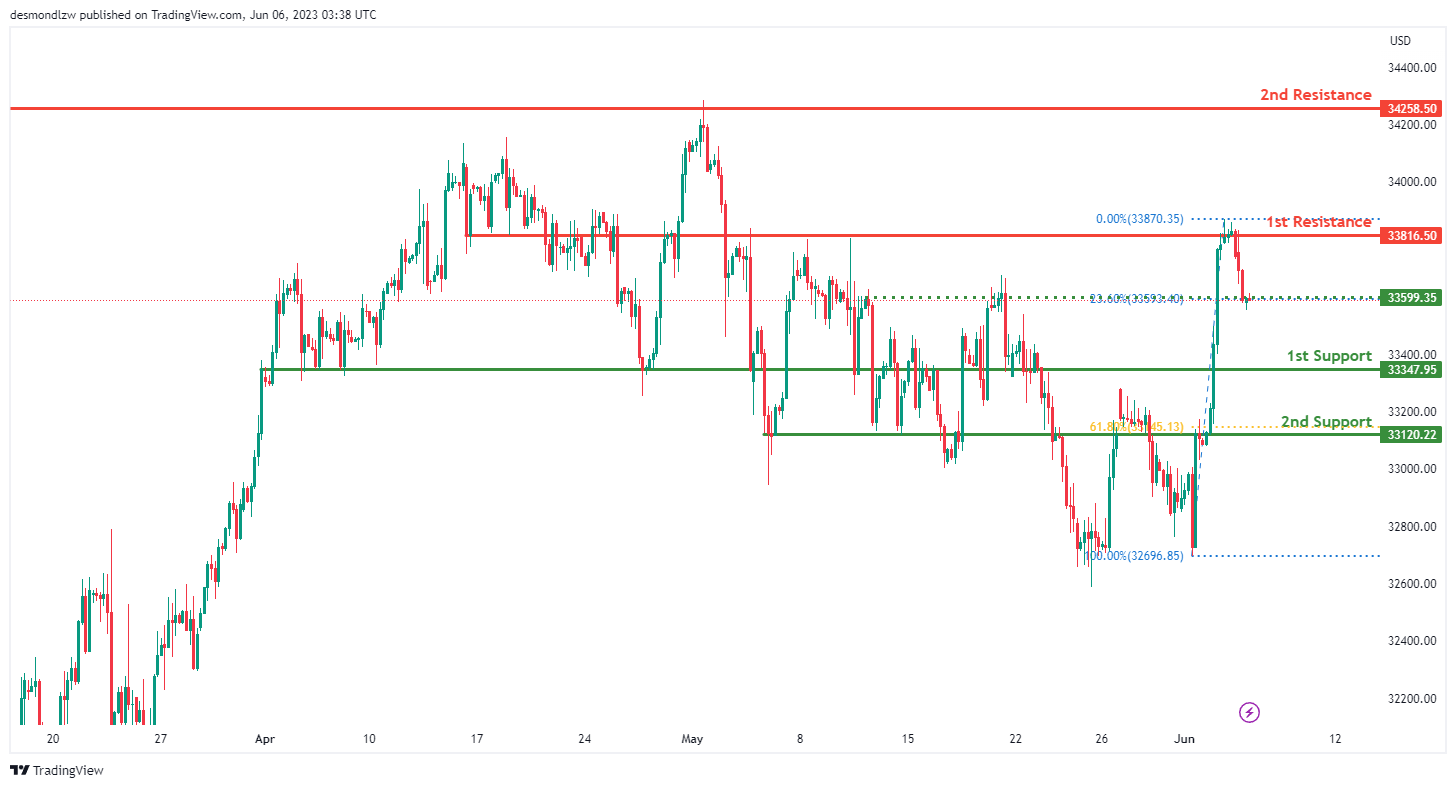
DJ30:
The DJ30 (Dow Jones Industrial Average) chart currently shows neutral momentum, suggesting that the price could fluctuate between the first resistance and first support levels. There is also an intermediate support at 33599.35 which is marked by the 23.6% Fibonacci retracement level.
The first support level is at 33347.95. This is an overlap support, indicating a point where buyers have previously entered the market, making it a possible area for a bounce.
The second support level is at 33120.22. This is another overlap support, again suggesting a possible area of buying interest. Additionally, it aligns with the 61.80% Fibonacci retracement level, adding to its significance as a potential price floor.
The first resistance level is at 33816.50. This is an overlap resistance level, which often acts as a price ceiling, making it a significant level for potential sellers.
The second resistance level is at 34258.5. This is also an overlap resistance, meaning that it could act as a barrier to further price ascension..
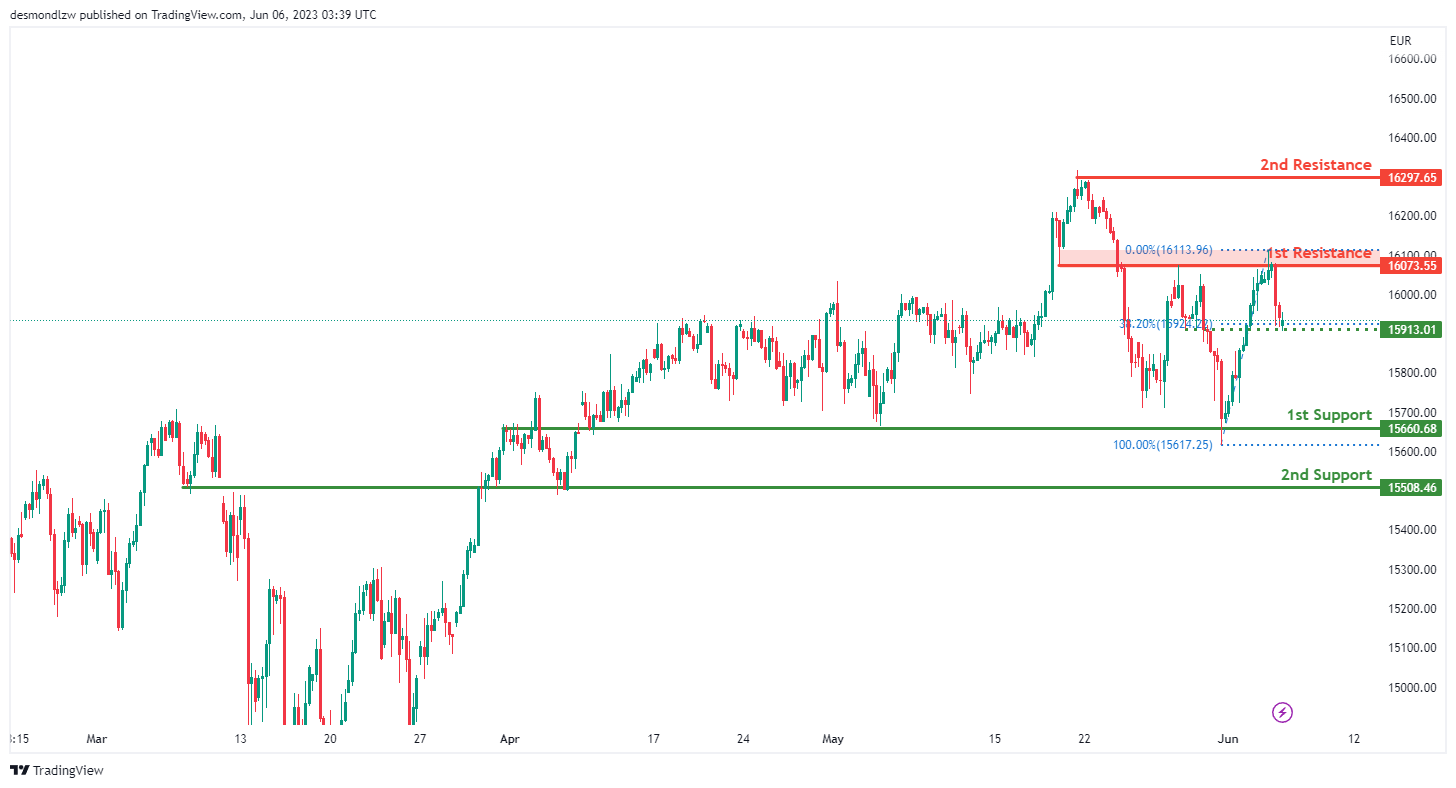
GER30:
The GER30 (DAX Index) chart currently shows neutral momentum, suggesting that the price could oscillate between the first resistance and first support levels. There is also an intermediate support at 15913.01 which is marked by the 38.2% Fibonacci retracement level.
The first support level is at 15660.68. This is an overlap support, indicating a point where buyers have historically entered the market, making it a probable area for a potential price rebound.
The second support level is at 15508.46. This is another overlap support, which also suggests a possible area of buying interest and can act as a significant level for buyers to possibly enter the market or for sellers to take profits.
The first resistance level is at 16073.55. This is an overlap resistance level, which often acts as a price ceiling, making it a critical level for potential selling interest.
The second resistance level is at 16297.65. This is also an overlap resistance, meaning it could potentially hinder further price increases.
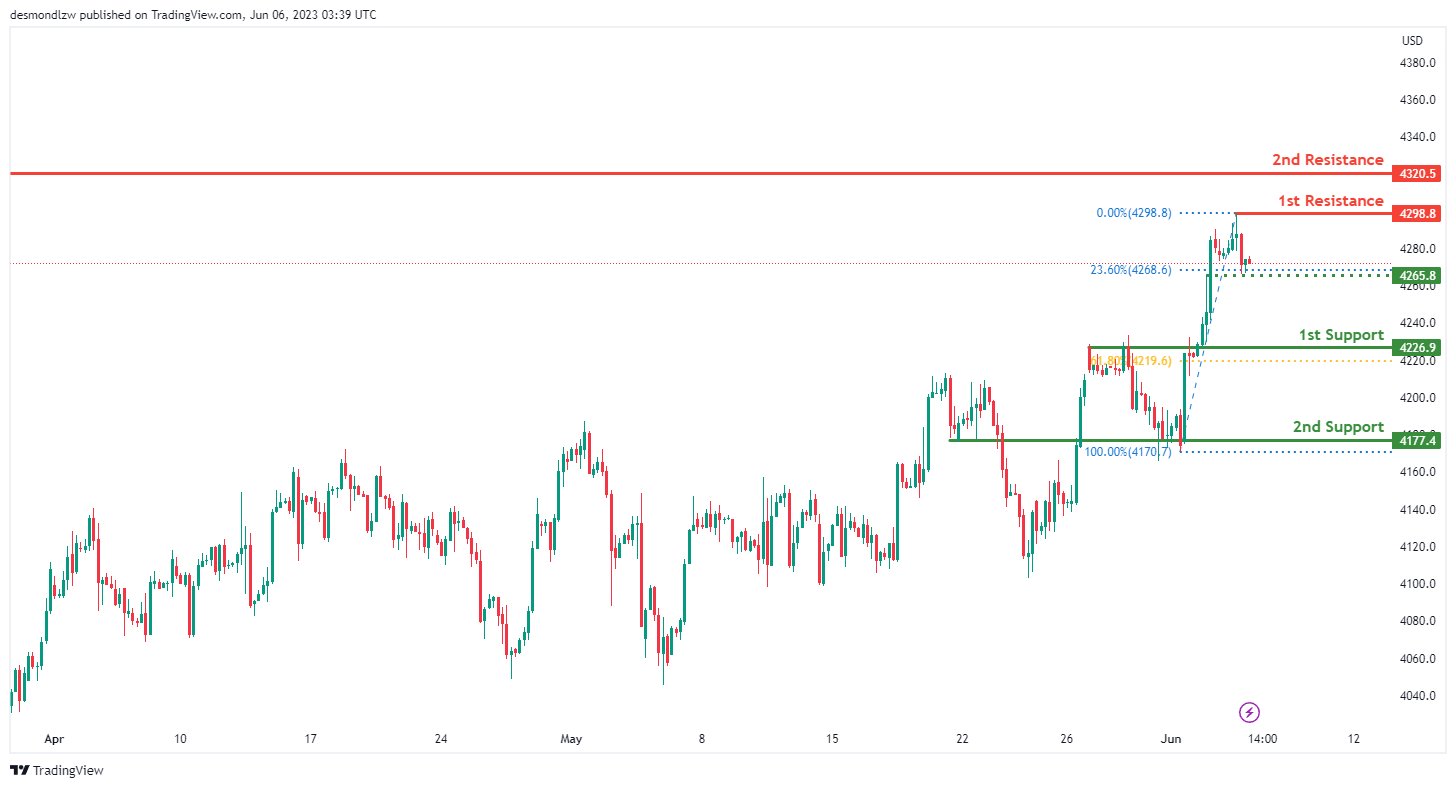
US500
The US500 (S&P 500 Index) chart currently shows neutral momentum, which suggests that the price might fluctuate between the first resistance and first support levels. There is also an intermediate support at 4265.80 which is marked by the 23.6% Fibonacci retracement level.
The first support level is at 4226.90. This is an overlap support and it also aligns with the 61.80% Fibonacci retracement level. This dual confluence increases the likelihood that this level could act as a strong price floor where buyers might step in.
The second support level is at 4177.40. This level is another overlap support, indicating a level where buyers have historically shown interest. If the price drops to this level, it could attract buying interest.
The first resistance level is at 4298.80. This level is identified as a swing high resistance, marking a recent peak in price where sellers had previously taken control. If the price reaches this level, it could face selling pressure.
The second resistance level is at 4320.50. This level is an overlap resistance, meaning it’s a level where sellers have historically come into the market, suggesting potential selling pressure if the price approaches this level.
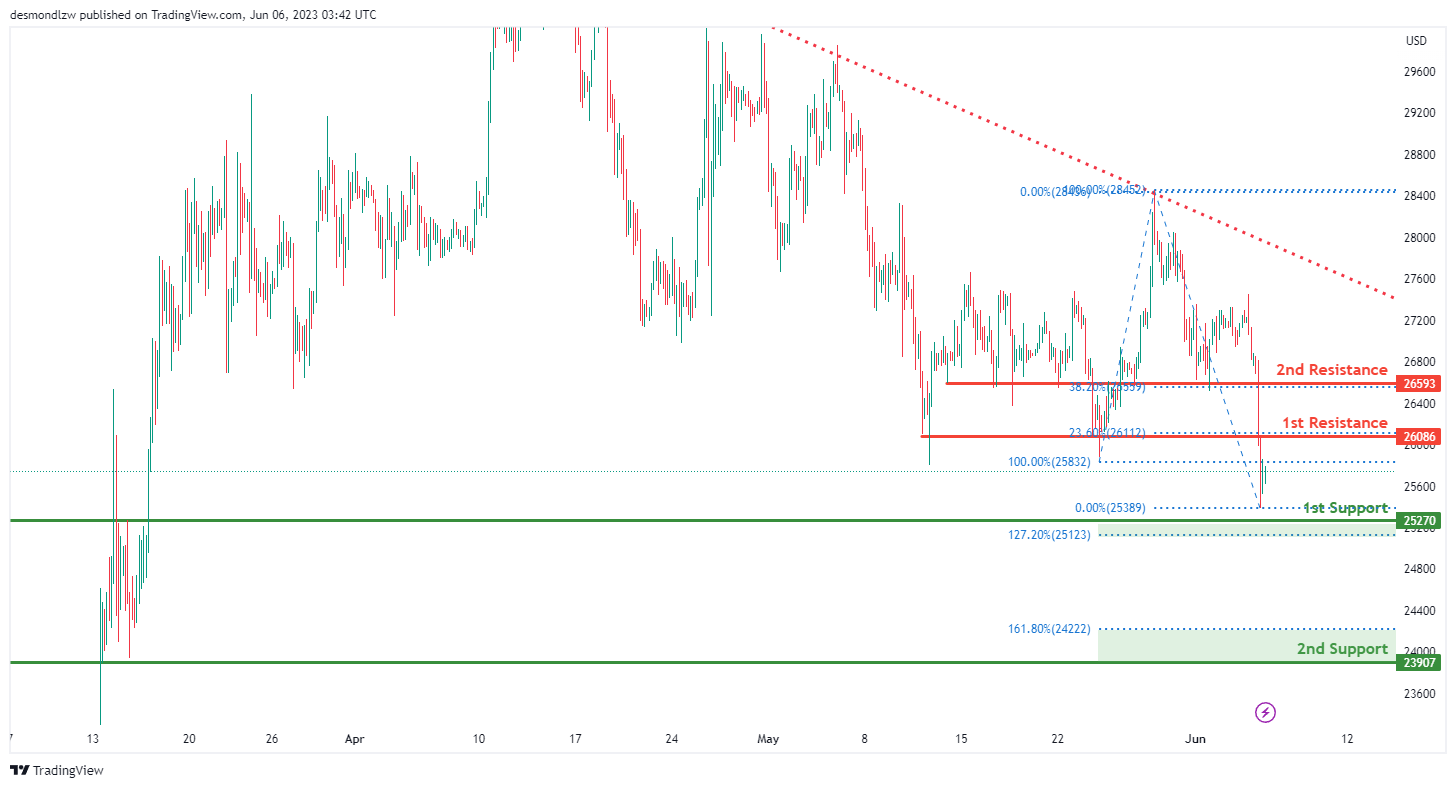
BTC/USD:
The BTC/USD chart is currently showing bearish momentum. This implies that sellers are dominating the market and the price is more likely to fall than to rise.
The first support level is at 25270.00. This is an overlap support, which means that it is a level where buyers have historically shown interest. Moreover, this support aligns with the 127.20% Fibonacci Extension level, which further strengthens its potential to hold as support.
The second support level is at 23907.00. This is another overlap support, again representing a price level where buyers have previously entered the market. It also coincides with the 161.80% Fibonacci Extension level, indicating that it is a strong potential support level.
The first resistance level is at 26086.00. This level is an overlap resistance, meaning that it is a level where sellers have historically come into the market. Furthermore, it aligns with the 23.60% Fibonacci Retracement level, adding to its potential as a resistance level.
The second resistance level is at 26593.00. This is another overlap resistance, and it is also at the 38.20% Fibonacci Retracement level, indicating that it could be a significant resistance level where sellers might step in..
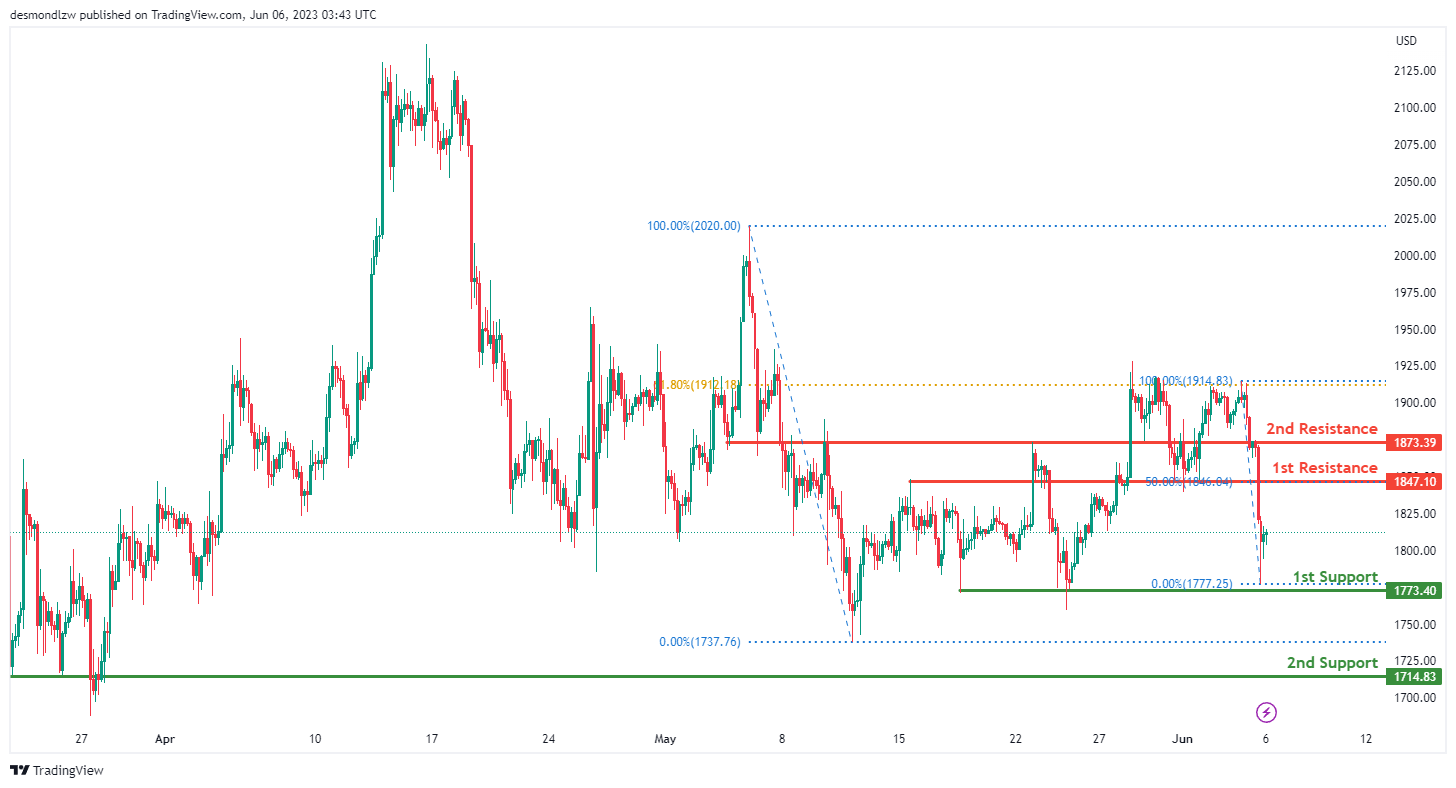
ETH/USD:
The ETH/USD chart is currently showing bearish momentum. This suggests that the market is dominated by sellers and there is a potential for the price to continue falling.
The first support level is at 1773.40. This is an overlap support, which means that it is a level where buyers have historically shown interest. This support level may hold strong and prevent further price decline.
The second support level is at 1714.83. Similar to the first, this is another overlap support, indicating a price level where buyers have previously entered the market, potentially offering further support to the price.
The first resistance level is at 1847.10. This level is an overlap resistance, signifying a point where sellers have historically entered the market. Moreover, it aligns with the 50% Fibonacci Retracement level, adding to its strength as a potential resistance level.
The second resistance level is at 1873.39. This is another overlap resistance, reinforcing that it could be a significant level where sellers might emerge.
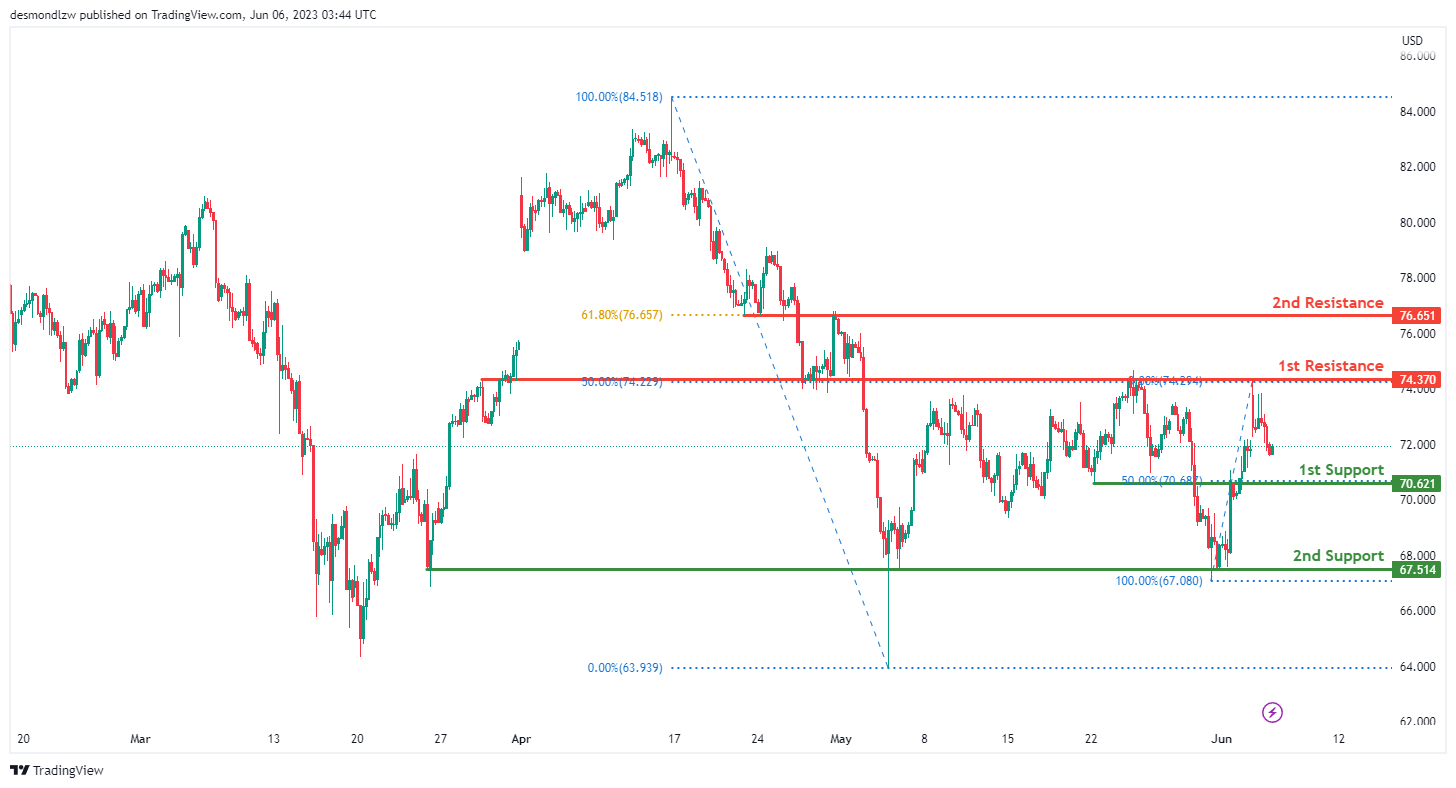
WTI/USD:
The WTI (West Texas Intermediate) chart is currently showing neutral momentum. This suggests that the market is indecisive, with neither buyers nor sellers having a definitive advantage.
The first support level is at 70.62. This is an overlap support, a level where buying interest has historically been strong. It’s also significant because it coincides with the 50% Fibonacci Retracement level, which often acts as a major support or resistance level in financial markets.
The second support level is at 67.51. This level is also an overlap support, indicating a price level where buyers have previously entered the market.
The first resistance level is at 74.37. This level is an overlap resistance, which means it’s a point where sellers have historically entered the market. Interestingly, this level also coincides with the 50% Fibonacci Retracement level, which could add to its validity as a resistance level.
The second resistance level is at 76.65. This is another overlap resistance, indicating a potential price level where selling interest might increase. It also aligns with the 61.80% Fibonacci Retracement level, adding further strength to this resistance..
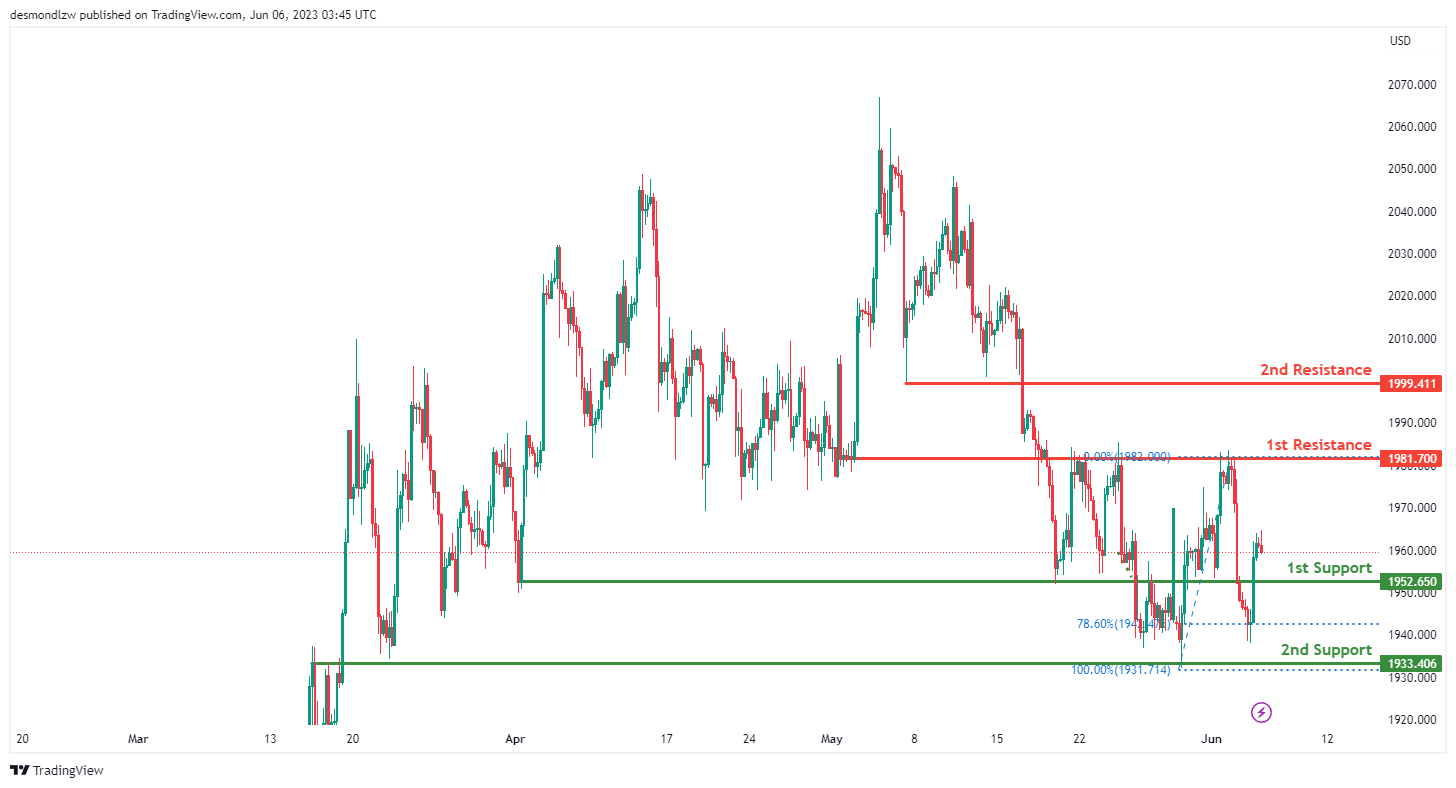
XAU/USD (GOLD):
The XAU/USD (Gold) chart is currently showing a bearish momentum. This suggests that sellers are currently controlling the market.
The first support level is at 1952.65. This is an overlap support, indicating a price level where buying interest has historically been strong. Traders could potentially look for buying opportunities at this level.
The second support level is at 1933.41. This is another overlap support, a point where the market has previously seen increased buying interest. If the price continues to drop, this could be a potential area where buyers might step in.
The first resistance level is at 1981.70. This is an overlap resistance, indicating a price level where selling interest has previously been strong. If the price rises to this level, it could face selling pressure.
The second resistance level is at 1999.41. This is another overlap resistance. This level may act as a barrier to upward price movement, with sellers potentially stepping in to push prices down.
The accuracy, completeness and timeliness of the information contained on this site cannot be guaranteed. IC Markets does not warranty, guarantee or make any representations, or assume any liability regarding financial results based on the use of the information in the site.
News, views, opinions, recommendations and other information obtained from sources outside of www.icmarkets.com, used in this site are believed to be reliable, but we cannot guarantee their accuracy or completeness. All such information is subject to change at any time without notice. IC Markets assumes no responsibility for the content of any linked site.
The fact that such links may exist does not indicate approval or endorsement of any material contained on any linked site. IC Markets is not liable for any harm caused by the transmission, through accessing the services or information on this site, of a computer virus, or other computer code or programming device that might be used to access, delete, damage, disable, disrupt or otherwise impede in any manner, the operation of the site or of any user’s software, hardware, data or property.