
EUR/USD:
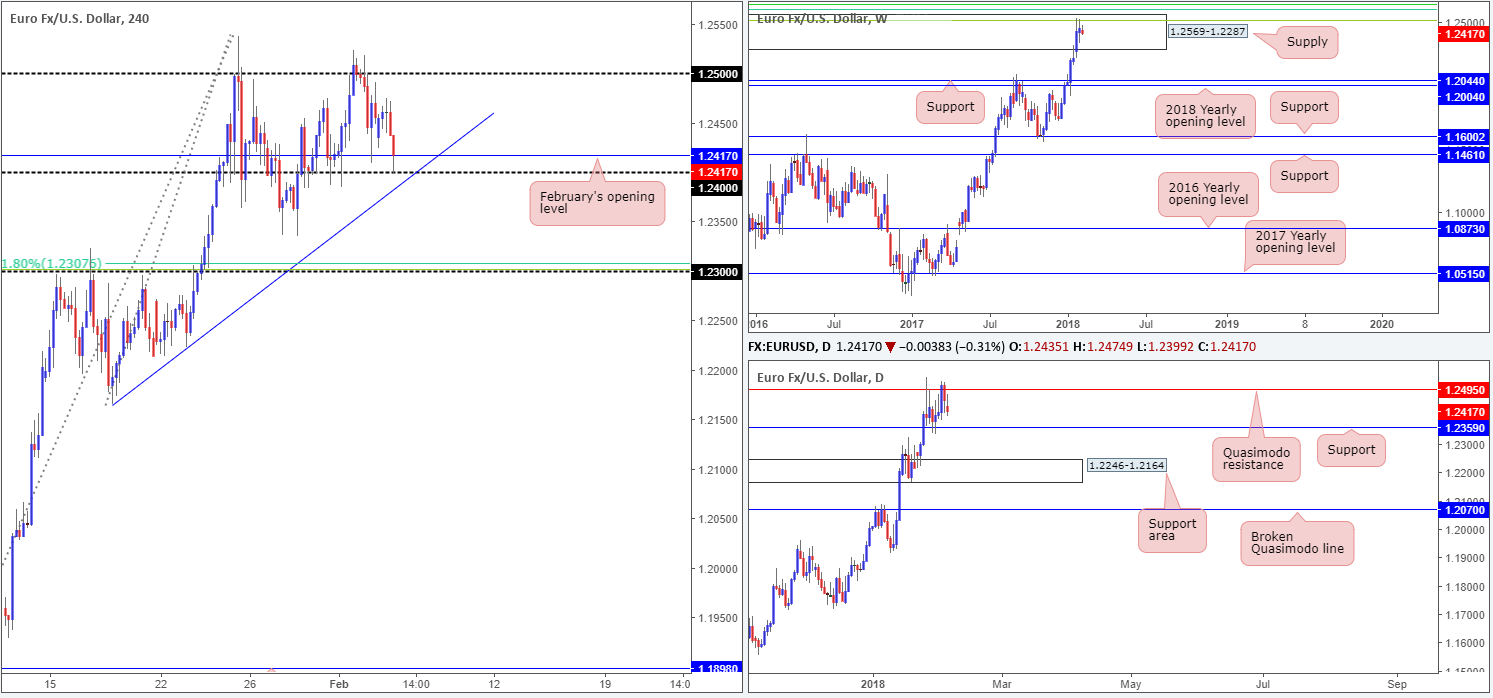
Dollar bulls went on the offensive in recent sessions (key monthly support at 88.50 seen plotted on the US dollar index was recently brought into the fray), forcing the EUR/USD to turn lower and revisit February’s opening level (H4) at 1.2417/1.24 handle.
Technically speaking, 1.24/1.2417 is not an area we’d label a high-probability reversal zone, even with a nearby H4 trendline support lurking just below (taken from the low 1.2165). Our reasoning lies within the higher-timeframe structures. As you can see, weekly price remains trading within the walls of a strong-looking weekly supply area at 1.2569-1.2287. Not only this, traders may have also noticed the weekly Fibonacci resistance cluster (green lines) seen circling around the top edge of this zone:
- 61.8% Fib resistance at 1.2604 taken from the high 1.3993.
- 50.0% Fib resistance at 1.2644 taken from the high 1.4940.
- 38.2% Fib resistance at 1.2519 taken from the high 1.6038.
In addition to weekly action, daily movement shows room to press as low as the daily support band coming in at 1.2359. This – coupled with potential weekly selling pressure – is likely to push the euro beyond current H4 support structures.
Potential trading zones:
A H4 close beyond the current H4 trendline support would likely interest breakout sellers. While they would be selling alongside weekly flow, they’d simultaneously be shorting into daily support – not really ideal selling conditions, in our view.
Ultimately, for us, we would need the aforementioned daily support cleared to confirm bearish resumption.
On account of the above, remaining on the sidelines may be the better path to take at this time.
Data points to consider: German Buba President Weidmann speaks at 9am GMT.
Areas worthy of attention:
Supports: 1.24 handle; 1.2417; H4 trendline support; 1.2359.
Resistances: 1.2569-1.2287; Weekly Fib cluster.
GBP/USD:
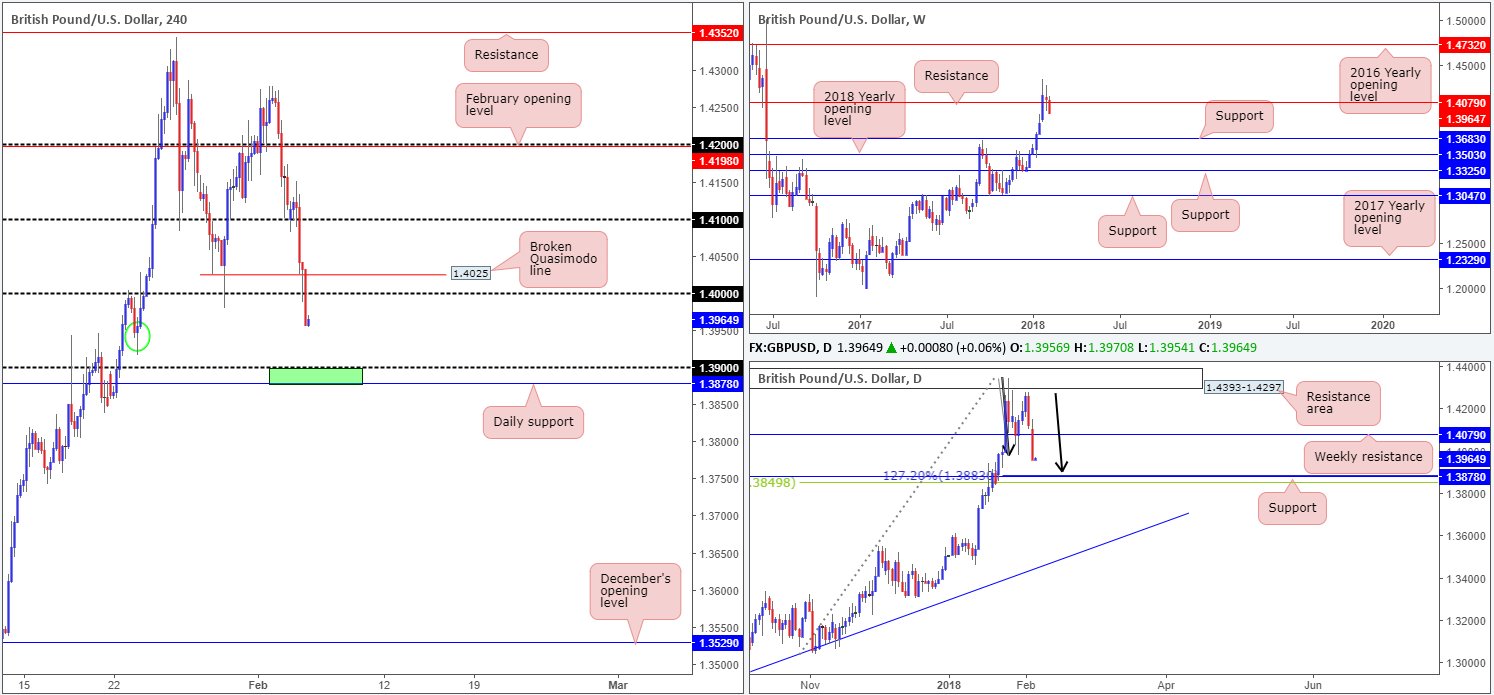
The British pound resumed its downside trajectory on Monday, forming a full-bodied daily bearish candle in the process. This move, which looks to have begun following a lower-than-expected UK services PMI reading, eventually dragged price beneath multiple tech supports, including weekly support at 1.4079 (now acting resistance).
Also worth noting is that daily price ended the day closing within striking distance of a daily support at 1.3878, which happens to house a daily AB=CD (see black arrows) 127.2% correction point at 1.3883 and a 38.2% daily Fib support at 1.3849.
Across on the H4 timeframe, we can see that H4 movement recently crossed below the 1.40 landmark in strong fashion and apart from the minor H4 demand circled in green at 1.3915-1.3955, the path south appears relatively free down to 1.39.
Potential trading zones:
Daily support mentioned above at 1.3878 and its merging AB=CD formation, along with the 1.39 handle on the H4 timeframe, is certainly an area (green zone) traders likely have their crosshairs fixed on today.
Although we really like the noted green zone, traders also need to be prepared for the possibility of price extending losses today/this week. This is due to weekly price showing a reasonably clear path down to weekly support at 1.3683.
Data points to consider: No high-impacting events seen on the docket.
Areas worthy of attention:
Supports: 1.3915-1.3955; 1.39 handle; 1.3878; 1.3883; 1.3849; 1.3683.
Resistances: 1.4025; 1.40 handle; 1.4079.
AUD/USD:
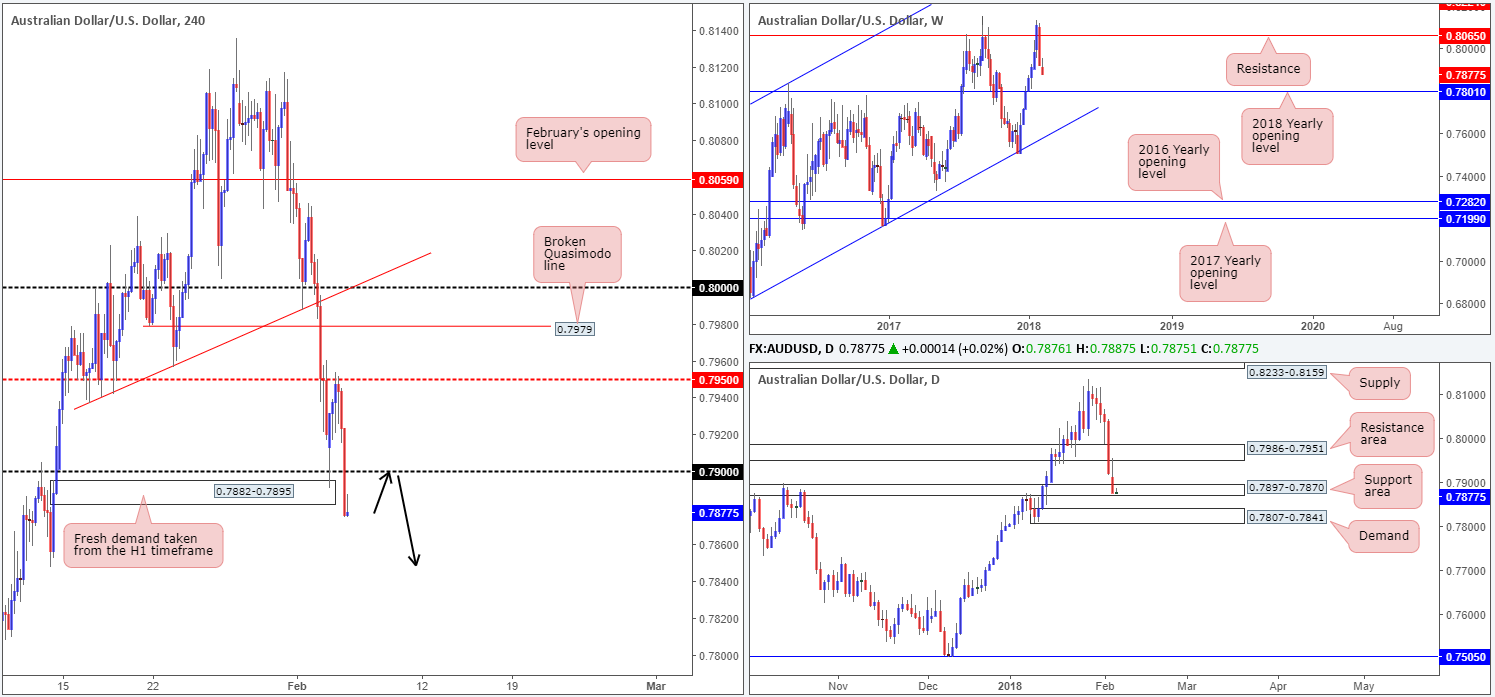
The commodity-linked currency began the day on a strong footing, after whipsawing below the 0.79 handle and connecting with a H1 demand base at 0.7882-0.7895 (this was a noted zone for possible longs – well done to any of our readers who managed to take advantage of this area). The move, as you can see, lifted the pair up the H4 mid-level resistance at 0.7950, before collapsing lower in dramatic fashion, ending the day clocking lows of 0.7875.
On the weekly timeframe, there’s room for the sellers to extend as far south as the 2018 yearly opening level at 0.7801. Daily price on the other hand, remains within the lower limits of a daily support area at 0.7897-0.7870 but does look incredibly vulnerable at this point.
Potential trading zones:
Judging by the weakness seen within the daily support area, and room to press lower seen on the weekly timeframe, a short on any solid retest seen at 0.79 on the H4 timeframe (see arrows) could be an option today, targeting the H4 mid-level support at 0.7850, followed closely by daily demand at 0.7807-0.7841 (the next downside target on the daily scale beyond the current daily support area) and then weekly support at 0.7801.
Data points to consider: AU. Retail sales m/m and trade balance at 12.30am; RBA statement and cash rate at 3.30am GMT.
Areas worthy of attention:
Supports: 0.7850; 0.7897-0.7870; 0.7801; 0.7807-0.7841.
Resistances: 0.79 handle.
USD/JPY:
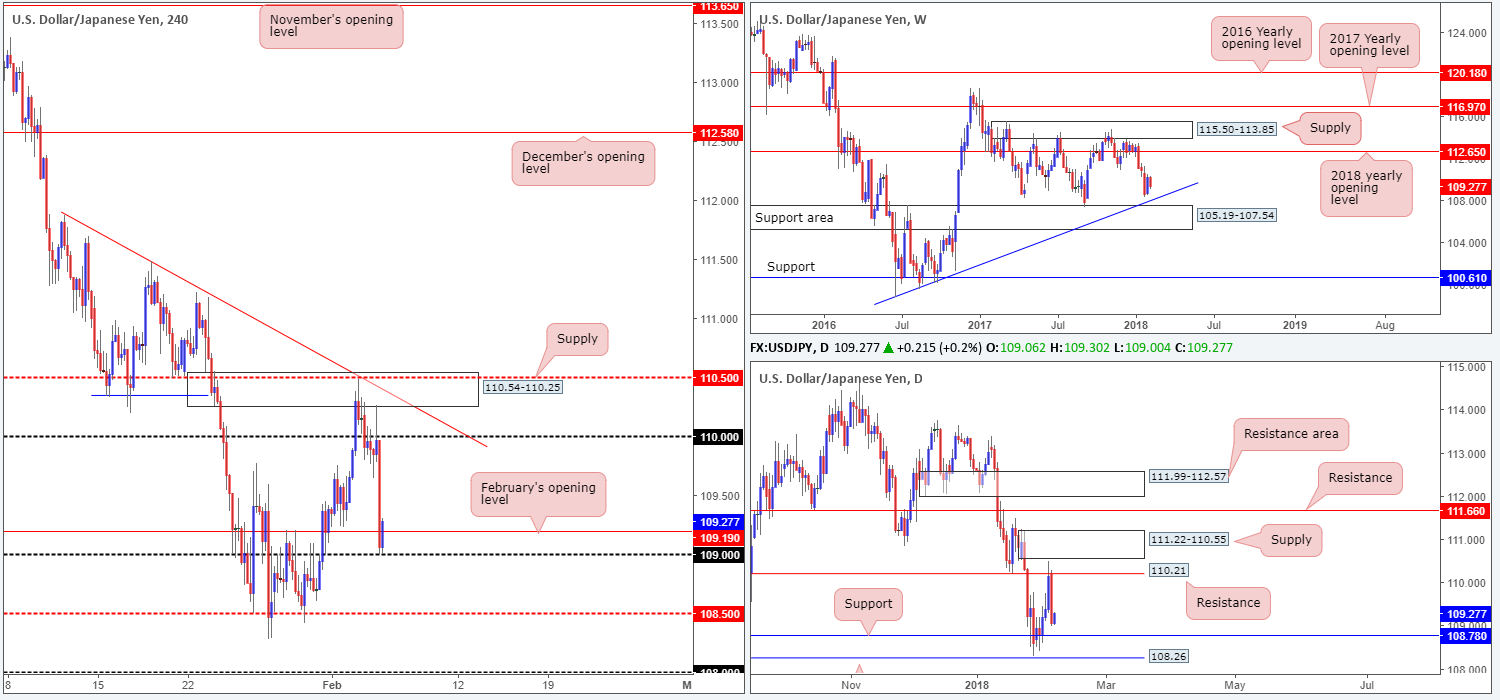
US equity indexes plunged on Monday, consequently dragging the USD/JPY lower.
After failing to sustain gains above the 110 handle on the H4 timeframe (thanks largely to the H4 supply at 110.54-110.25 and daily resistance at 110.21), the pair aggressively dropped lower and surpassed February’s opening line at 109.19 and ended the day touching gloves with the 109 handle.
What this move also did was position daily flow within shouting distance of a daily support plotted at 108.78, and has re-opened the possibility of a move being seen back down to the weekly trendline support extended from the low 98.78.
Potential trading zones:
As we write, the H4 candles are seen pushing higher from 109, possibly attempting to close back above 109.19. Looking to join this momentum is challenging as we know both weekly and daily price portend lower prices (see above). Given this, neither a long nor short seems attractive right now, and therefore remaining on the sidelines may be the better approach today.
Data points to consider: No high-impacting events seen on the docket.
Areas worthy of attention:
Supports: 109 handle; 108.78; Weekly trendline support.
Resistances: 109.19; 110 handle.
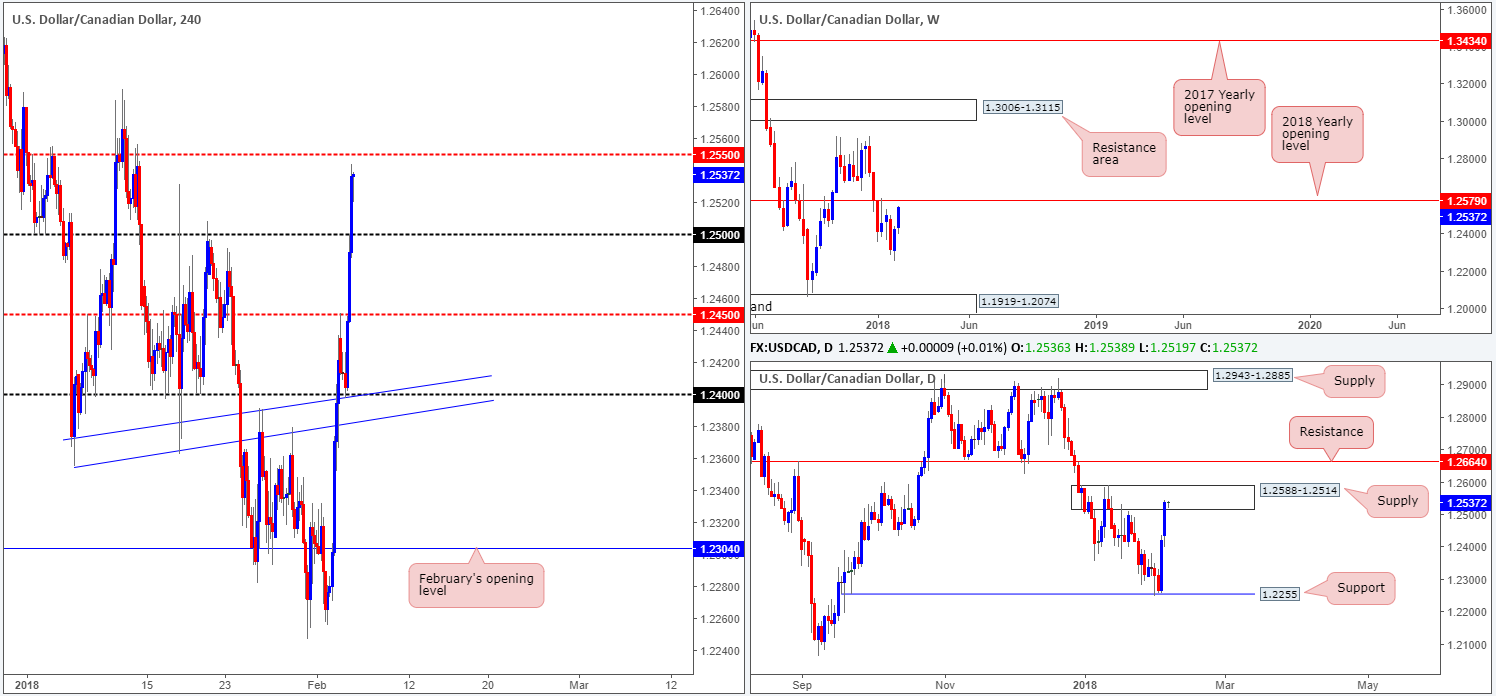
USD/CAD:
USD/CAD bulls went on the offensive for a second consecutive day on Monday, as WTI prices softened and the US dollar put in a strong performance above monthly support at 88.50 (US dollar index).
As can be clearly seen on the weekly timeframe, price is nearing a critical juncture at 1.2579: the 2018 yearly opening level. This level is expected to house active sellers; therefore do be prepared for potential selling.
Turning the focus down to the daily timeframe, the unit is currently seen trading within a daily supply zone fixed at 1.2588-1.2514, which happens to house the noted 2018 yearly opening level within the upper limit.
H4 action cleared the 1.25 handle on Monday, and concluded the day topping just ahead of the H4 mid-level resistance at 1.2550.
Potential trading zones:
While dollar buying is strong right now, buying this momentum knowing that weekly and daily price are trading at major-league resistances might not be the best option, in our opinion.
There’s a chance that the 2018 yearly level may be left unchallenged, should daily sellers make an appearance within the current daily supply. This could potentially pull H4 price back down to 1.25.
As for potential trading zones, we do not see much on offer at this time. Well, not anything with sufficient confluence that is! As a result, we’ll see how price behaves today and reassess going into tomorrow’s open.
Data points to consider: CAD trade balance at 1.30pm; CAD IVEY PMI at 3pm GMT.
Areas worthy of attention:
Supports: 1.25 handle.
Resistances: 1.2550; 1.2588-1.2514; 1.2579.
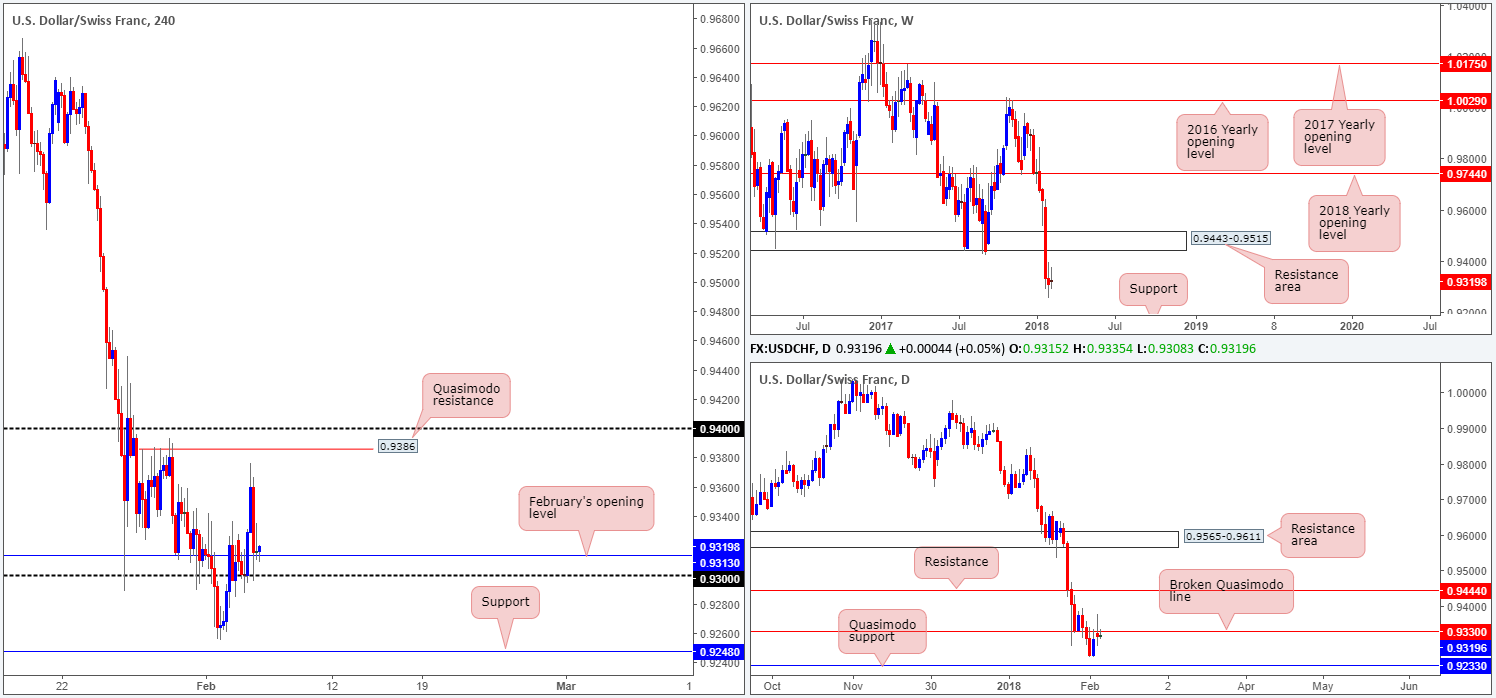
USD/CHF:
From the weekly timeframe this morning, we can clearly see price beginning to consolidate losses after a somewhat momentous drop in prices. Structurally though, weekly price could potentially continue driving south until we reach weekly support coming in at 0.9163 (not seen on the screen).
Although this is an eye-opening decline, it is worth remembering that the US dollar index is seen trading from a monthly support at 88.50.
Daily flow, on the other hand, is currently finding active sellers around a daily broken Quasimodo line registered at 0.9330. Should the bears succeed in defending this level; the next downside objective can be seen at 0.9233: a daily Quasimodo support band.
Across on the H4 candles, February’s opening level at 0.9313 and the nearby 0.93 psychological handle are back in the fight, after the unit faded session highs of 0.9376 during yesterday’s trading. Technically, the reason price is likely struggling to make headway simply comes down to the daily resistance mentioned above at 0.9330. Removing this level would open the doors for daily price to challenge 0.9444: a resistance level that also forms the lower edge of the weekly resistance area plotted at 0.9443-0.9515.
Potential trading zones:
Buying this market at current price is of course tempting, given where the US dollar is currently trading from at the moment. However, buying this market without any form of weekly support, and against daily resistance, is not something we’d label high probability. More confluence is needed, in our humble view.
Therefore, unless you have confidence in the US dollar, and are prepared for possible drawdown, buying the pair and targeting the H4 Quasimodo resistance at 0.9386, followed closely by the 0.94 handle, may very well be an option.
Data points to consider: No high-impacting events seen on the docket.
Areas worthy of attention:
Supports: 0.93 handle; 0.9213; 0.9233; 0.9163.
Resistances: 0.94 handle; 0.9386; 0.9330; 0.9444; 0.9443-0.9515.
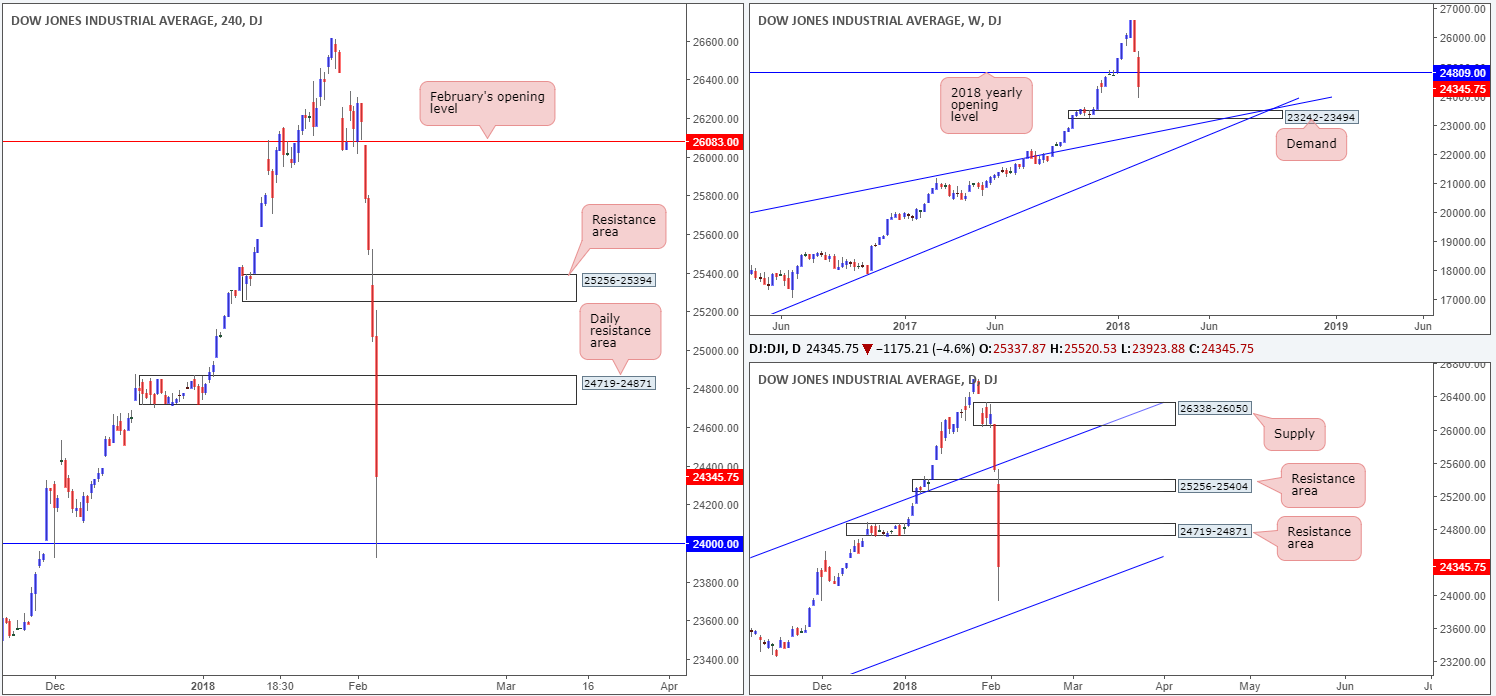
DOW 30:
US equity indexes took a brutal hit to the mid-section on Monday, recording one of the worst days in trading history for the DJIA, with all sectors registering losses.
Erasing all 2018 gains, the weekly chart shows that the index could potentially extend losses down to as far as weekly demand plotted at 23242-23494. By the same token, daily price also shows room to press as low as a daily channel support extended from the low 17883.
H4 price, as you can see, mildly pared losses from the 24000 mark. Should the buyers try to reclaim some of yesterday’s losses, expect selling pressure to be seen around the daily resistance area marked at 24719-24871.
Potential trading zones:
After such a momentous drop in value, looking to trade this market today may not be a good move. Waiting to see how the market responds will likely be more prudent.
Data points to consider: No high-impacting events seen on the docket.
Areas worthy of attention:
Supports: 24000; daily channel support; 23242-23494.
Resistances: 24719-24871.
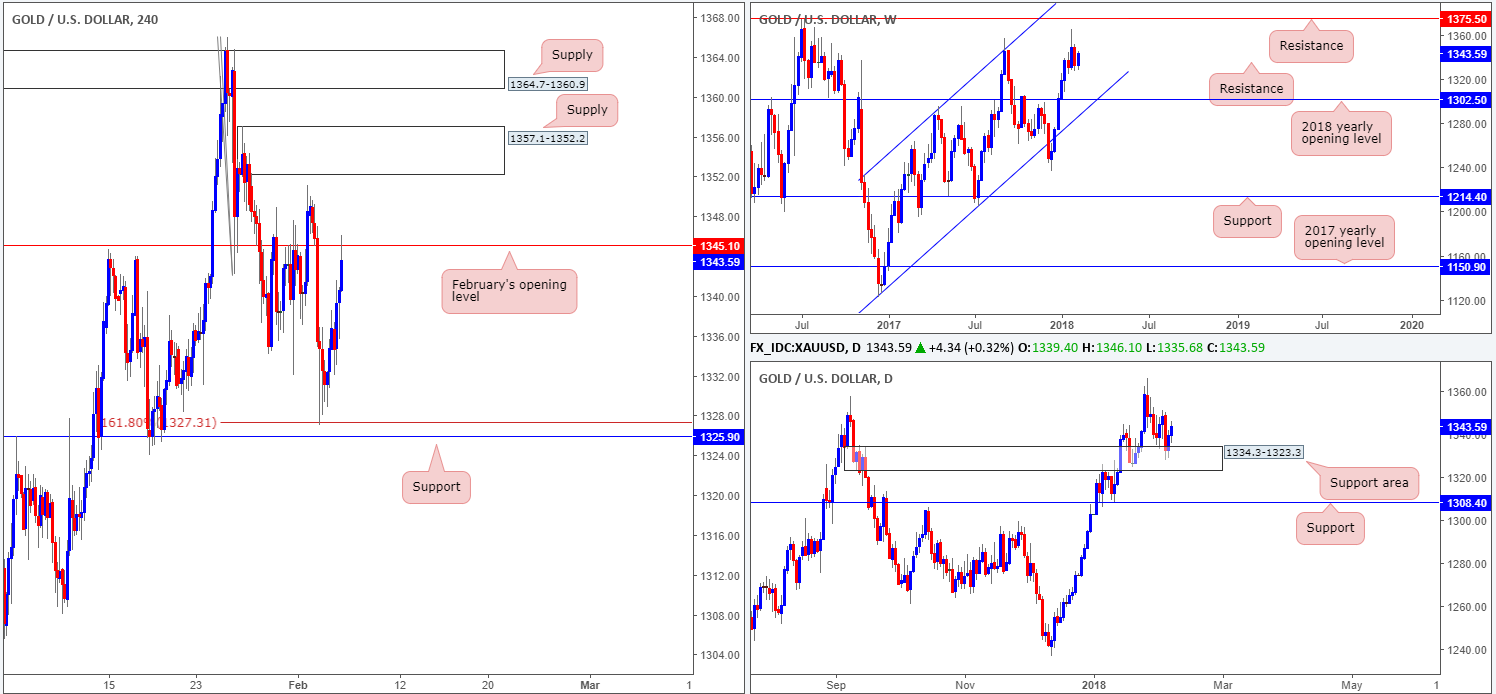
GOLD:
The yellow metal continues to shine bright as global stock markets plunge lower.
H4 price extended gains from the H4 161.8% Fib ext. point at 1327.3 and, in recent hours, shook hands with February’s opening level at 1345.1. Bolstering upside, from a technical perspective, is the daily support area coming in at 1334.3-1323.3.
A violation of 1345.1 today could see the metal approach H4 supply at 1357.1-1352.2, which happens to be shadowed by another layer of H4 supply at 1364.7-1360.9.
Potential trading zones:
Despite gold’s attraction at the moment, buying into H4 structure is not a route we’d recommend.
In regard to selling – yes we have H4 structure – but is it enough to withstand buying pressure from the daily support area?
In our humble opinion, neither a long nor short seems attractive at this time.
Areas worthy of attention:
Supports: 1327.3; 1325.9; 1334.3-1323.3.
Resistances: 1357.1-1352.2; 1364.7-1360.9; 1345.1.
This site has been designed for informational and educational purposes only and does not constitute an offer to sell nor a solicitation of an offer to buy any products which may be referenced upon the site. The services and information provided through this site are for personal, non-commercial, educational use and display. IC Markets does not provide personal trading advice through this site and does not represent that the products or services discussed are suitable for any trader. Traders are advised not to rely on any information contained in the site in the process of making a fully informed decision.
This site may include market analysis. All ideas, opinions, and/or forecasts, expressed or implied herein, information, charts or examples contained in the lessons, are for informational and educational purposes only and should not be construed as a recommendation to invest, trade, and/or speculate in the markets. Any trades, and/or speculations made in light of the ideas, opinions, and/or forecasts, expressed or implied herein, are committed at your own risk, financial or otherwise.
The use of the site is agreement that the site is for informational and educational purposes only and does not constitute advice in any form in the furtherance of any trade or trading decisions.
The accuracy, completeness and timeliness of the information contained on this site cannot be guaranteed. IC Markets does not warranty, guarantee or make any representations, or assume any liability with regard to financial results based on the use of the information in the site.
News, views, opinions, recommendations and other information obtained from sources outside of www.icmarkets.com.au, used in this site are believed to be reliable, but we cannot guarantee their accuracy or completeness. All such information is subject to change at any time without notice. IC Markets assumes no responsibility for the content of any linked site. The fact that such links may exist does not indicate approval or endorsement of any material contained on any linked site.
IC Markets is not liable for any harm caused by the transmission, through accessing the services or information on this site, of a computer virus, or other computer code or programming device that might be used to access, delete, damage, disable, disrupt or otherwise impede in any manner, the operation of the site or of any user’s software, hardware, data or property.


