
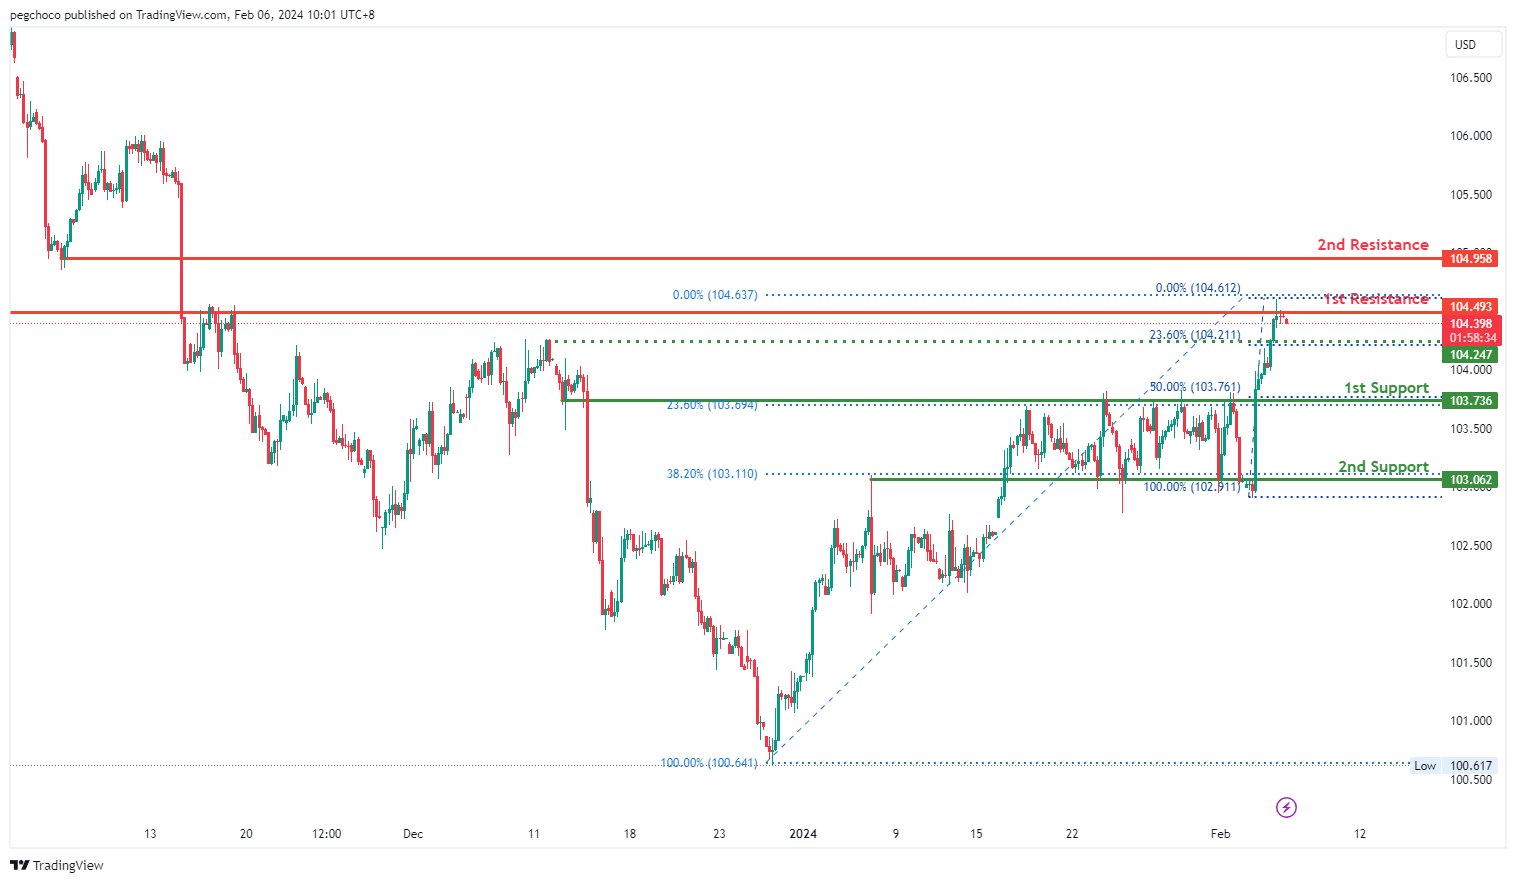
DXY:
The DXY chart currently exhibits a bearish overall momentum, indicating a downward trend. According to the analysis, the price could potentially experience a bearish reaction off the 1st resistance and drop towards the 1st support.
The 1st support level at 103.73 is identified as a pullback support, and it is reinforced by the presence of both the 50% and 23.60% Fibonacci Retracement levels. This indicates strong confluence at this level, making it a significant potential support zone.
There is also a 2nd support level at 103.06, characterized as another pullback support and associated with the 23.60% Fibonacci Retracement. This further emphasizes its importance as a potential support area.
On the resistance side, the 1st resistance level at 104.49 is categorized as an overlap resistance, indicating that it represents a historical point where the price has encountered resistance.
Additionally, there is a 2nd resistance level at 104.95, identified as a pullback resistance.
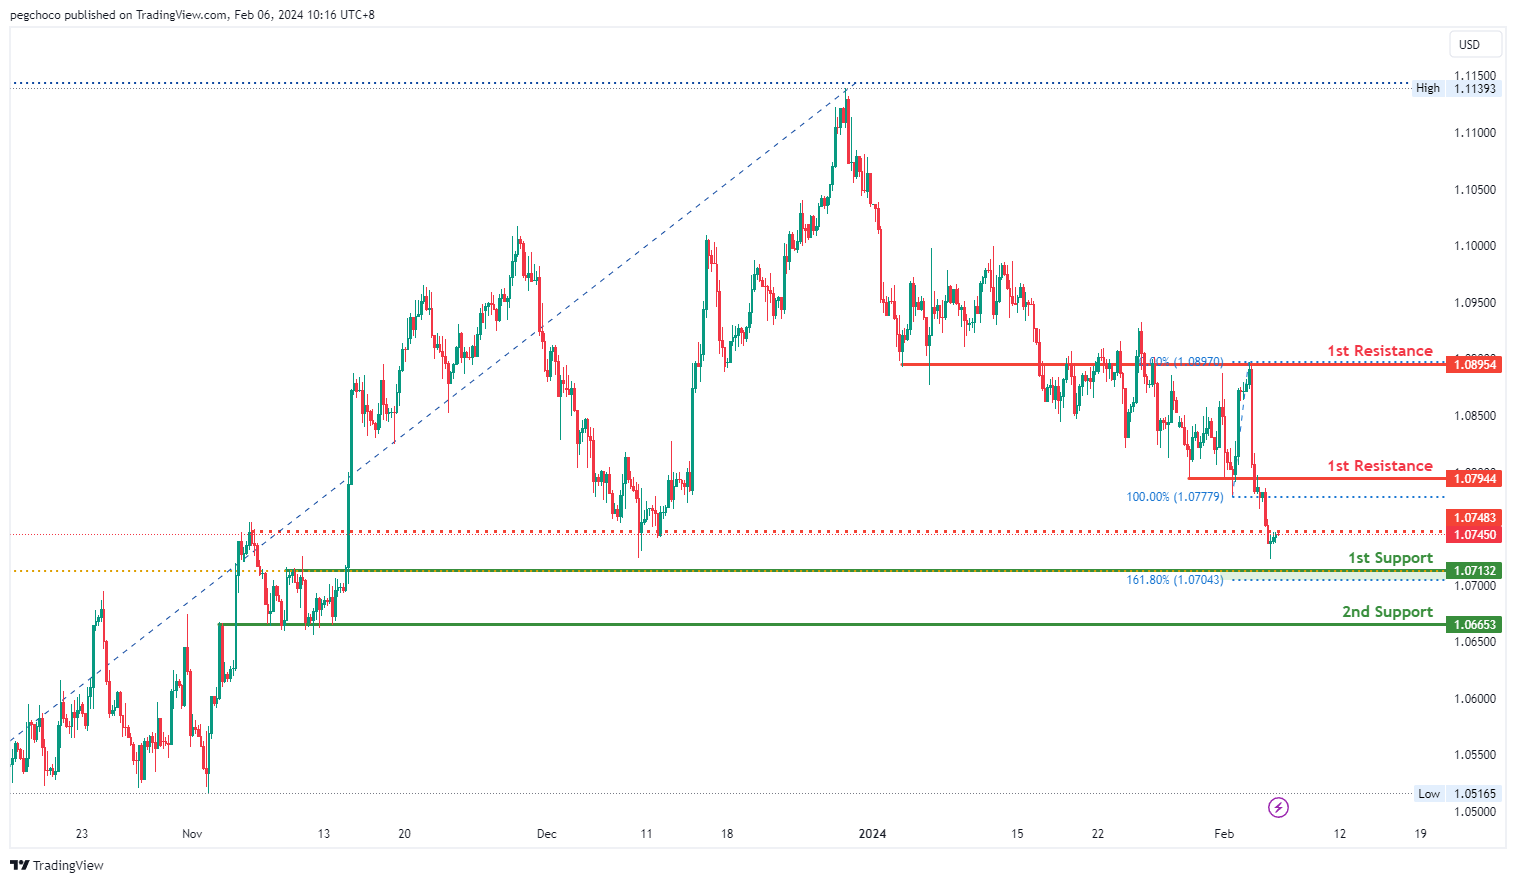
EUR/USD:
The EUR/USD chart currently exhibits a bearish overall momentum, indicating a downward trend. According to the analysis, the price could potentially rise towards the 1st resistance in the short term before reversing off it and dropping towards the 1st support.
The 1st support level at 1.0713 is characterized as a pullback support and is reinforced by the presence of the 161.80% Fibonacci Extension. This suggests that it has historical significance and could potentially act as a strong support level where buying interest may emerge.
There is also a 2nd support level at 1.0665, identified as an overlap support, which adds to its importance as a potential support zone.
On the resistance side, the 1st resistance level at 1.0794 is categorized as an overlap resistance, indicating that it represents a historical point where the price has encountered resistance in the past.
Additionally, there is a 2nd resistance level at 1.0895, identified as another overlap resistance.
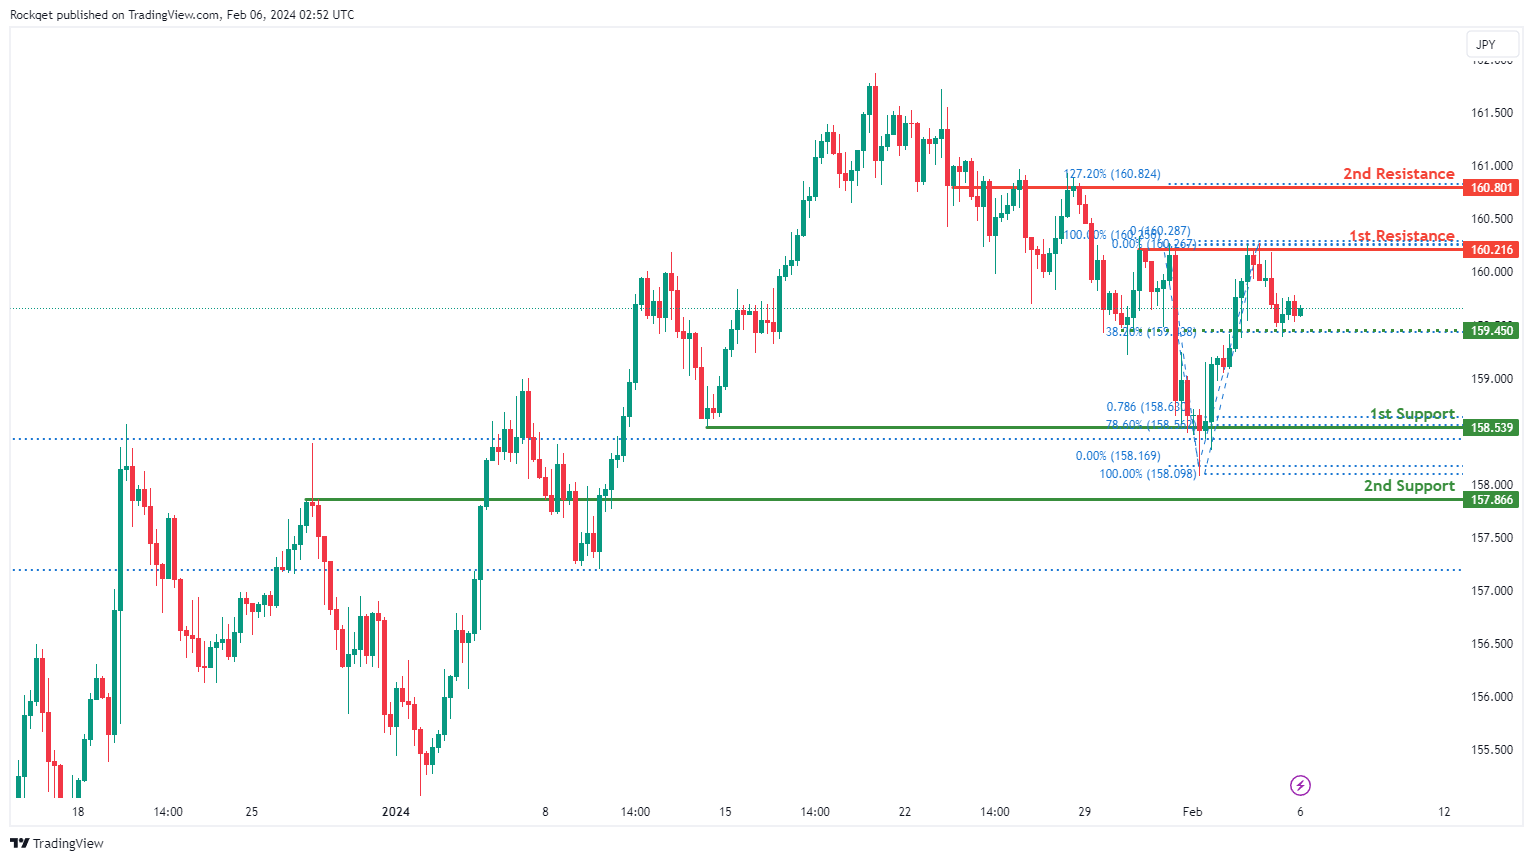
EUR/JPY:
The EUR/JPY chart currently exhibits a bearish overall momentum, indicating a prevailing downward trend. Several factors contribute to this bearish sentiment, supporting the potential for continued downward movement in the price.
The 1st support at 158.539 is considered favorable for various reasons. It is identified as a pullback support and aligns with the 78.60% Fibonacci Retracement and the 78.60% Fibonacci Projection, suggesting a historical level where buying interest has previously emerged.
The 2nd support at 157.866 is recognized as an overlap support, providing additional strength to the potential support zone.
An intermediate support level at 159.45 is identified, aligning with a pullback support and the 38.20% Fibonacci Retracement.
On the resistance side, the 1st resistance at 160.216 is highlighted as a level where selling pressure may emerge, representing a pullback resistance.
The 2nd resistance at 160.801 is also recognized, coinciding with an overlap resistance and the 127.20% Fibonacci Extension, adding further significance to this resistance level.
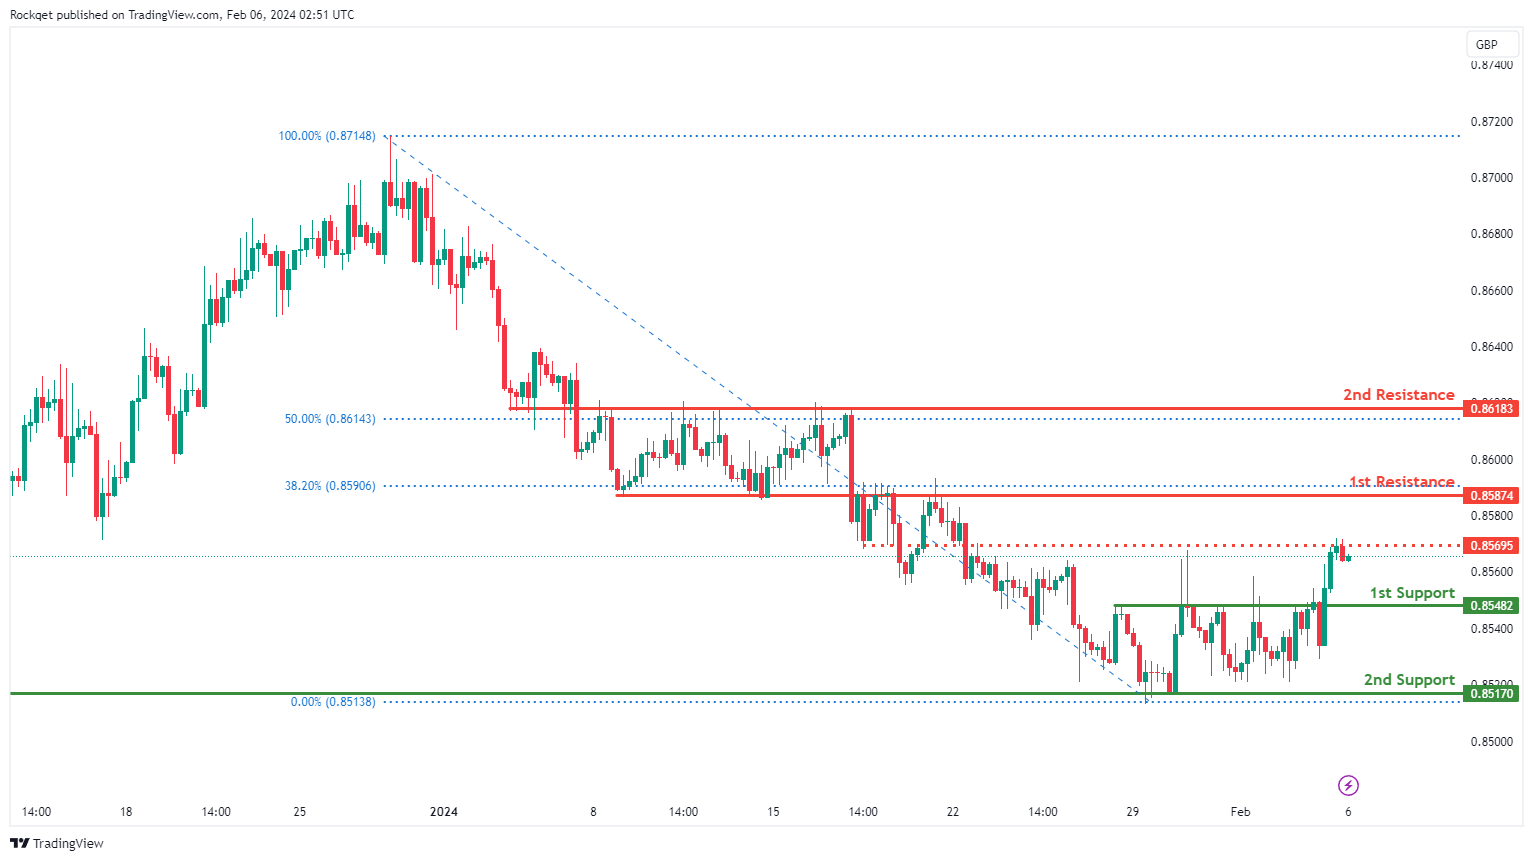
EUR/GBP:
The EUR/GBP chart currently exhibits a bearish overall momentum, indicating a prevailing downward trend. Several factors contribute to this bearish sentiment, supporting the potential for continued downward movement in the price.
The 1st support at 0.85482 is considered favorable for various reasons. It is identified as a pullback support, suggesting a historical level where buying interest has previously emerged.
The 2nd support at 0.85170 is recognized as multi-swing low support, adding additional significance to the potential support zone.
On the resistance side, the 1st resistance at 0.85874 is highlighted as a level where selling pressure may emerge, representing an overlap resistance and coinciding with the 38.20% Fibonacci Retracement.
The 2nd resistance at 0.86183 is also recognized, aligning with an overlap resistance and the 50% Fibonacci Retracement, providing further strength to this resistance level. An intermediate resistance level at 0.85695 is identified, representing an overlap resistance.
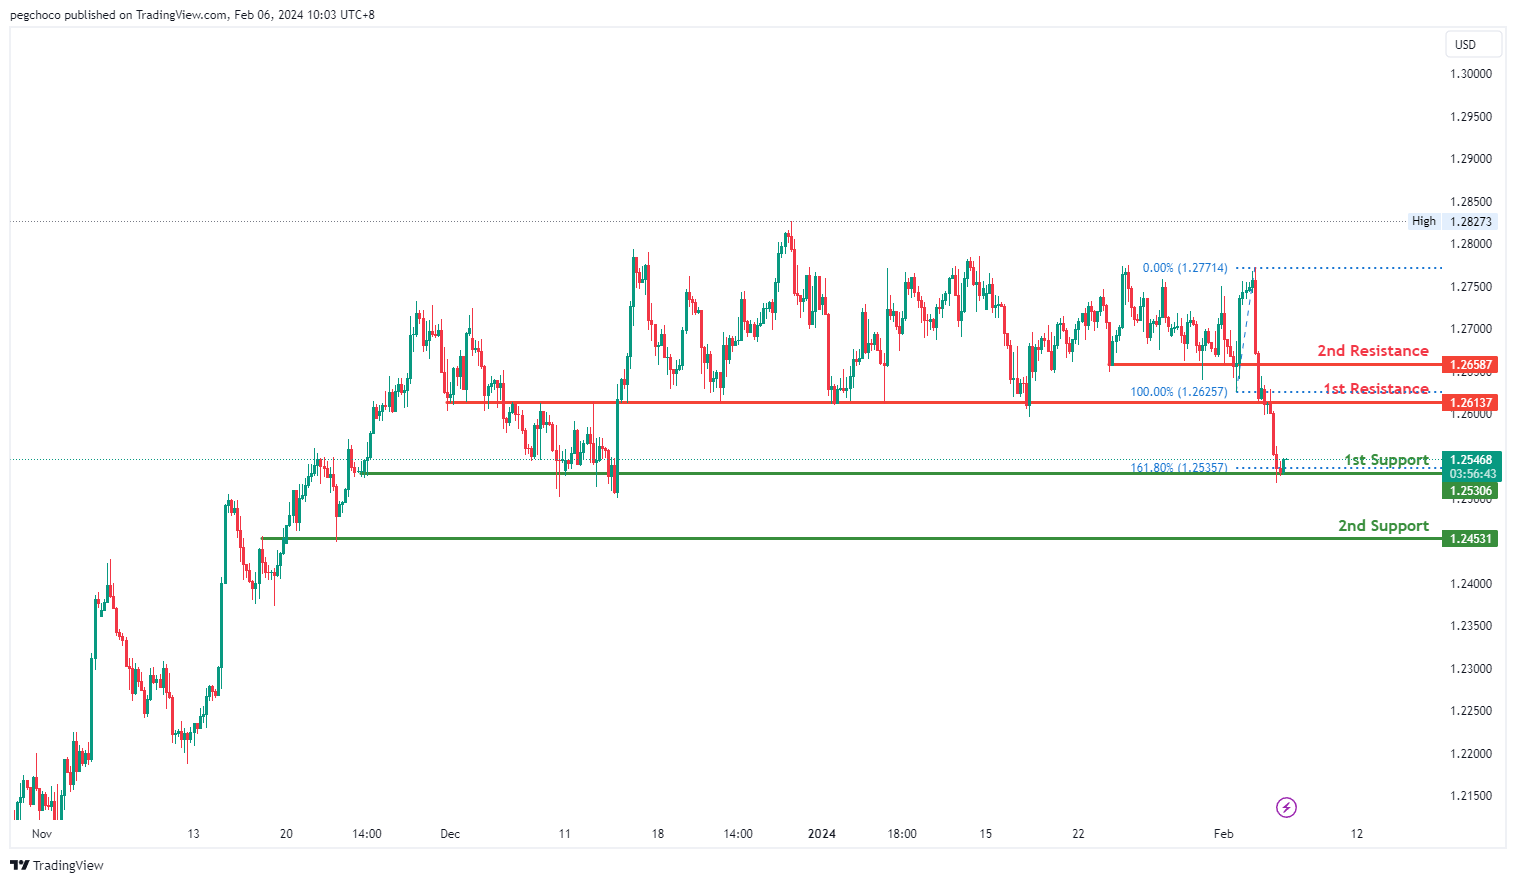
GBP/USD:
The GBP/USD chart currently exhibits a bearish overall momentum, indicating a downward trend. According to the analysis, the price could potentially rise towards the 1st resistance in the short term before reversing off it and dropping towards the 1st support.
The 1st support level at 1.2530 is identified as a multi-swing low support and is reinforced by the presence of the 161.80% Fibonacci Extension. This suggests that it has historical significance and could potentially act as a strong support level where buying interest may emerge.
There is also a 2nd support level at 1.2453, characterized as an overlap support, which adds to its importance as a potential support zone.
On the resistance side, the 1st resistance level at 1.2613 is categorized as a pullback resistance, indicating that it represents a point where the price has encountered resistance in the past.
Additionally, there is a 2nd resistance level at 1.2658, identified as another pullback resistance.
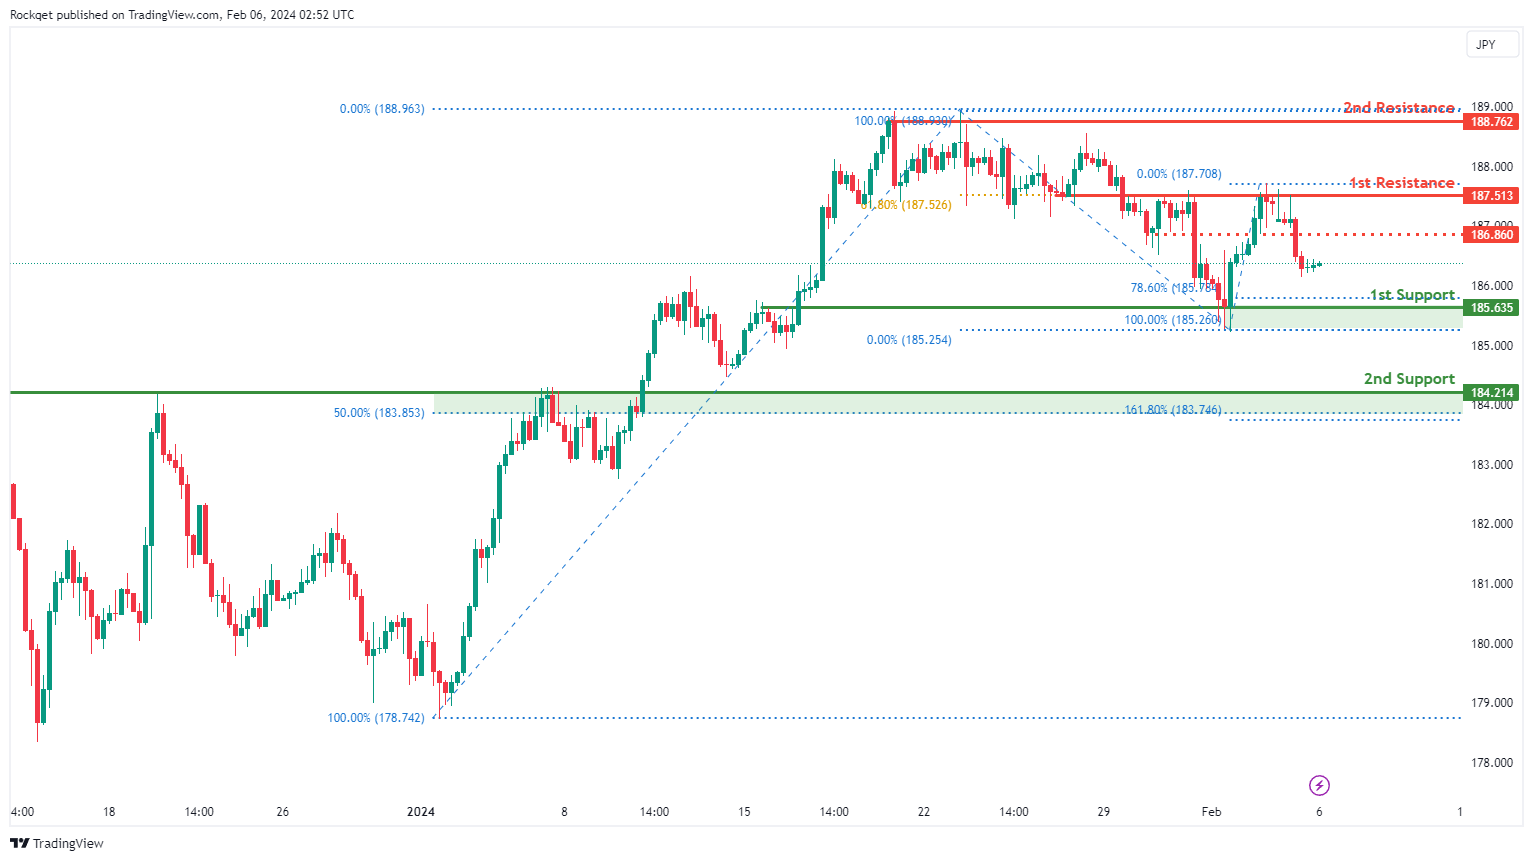
GBP/JPY:
The GBP/JPY chart currently demonstrates a bearish overall momentum, indicating a prevailing downward trend. Several factors contribute to this bearish sentiment, supporting the potential for continued downward movement in the price.
The 1st support at 185.635 is considered favorable for various reasons. It is identified as an overlap support and coincides with the 78.60% Fibonacci Retracement, suggesting a historical level where buying interest has previously emerged.
The 2nd support at 184.214 is also recognized as an overlap support, aligning with the 50% Fibonacci Retracement and the 161.80% Fibonacci Extension, providing additional strength to the potential support zone.
On the resistance side, the 1st resistance at 187.513 is highlighted as a level where selling pressure may emerge. It represents an overlap resistance and coincides with the 61.80% Fibonacci Retracement.
The 2nd resistance at 188.762 is also recognized, representing a swing high resistance.An intermediate resistance level at 186.86 is identified, aligning with an overlap resistance.
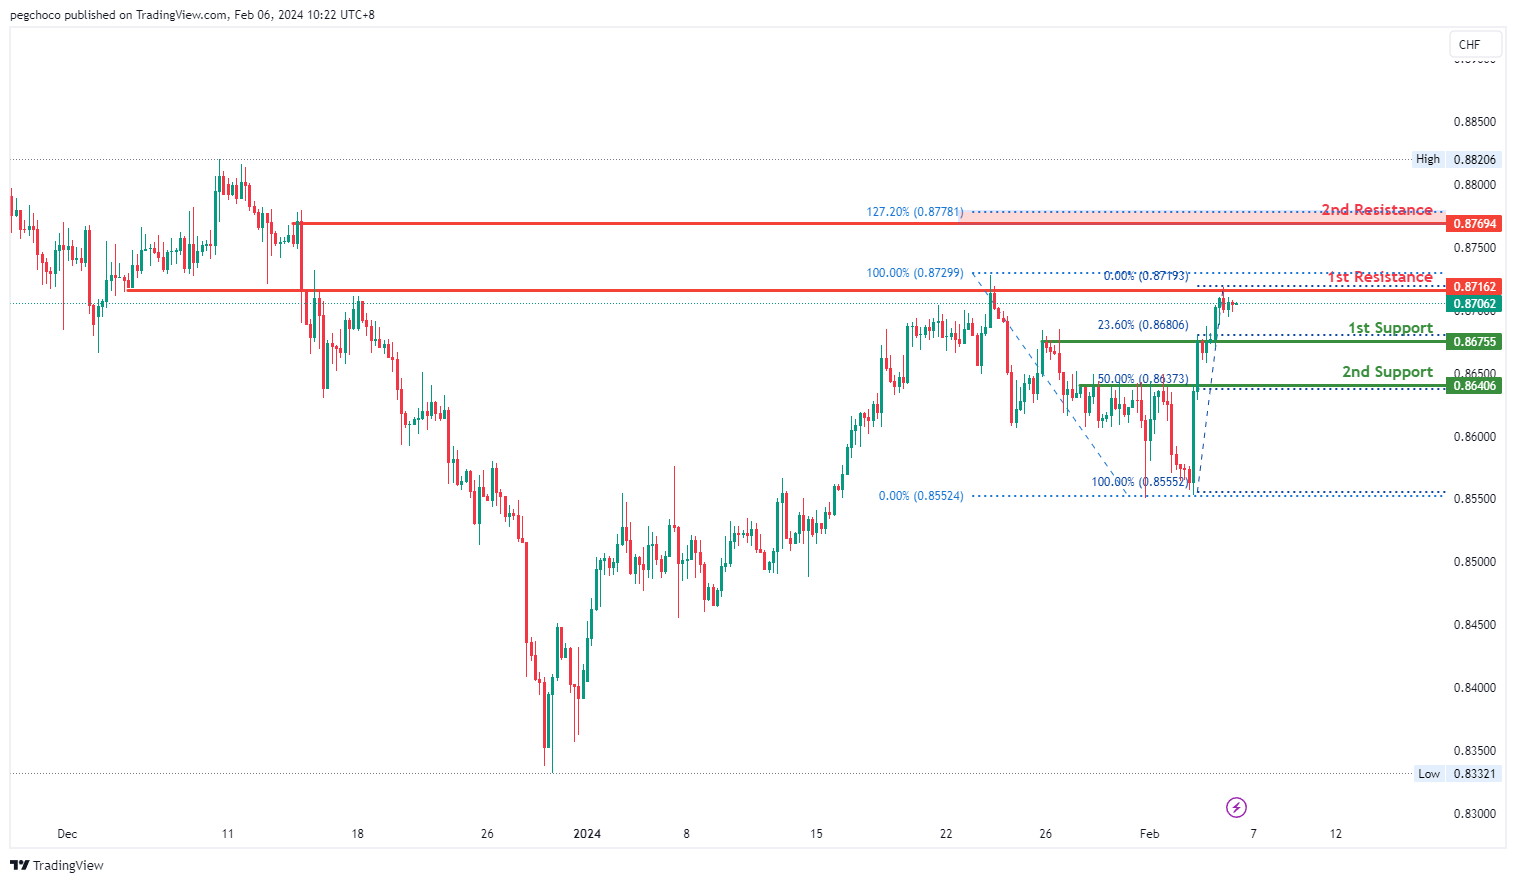
USD/CHF:
The USD/CHF chart currently exhibits a bullish overall momentum, indicating an upward trend. According to the analysis, the price could potentially drop further to the 1st support in the short term before bouncing from there and rising to the 1st resistance.
The 1st support level at 0.8675 is identified as a pullback support and is reinforced by the presence of the 23.60% Fibonacci Retracement. This suggests that it has historical significance and could potentially act as a strong support level where buying interest may emerge.
There is also a 2nd support level at 0.8640, characterized as another pullback support with the 50% Fibonacci Retracement, further emphasizing its importance as a potential support zone.
On the resistance side, the 1st resistance level at 0.8716 is categorized as an overlap resistance, indicating that it represents a historical point where the price has encountered resistance in the past.
Additionally, there is a 2nd resistance level at 0.8769, identified as a swing high resistance with the presence of the 127.20% Fibonacci Extension.
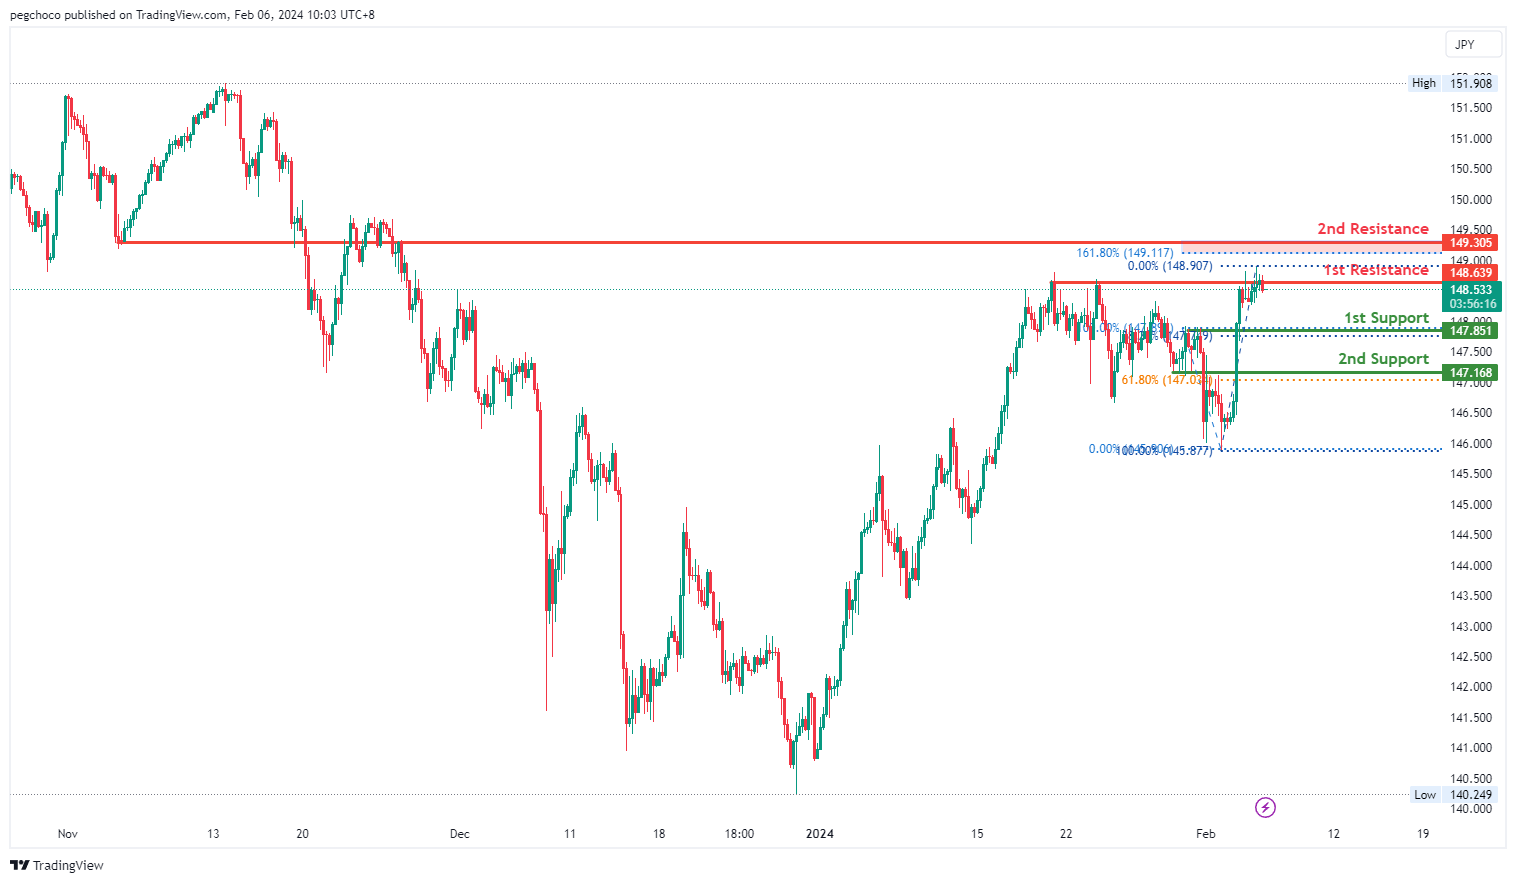
USD/JPY:
The USD/JPY chart currently exhibits a bearish overall momentum, indicating a downward trend. According to the analysis, the price could potentially experience a bearish reaction off the 1st resistance and drop to the 1st support.
The 1st support level at 147.85 is identified as a pullback support and is reinforced by the presence of the 38.20% Fibonacci Retracement. This suggests that it has historical significance and could potentially act as a strong support level where buying interest may emerge.
There is also a 2nd support level at 147.16, characterized as another pullback support with the 61.80% Fibonacci Retracement, further emphasizing its importance as a potential support zone.
On the resistance side, the 1st resistance level at 148.63 is categorized as a multi-swing high resistance, indicating that it represents a historical point where the price has encountered resistance in the past.
Additionally, there is a 2nd resistance level at 149.30, identified as an overlap resistance with the presence of the 161.80% Fibonacci Extension.
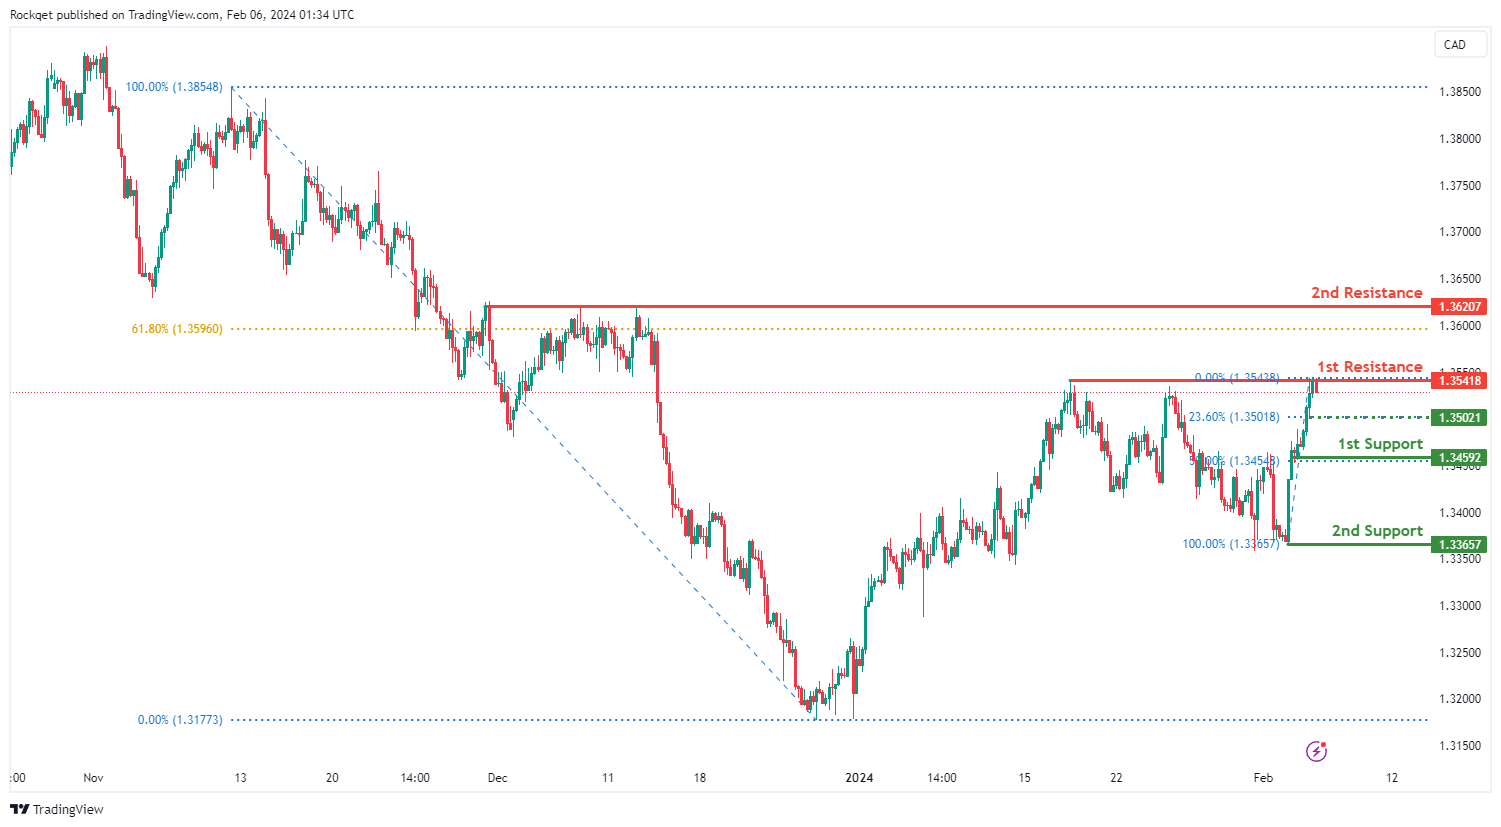
USD/CAD:
The USD/CAD chart currently exhibits an overall bullish momentum. However, there is a potential scenario for price to make a bearish reaction off the 1st resistance and drop towards the intermediate support.
The intermediate support level at 1.3502 is identified as a pullback support that aligns with the 23.60% Fibonacci Retracement level while the 1st support level at 1.3459 is also noted as a pullback support that aligns with the 50.00% Fibonacci Retracement level. Further below, the 2nd support level at 1.3365 is marked as a swing-low support, further emphasizing its importance as a potential support zone.
To the upside, the 1st resistance level at 1.3541 is identified as a pullback resistance. Higher up, the 2nd resistance level at 1.3620 is also noted as a pullback resistance that aligns close to the 61.80% Fibonacci Retracement level, further highlighting its importance as a potential resistance point.
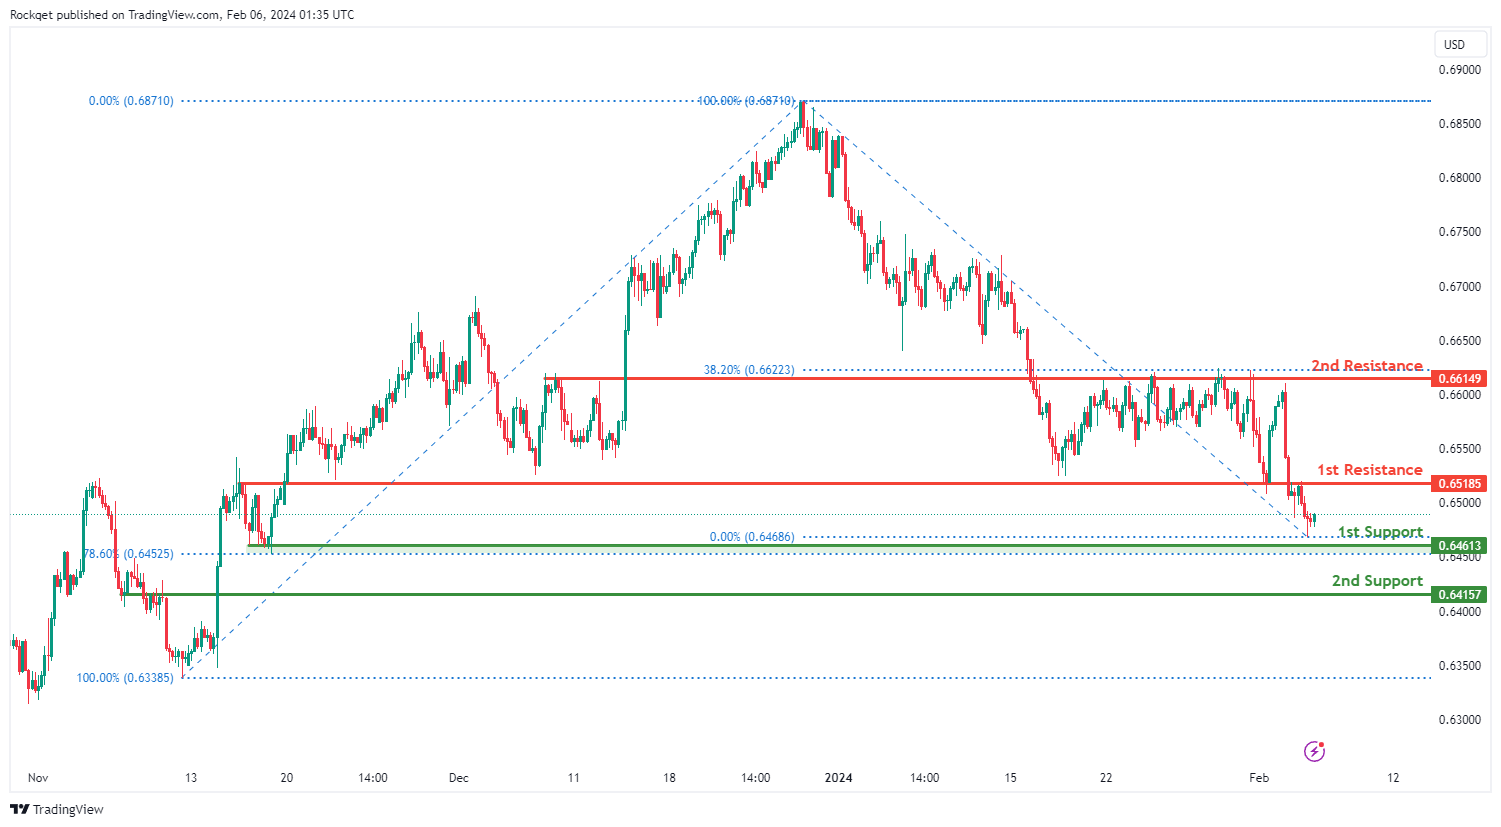
AUD/USD:
The AUD/USD chart currently exhibits an overall bearish momentum. In this context, there is a potential scenario for price to fall towards the 1st support.
The 1st support level at 0.6461 is identified as a pullback support that aligns close to the 78.60% Fibonacci Retracement level. Further below, the 2nd support level at 0.6415 is noted as an overlap support, further emphasizing its importance as a potential support zone.
To the upside, the 1st resistance level at 0.6518 is identified as an overlap resistance. Higher up, the 2nd resistance level at 0.6614 is marked as a pullback resistance that aligns close to the 38.20% Fibonacci Retracement level, further highlighting its importance as a potential resistance point.
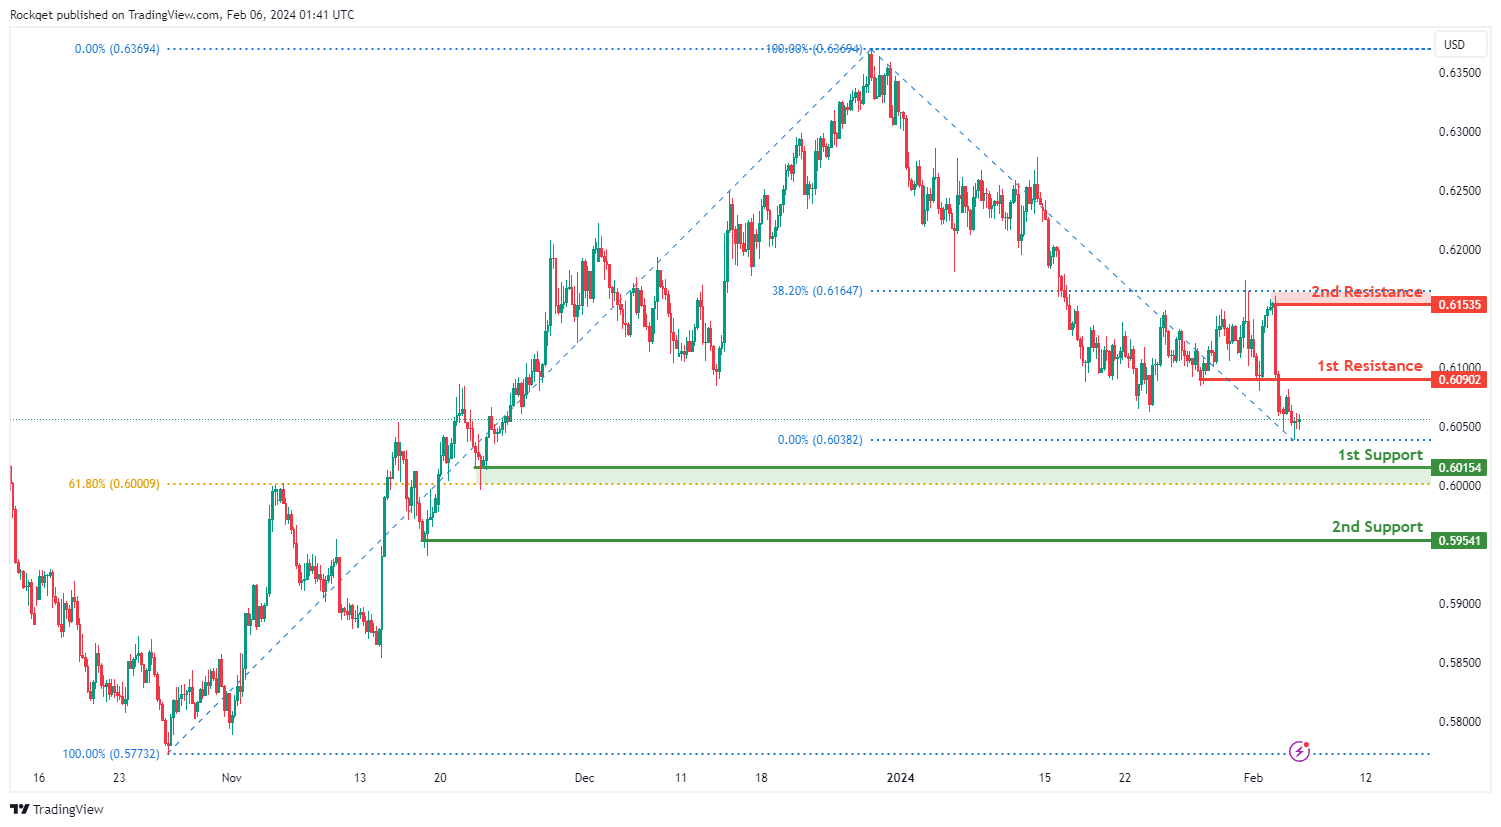
NZD/USD
The NZD/USD chart currently exhibits an overall bearish momentum. In this context, there is a potential scenario for price to fall towards the 1st support.
The 1st support level at 0.6015 is identified as a pullback support that aligns close to the 61.80% Fibonacci Retracement level. Further below, the 2nd support level at 0.5954 is also noted as a pullback support, further emphasizing its importance as a potential support zone.
To the upside, the 1st resistance level at 0.6090 is identified as a pullback resistance. Higher up, the 2nd resistance level at 0.6153 is also marked as a pullback resistance that aligns close to the 38.20% Fibonacci Retracement level, further highlighting its importance as a potential resistance point.
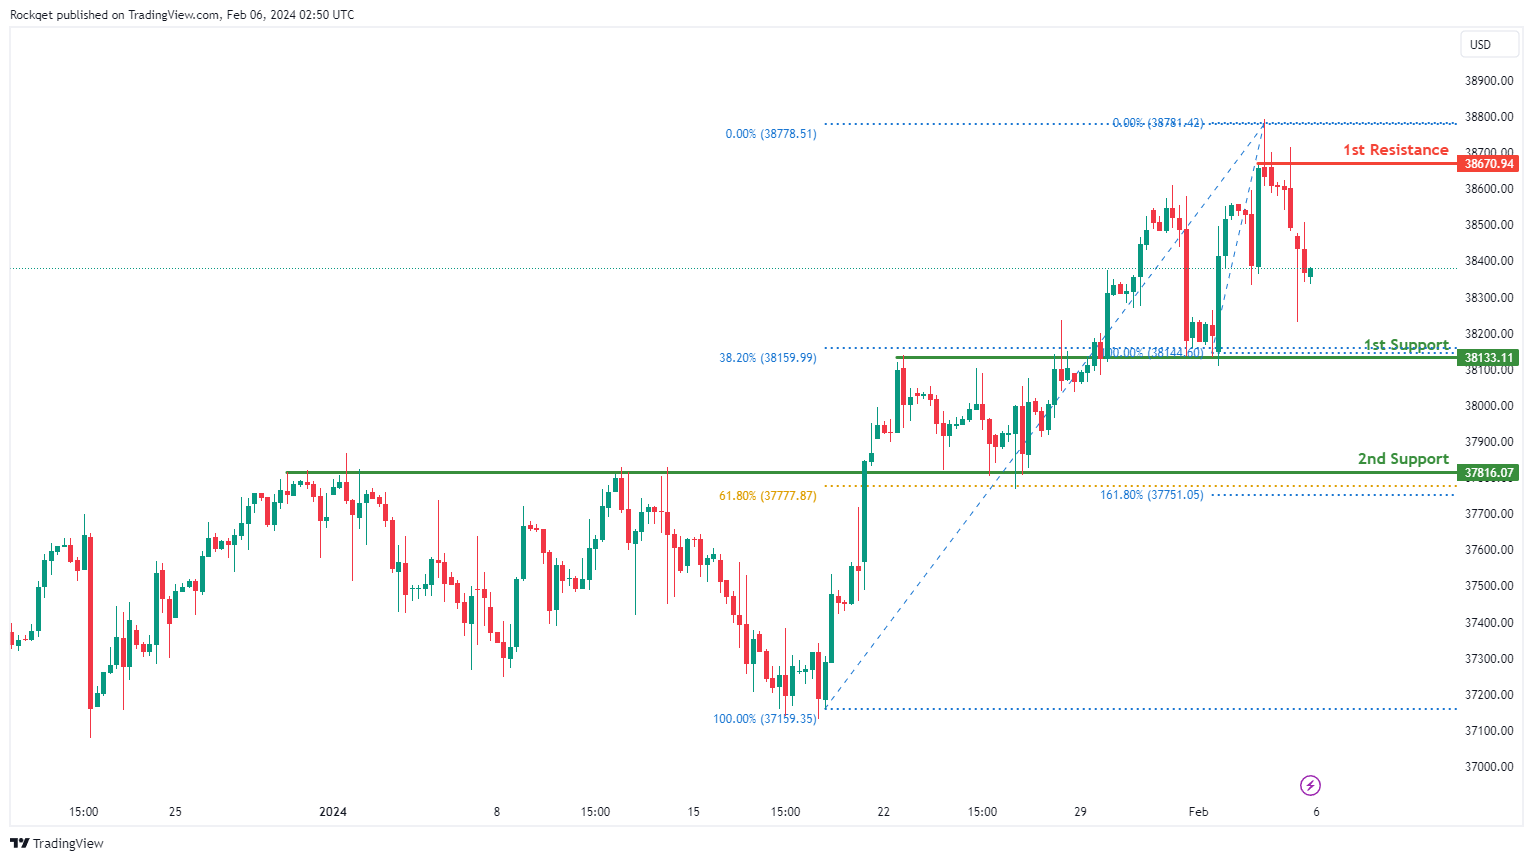
DJ30:
The DJ30 chart currently exhibits a bearish overall momentum, indicating a prevailing downward trend. Several factors contribute to this bearish sentiment, supporting the potential for continued downward movement in the price.
The 1st support at 38133.11 is considered favorable for various reasons. It is identified as an overlap support and aligns with the 38.20% Fibonacci Retracement, suggesting a historical level where buying interest has previously emerged.
The 2nd support at 37816.07 is also recognized as an overlap support, coinciding with the 61.80% Fibonacci Retracement and the 161.80% Fibonacci Extension, providing additional strength to the potential support zone.
On the resistance side, the 1st resistance at 38670.94 is highlighted as a level where selling pressure may emerge. It represents a swing high resistance.
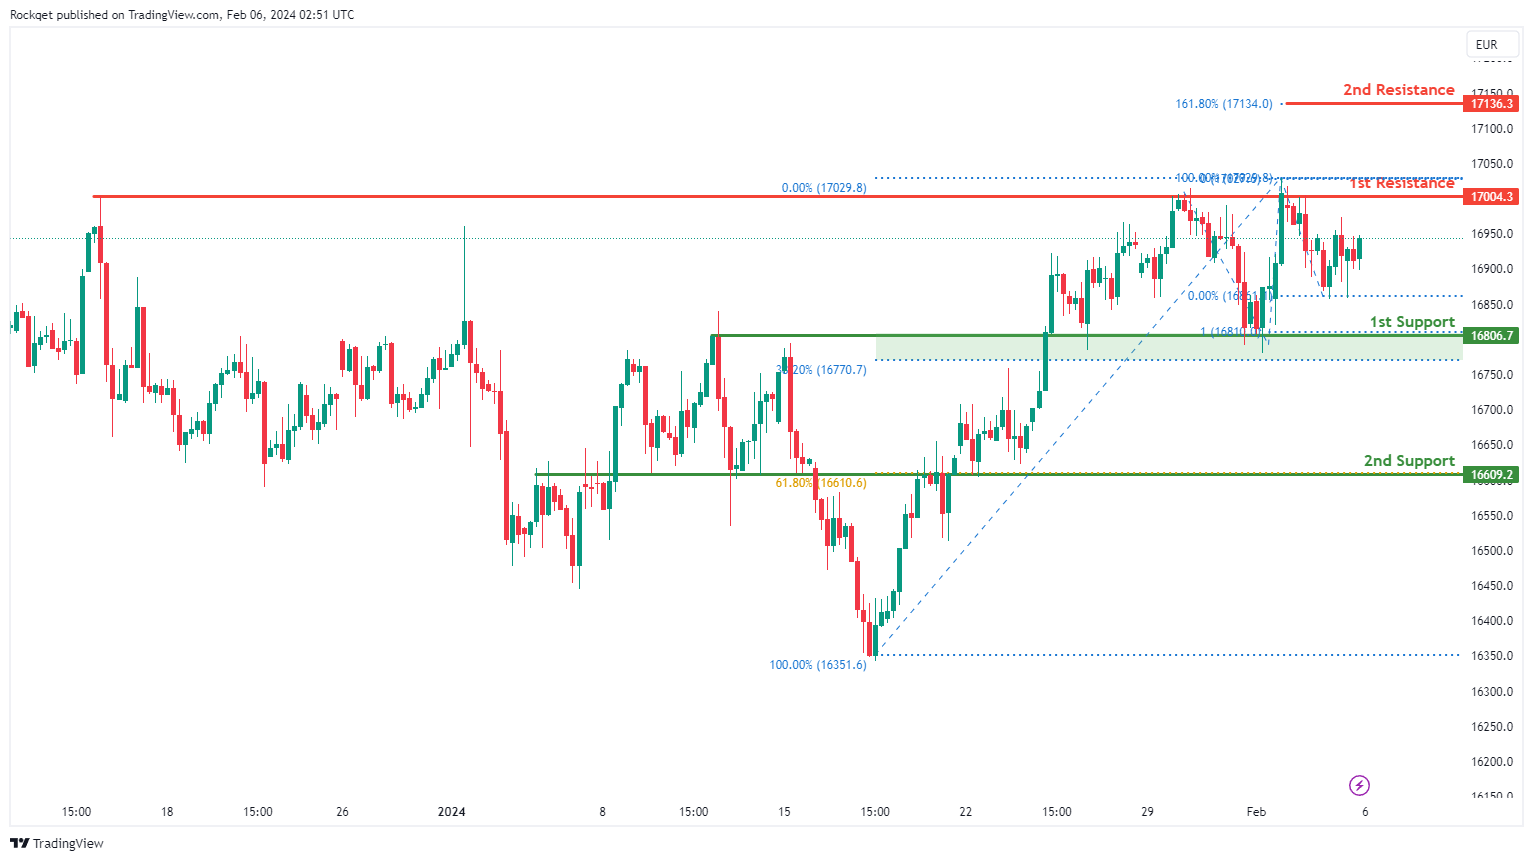
GER40:
The GER40 chart currently demonstrates a neutral overall momentum, indicating a lack of a clear trend. Several factors contribute to this neutral sentiment, suggesting potential price fluctuations between the 1st resistance and 1st support levels.
The 1st support at 16806.7 is considered favorable for various reasons. It is identified as an overlap support and aligns with the 38.20% Fibonacci Retracement and the 100% Fibonacci Projection, indicating a historical level where buying interest has previously emerged.
The 2nd support at 16609.2 is also recognized as an overlap support and coincides with the 61.80% Fibonacci Retracement, providing additional strength to the potential support zone.
On the resistance side, the 1st resistance at 17004.3 is highlighted as a level where selling pressure may emerge. It represents multi-swing high resistance.
The 2nd resistance at 17136.3 is also recognized, coinciding with the 161.80% Fibonacci Extension, adding further significance to this resistance level.
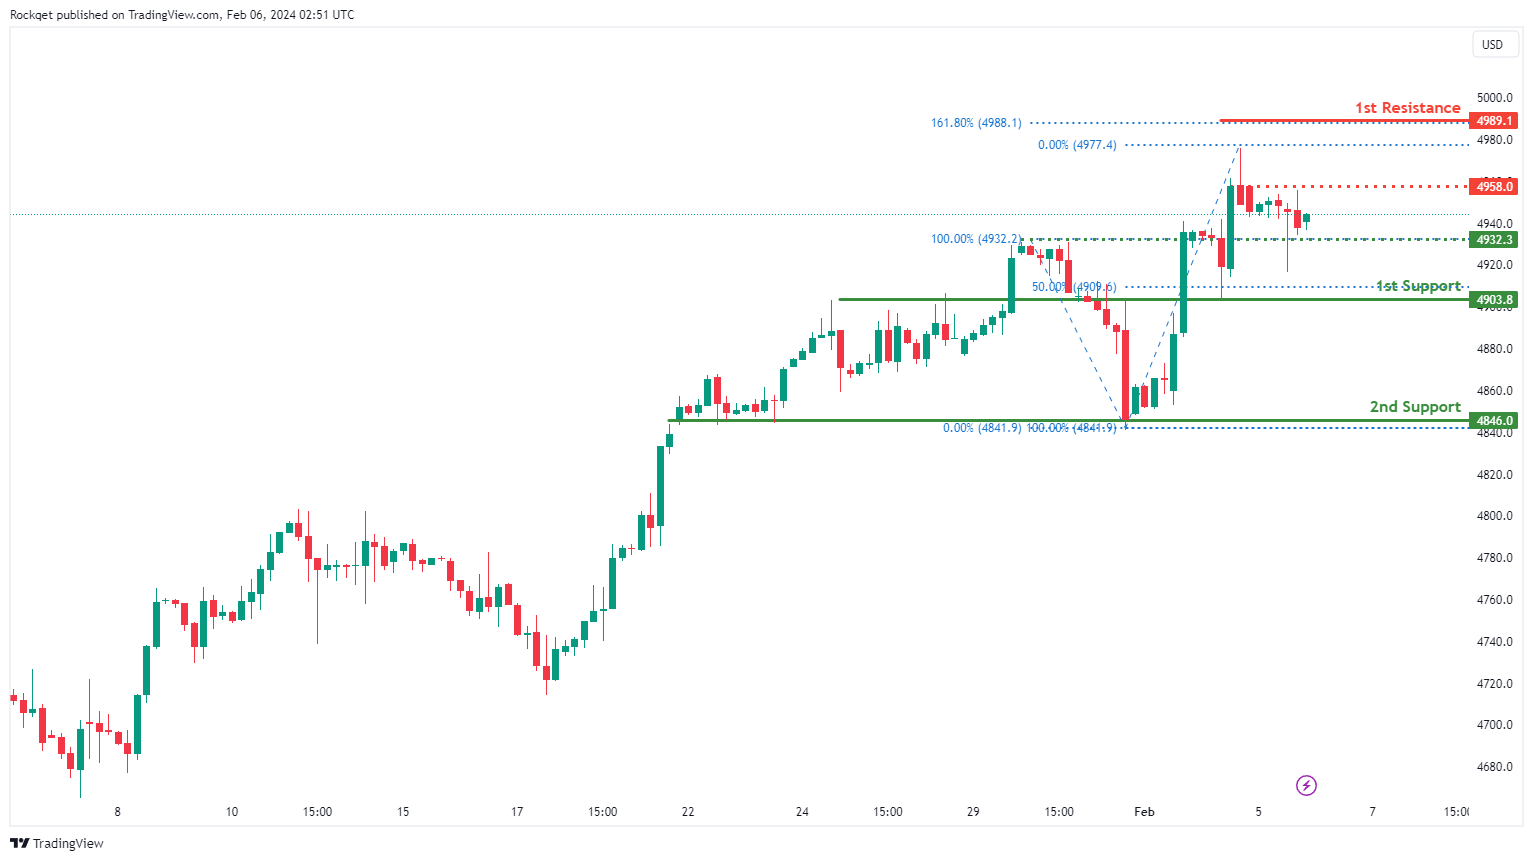
US500:
The US500 chart currently exhibits a neutral overall momentum, suggesting a lack of a clear trend. Several factors contribute to this neutral sentiment, indicating the potential for price fluctuations between the 1st resistance and 1st support levels.
The 1st support at 4903.8 is considered favorable for various reasons. It is identified as an overlap support and aligns with the 50% Fibonacci Retracement, indicating a historical level where buying interest has previously emerged.
The 2nd support at 4846.0 is also recognized as an overlap support, providing additional strength to the potential support zone. An intermediate support level at 4932.3 is identified, further contributing to the potential support area.
On the resistance side, the intermediate resistance at 4958.0 is noted, aligning with swing high resistance. The 1st resistance at 4989.1 is emphasized as it aligns with the 161.80% Fibonacci Extension, suggesting a potential barrier to the price.
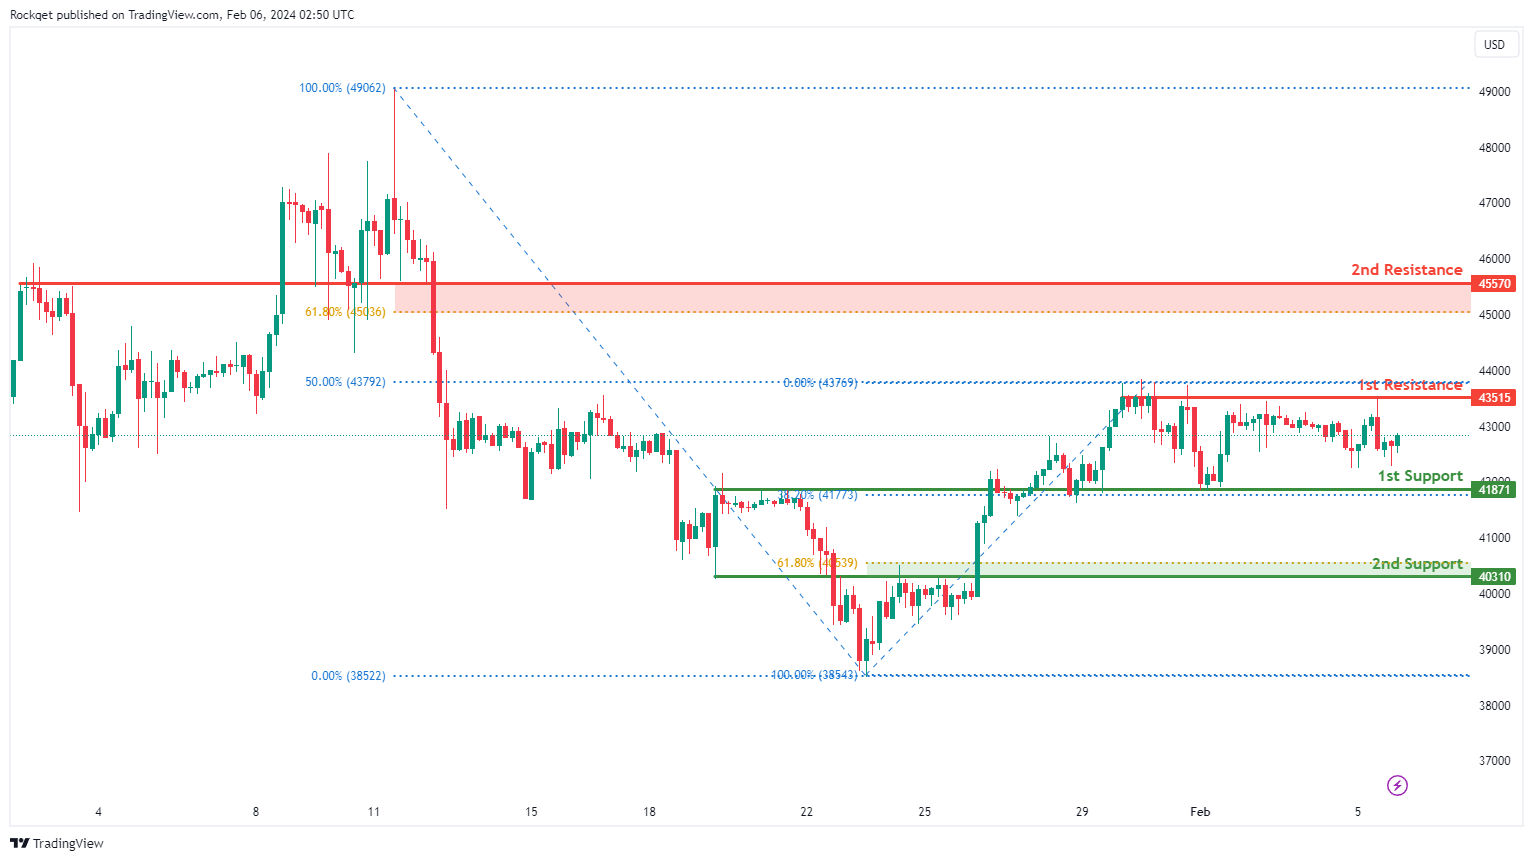
BTC/USD:
The BTC/USD chart currently demonstrates a neutral overall momentum, indicating a lack of a clear trend. Several factors contribute to this neutral sentiment, suggesting the potential for price fluctuations between the 1st resistance and 1st support levels.
The 1st support at 41871 is considered favorable for various reasons. It is identified as an overlap support and aligns with the 38.20% Fibonacci Retracement, indicating a historical level where buying interest has previously emerged.
The 2nd support at 40310 is also recognized as an overlap support and coincides with the 61.80% Fibonacci Retracement, providing additional strength to the potential support zone.
On the resistance side, the 1st resistance at 43515 is emphasized, aligning with pullback resistance and the 50% Fibonacci Retracement.
The 2nd resistance at 45570 is also recognized, coinciding with an overlap resistance and the 61.80% Fibonacci Retracement, adding further significance to this resistance level.
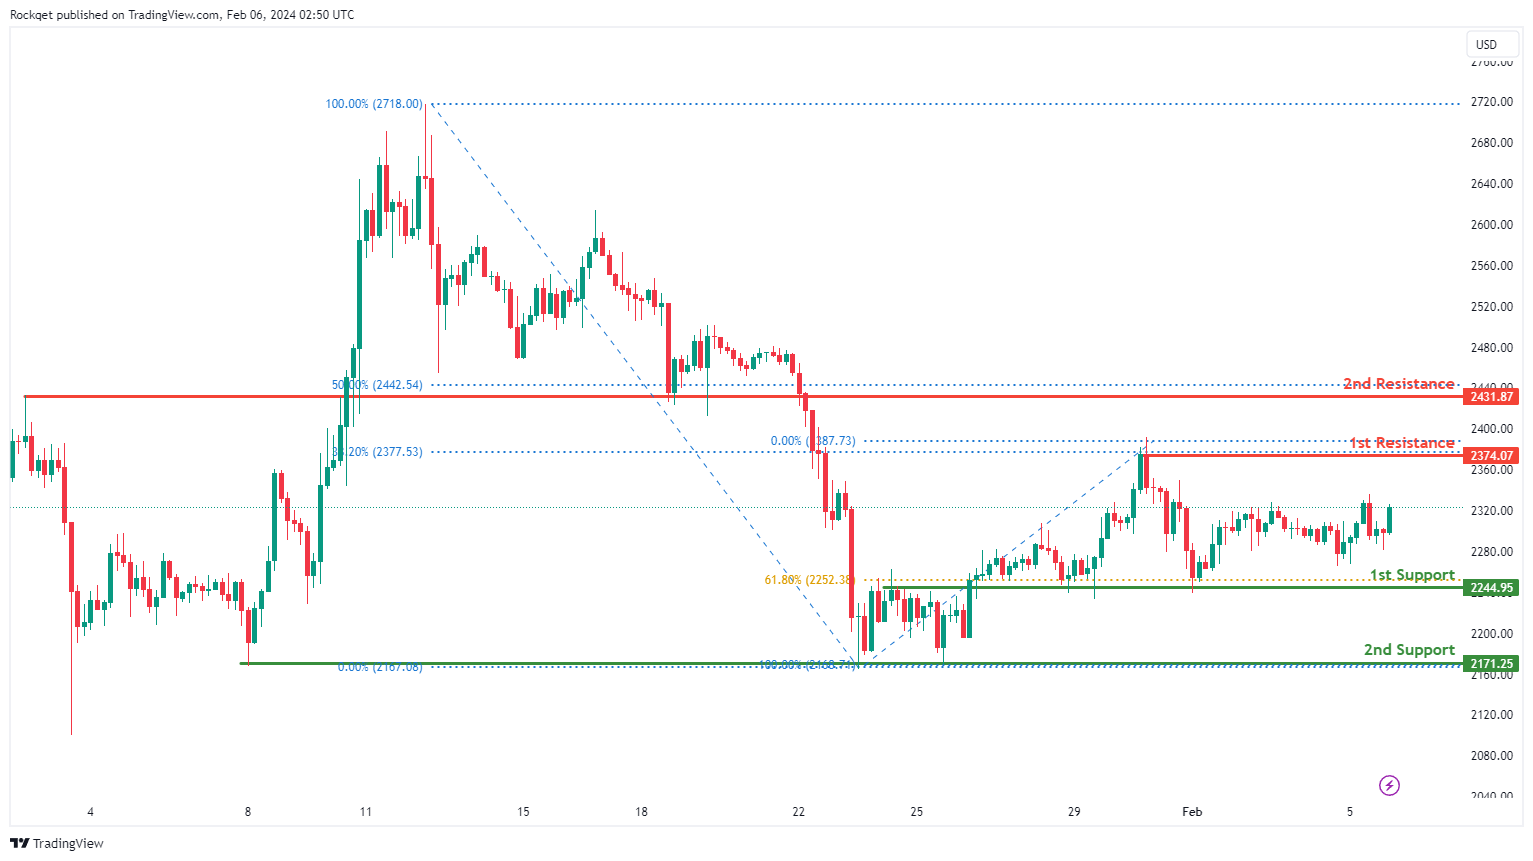
ETH/USD:
The ETH/USD chart currently reflects a neutral overall momentum, suggesting a lack of a clear trend. Several factors contribute to this neutral sentiment, indicating the potential for price fluctuations between the 1st resistance and 1st support levels.
The 1st support at 2244.95 is considered favorable for various reasons. It is identified as an overlap support and coincides with the 61.80% Fibonacci Retracement, highlighting a historical level where buying interest has previously emerged.
The 2nd support at 2171.25 is recognized as a pullback support, providing additional strength to the potential support zone.
On the resistance side, the 1st resistance at 2374.07 is emphasized, aligning with swing high resistance and the 38.20% Fibonacci Retracement.
The 2nd resistance at 2431.87 is also recognized, coinciding with an overlap resistance and the 50% Fibonacci Retracement, adding further significance to this resistance level.
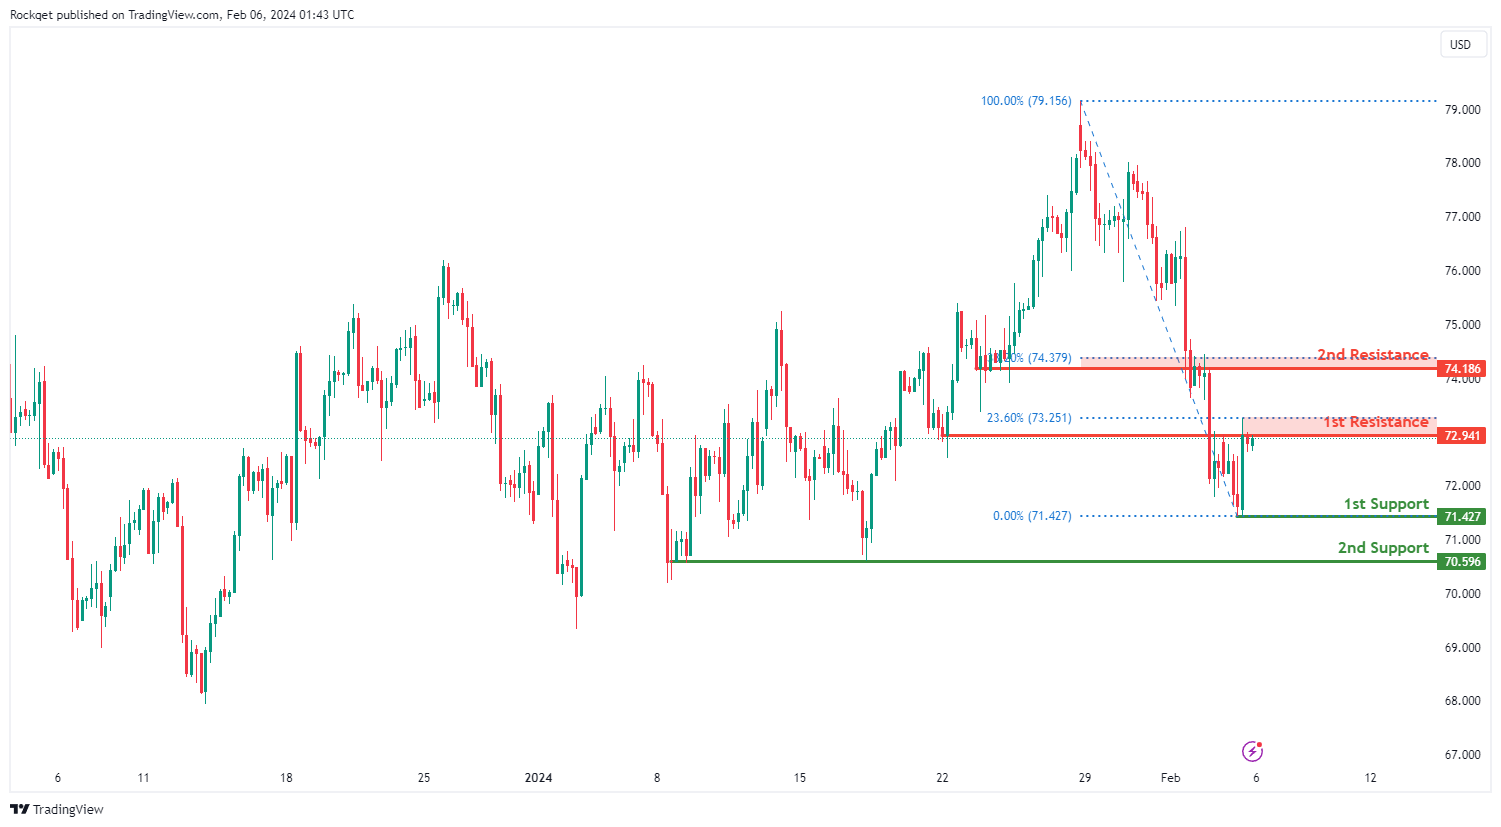
WTI/USD:
The WTI (West Texas Intermediate) chart currently exhibits an overall bearish momentum. However, there is a potential scenario for price to rise strongly towards the 1st resistance.
The 1st resistance level at 72.94 is identified as an overlap resistance that aligns close to the 23.60% Fibonacci Retracement level. Higher up, the 2nd resistance level at 74.18 is also marked as an overlap resistance that aligns close to the 38.20% Fibonacci Retracement level, further highlighting its importance as a potential resistance zone.
To the downside, the 1st support level at 71.42 is identified as a pullback support. Further below, the 2nd support level at 70.59 is noted as a multi-swing-low support, reinforcing its significance as a key support level.
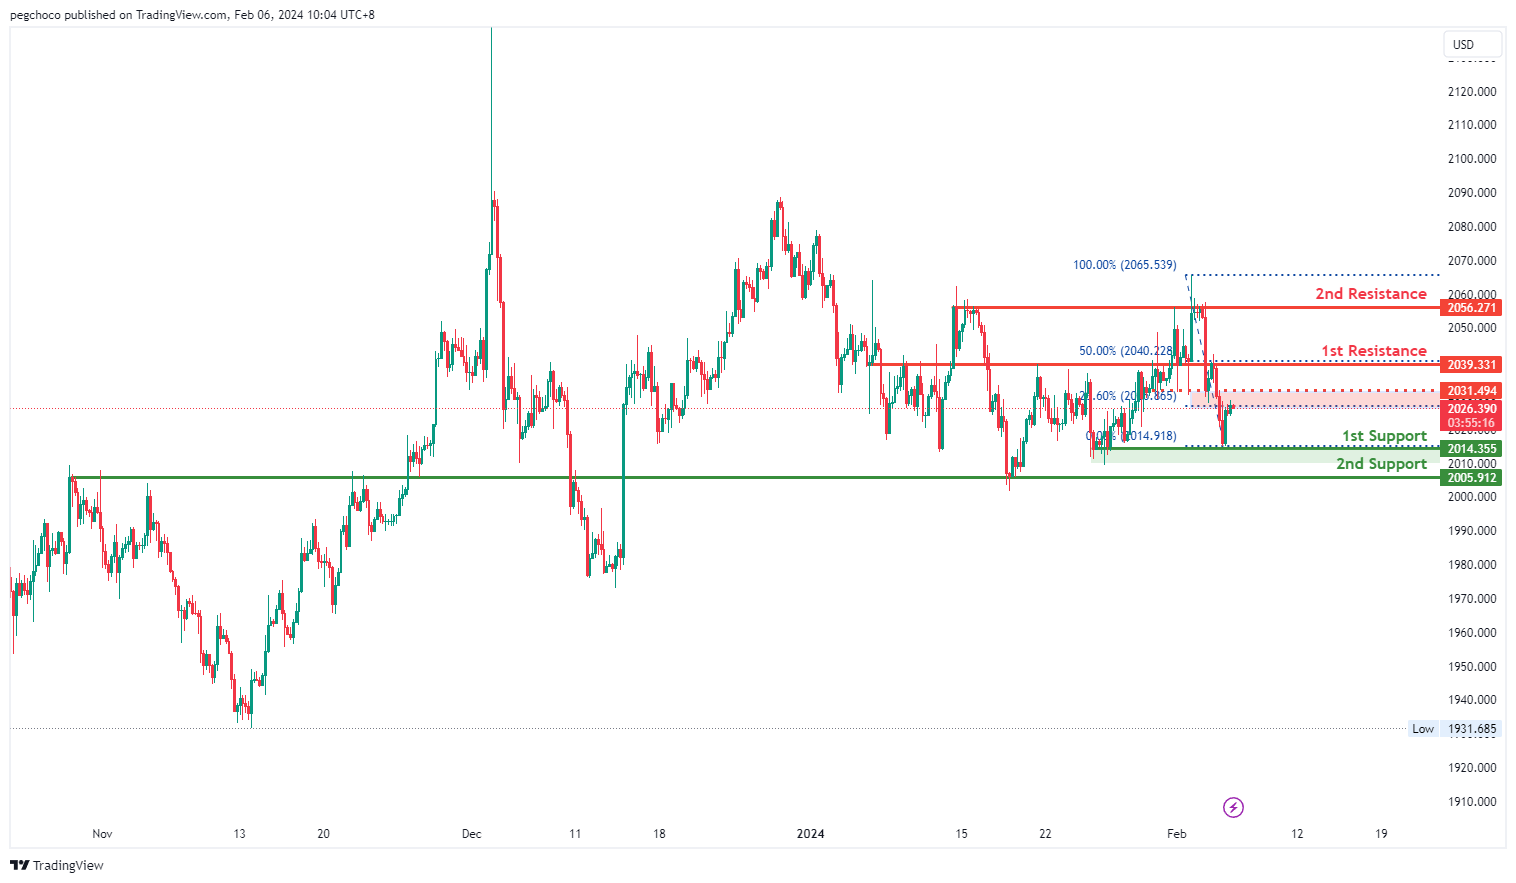
XAU/USD (GOLD):
The XAUUSD chart currently exhibits a bearish overall momentum, indicating a downward trend. The price could potentially make a rise towards the 1st resistance in the short term before reversing off it and dropping towards the 1st support.
1st support level at 2014.35 is identified as a multi-swing low support, suggesting historical significance as a strong support level where buying interest may emerge.
There is also a 2nd support level at 2005.91, characterized as an overlap support, further emphasizing its importance as a potential support zone.
On the resistance side, the 1st resistance level at 2039.33 is categorized as an overlap resistance with the presence of the 50% Fibonacci Retracement, indicating its historical significance as a point of potential resistance.
Additionally, there is a 2nd resistance level at 2056.27, identified as a multi-swing high resistance, which further adds to its significance as a potential barrier for further upside movement.
Intermediate resistance at 2031.49 is considered a pullback resistance with the presence of the 23.60% Fibonacci Retracement, which could act as a transitional level between support and resistance.
The accuracy, completeness and timeliness of the information contained on this site cannot be guaranteed. IC Markets does not warranty, guarantee or make any representations, or assume any liability regarding financial results based on the use of the information in the site.
News, views, opinions, recommendations and other information obtained from sources outside of www.icmarkets.com, used in this site are believed to be reliable, but we cannot guarantee their accuracy or completeness. All such information is subject to change at any time without notice. IC Markets assumes no responsibility for the content of any linked site.
The fact that such links may exist does not indicate approval or endorsement of any material contained on any linked site. IC Markets is not liable for any harm caused by the transmission, through accessing the services or information on this site, of a computer virus, or other computer code or programming device that might be used to access, delete, damage, disable, disrupt or otherwise impede in any manner, the operation of the site or of any user’s software, hardware, data or property.


