
Key risk events today:
US ISM Manufacturing PMI.
(Previous analysis as well as outside sources – italics).
EUR/USD:
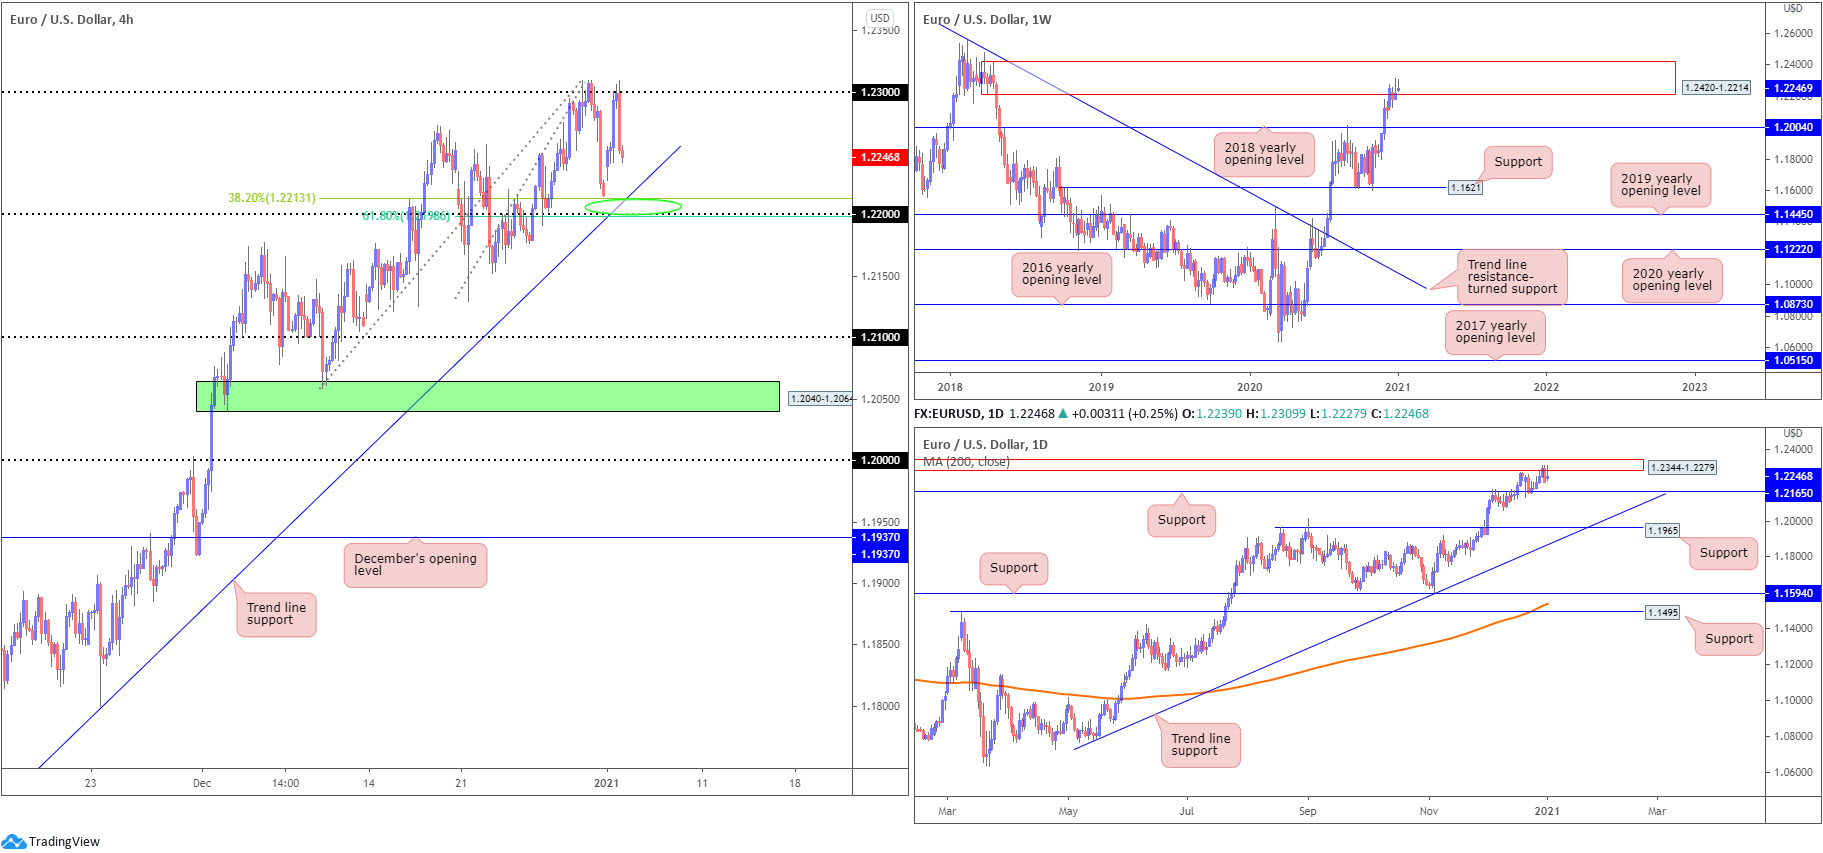
Europe’s single currency was on the ropes amid US hours Monday, as the US dollar index staged a decisive recovery off multi-month troughs at 89.42.
EUR/USD defended 1.23 on the H4, guiding candle action beneath 1.2250 and shining the spotlight on trend line support, taken from the low 1.1602. Also close by are the 38.2% and 61.8% Fibonacci retracement ratios at 1.2213 and 1.2198, respectively, as well as the 1.22 figure.
Meanwhile, on the weekly timeframe, buyers and sellers are seen battling for position within supply at 1.2420-1.2214, with last week establishing a shooting star pattern off multi-month peaks at 1.2310. Should sellers take the reins, the 2018 yearly opening value at 1.2004 is likely a level downside movement may target. In terms of trend, however, upside remains favoured (the pair has been trending higher since late March) – more so if price overthrows the 1.2555 February 12 high (2018).
Against the backdrop of weekly flow, daily supply can be seen at 1.2344-1.2279 (nestled within the walls of weekly supply mentioned above at 1.2420-1.2214). 1.2344-1.2279 was a key zone in the later stages of December, and remains a respected base in early January. Support at 1.2165 is in sight; a break lower exposes another layer of support at 1.1965 and a merging trend line support, extended from the low 1.0774.
Areas of consideration:
Technical outlook unchanged.
- 22 based on the H4 timeframe brings together H4 Fibonacci support and trend line support. This confluence could tempt a rebound from 1.22 (in line with the current uptrend – seen clearly on the weekly and daily timeframes). The 1.23 figure represents a reasonably obvious (initial) upside target.
- A H4 close beneath 1.22, on the other hand, signals a possible bearish scenario, bolstered on the back of weekly supply at 2420-1.2214 and daily supply drawn from 1.2344-1.2279. Downside targets rest at daily support from 1.2165, followed by the 1.21 figure on the H4.
GBP/USD:
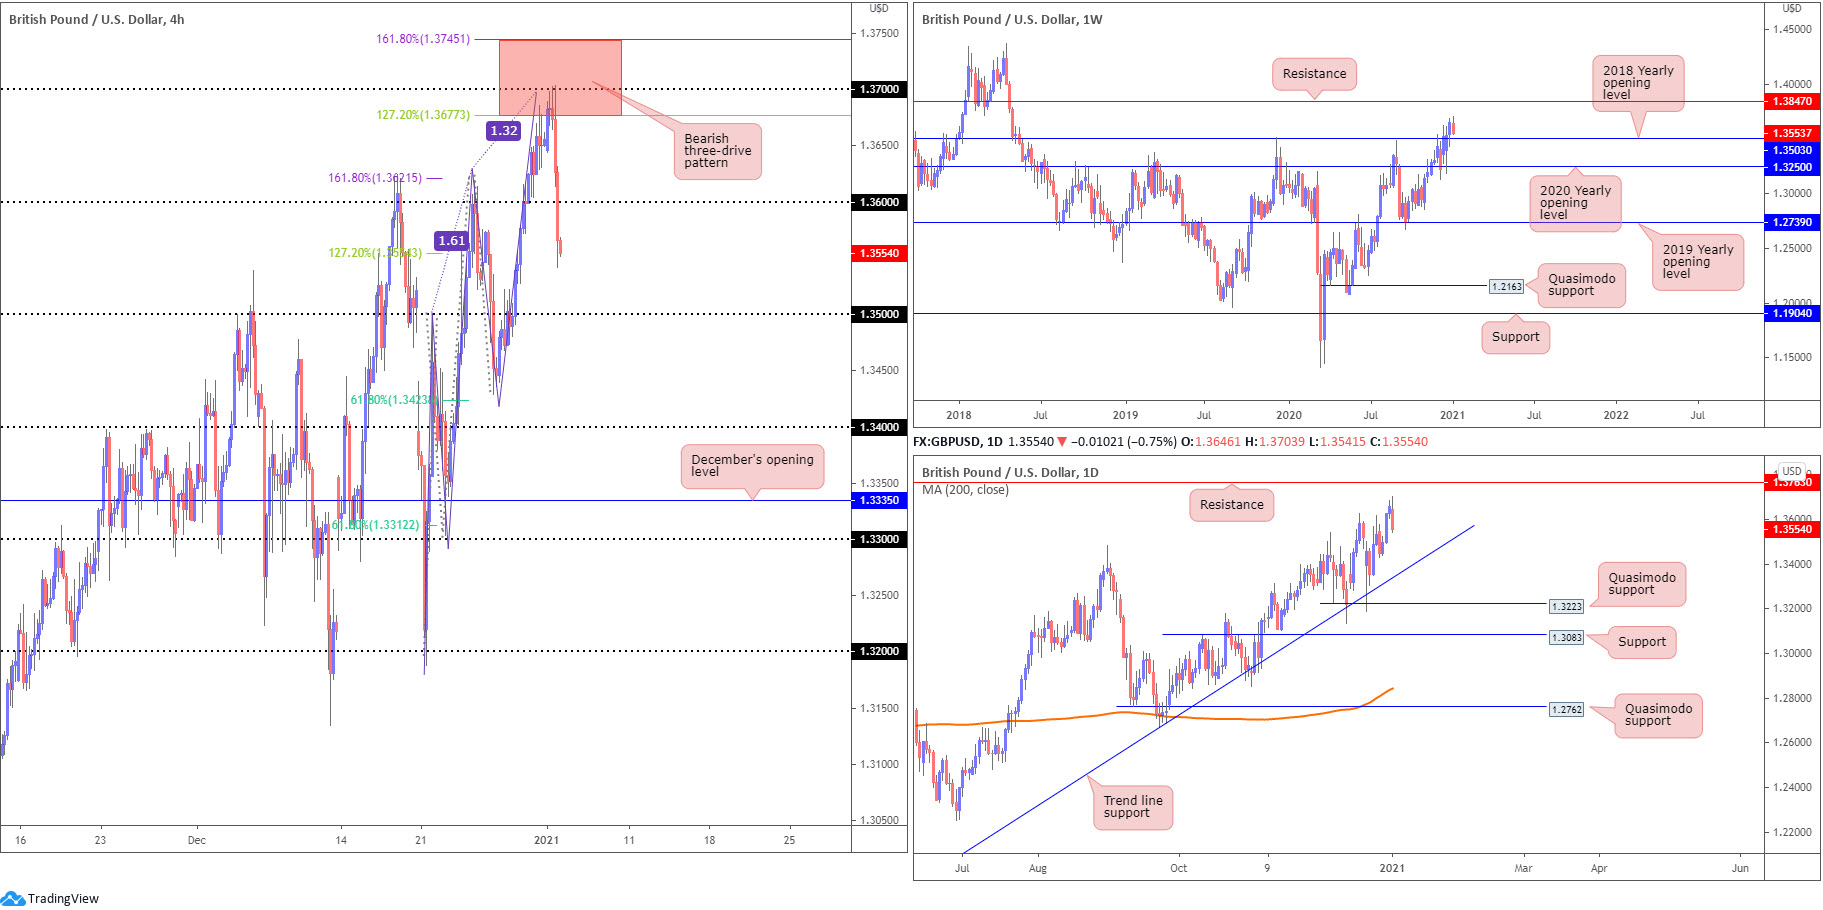
Sterling concluded sharply lower against the US dollar Monday, as UK COVID-19 cases continue to surge.
For those who read Monday’s technical briefing you may recall the following (italics):
Since December 20, the H4 candles have formed a three-drive bearish formation, with a termination zone seen between the 161.8%/127.2% Fibonacci projection points at 1.3745 and 1.3677, respectively (it is common to focus on the 127.2% ratios; however, leaving the 161.8% on the chart provides price some wiggle room and an area to help determine stop-loss placement).
As evident from the H4 chart, Monday responded from the 1.37 figure (and three-drive termination zone at 1.3745/1.3677) and destroyed any willing buyers off 1.36. Consequent to this, 1.35 is now in view.
Higher on the curve, weekly price shows the unit concluded 2020 at fresh multi-month highs. The 2018 yearly opening value at 1.3503 displays support, while further buying places emphasis on resistance at 1.3847. Also of technical interest was the engulf of 1.3514 (December 9 [2019] high), helping to confirm the current uptrend.
From the daily timeframe, price is seen weakening south of 1.3763 (previous Quasimodo support level), with selling to possibly test trend line support, etched from the low 1.1409. Traders may also acknowledge yesterday’s bearish outside reversal candle.
Areas of consideration:
- Retesting the underside of 1.36 on the H4 could interest sellers, having seen room to move lower on the weekly (support at 1.3503 – 2018 yearly opening value) and daily timeframes (to trend line support).
- In addition to the above, 1.35 stands as potentially strong support, merging with weekly support at 1.3503.
AUD/USD:
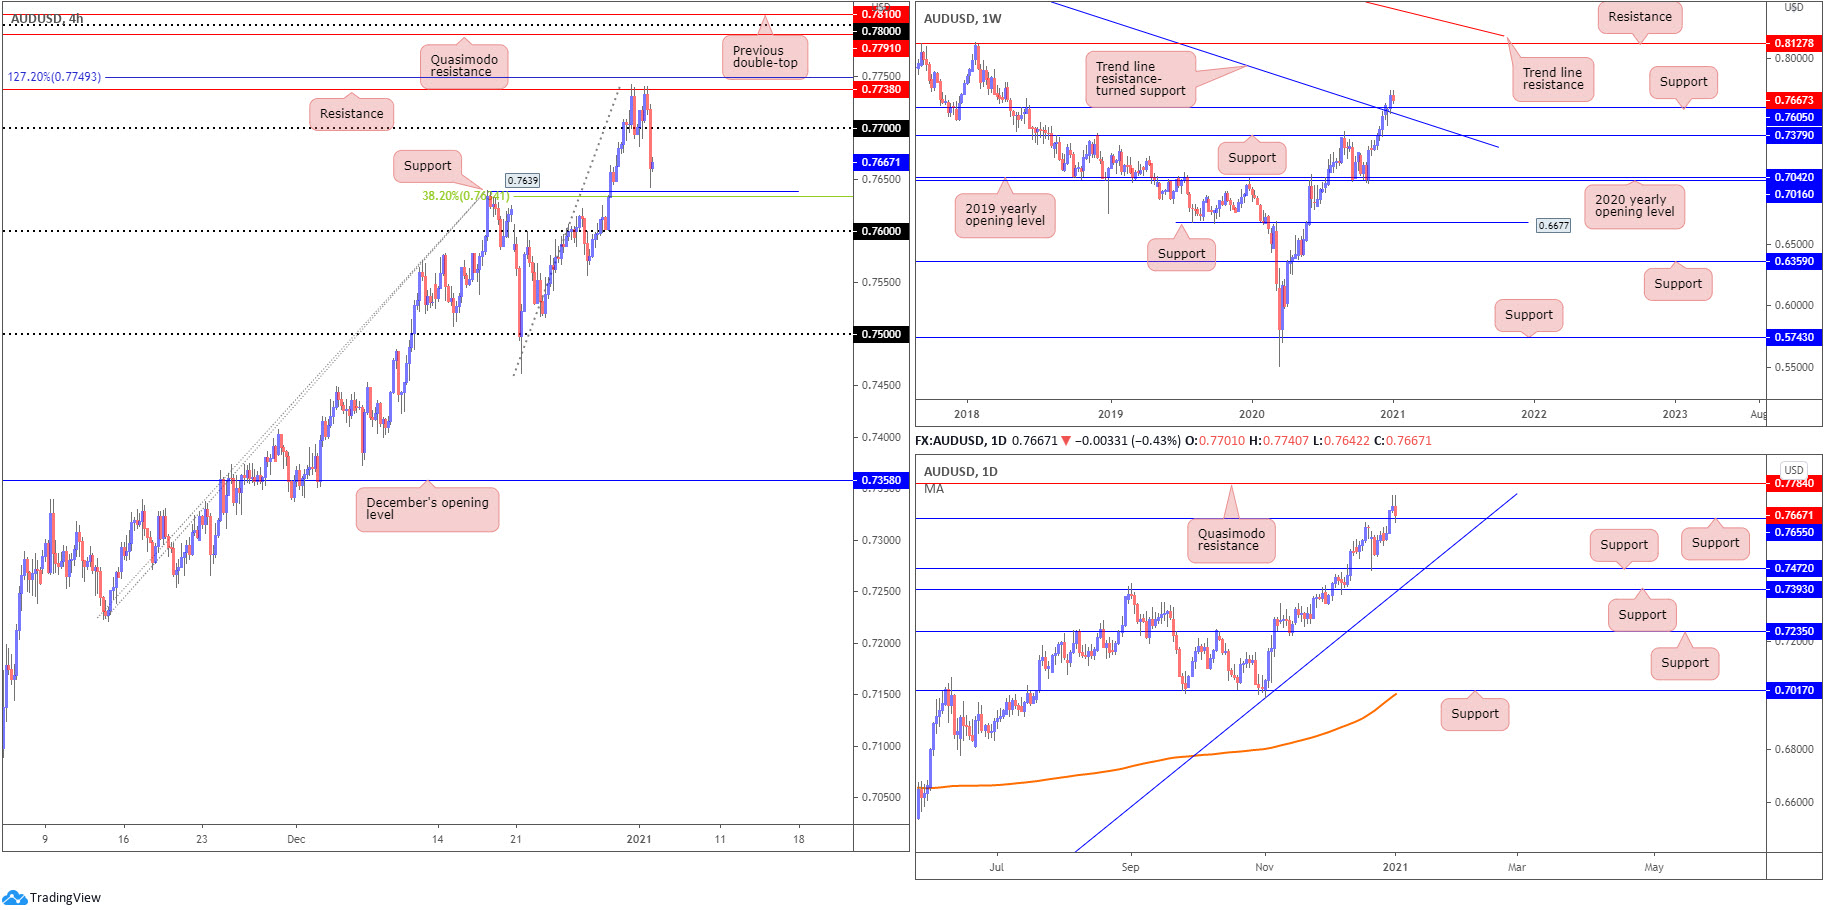
Fading risk sentiment, together with the US dollar index recovering off multi-month lows, observed AUD/USD take out 0.77 on Monday, following a rejection off H4 resistance at 0.7738 (sited just south of a 127.2% Fibonacci projection point at 0.7749, taken from the low 0.7221). The pair is seen currently nursing losses just above H4 support at 0.7639 and converging 38.2% Fibonacci retracement ratio at 0.7634.
The weekly timeframe’s technical landscape remains unchanged:
The Australian dollar wrapped up 2020 on the front foot against the US dollar, sailing to a fresh 28-month high at 0.7742. Consequently, the trend remains firmly to the upside. Price glided through Quasimodo resistance at 0.7605 (now serving support) and trend line resistance, taken from the high 1.1065. This places buyers in a strong position as we enter 2021 with room to possibly reach as far north as resistance coming in at 0.8127.
From the daily timeframe, resistance-turned support at 0.7655 was retested Monday. Holding off this level throws Quasimodo resistance at 0.7784 in sight, while moves lower has support at 0.7472 to target.
Areas of consideration:
- Overall, the AUD/USD’s technical trend remains pointing north.
- The daily timeframe’s support (0.7655) retest will likely cheer buyers on, though a push through here could be on the cards to draw in fresh weekly buying off weekly support at 0.7605. This would also imply a fakeout through H4 support at 0.7639 into the 0.76 figure.
USD/JPY:
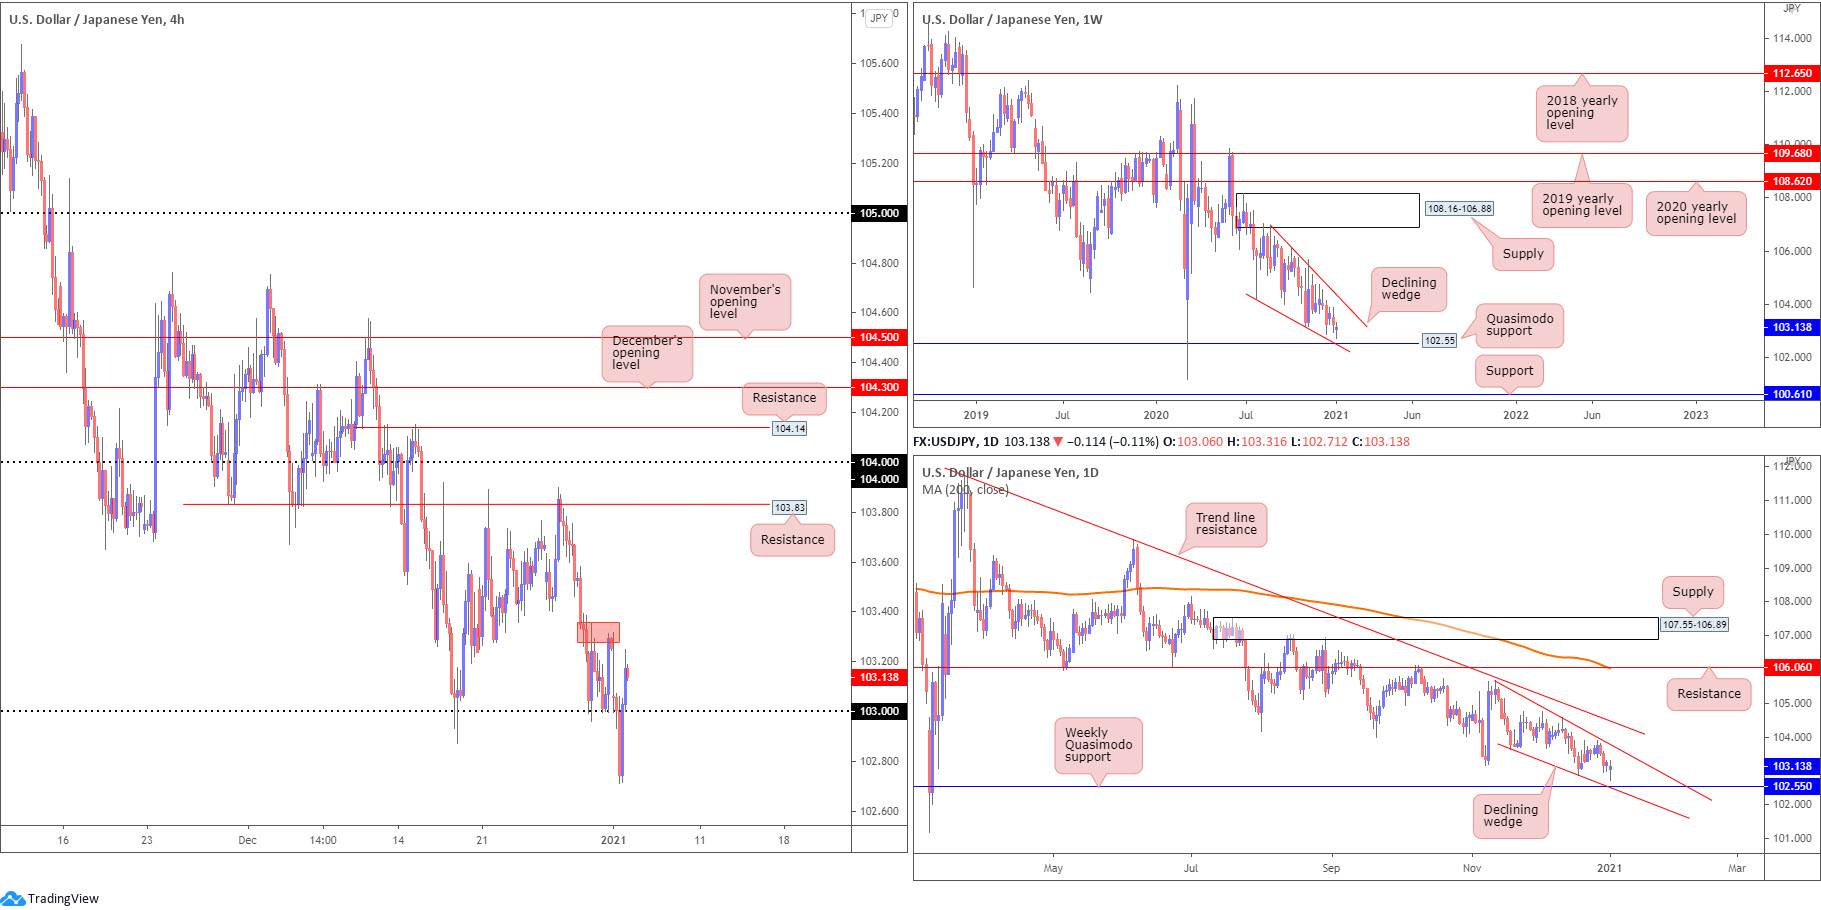
Following a monstrous fakeout through 103 to nine-month lows at 102.71 Monday, a move that likely caused pain on both sides of the market, USD/JPY staged a healthy recovery into the close. Reclaiming 103+ status, H4 is seen mildly fading 103.24 highs. Removing local resistance around 103.31 (red) perhaps clears the path for a bullish theme towards familiar resistance parked at 103.83.
As for the weekly timeframe, technical action remains entrenched within a declining wedge (106.94/104.18). Quasimodo support at 102.55 is also in the picture, with a break revealing support plotted at 100.61. A strong bounce from 102.55, however, may provide enough impetus for buyers to attempt a breakout above the current declining wedge.
The technical landscape on the daily timeframe reveals price closing in on the noted weekly Quasimodo support at 102.55. Technical traders may also acknowledge the daily declining wedge forming between 105.67/103.65, and trend line resistance directly above, taken from the high 111.71.
Areas of consideration:
- Both weekly and daily timeframes are in the process of forming declining wedges. Weekly Quasimodo support at 102.55 is also a level to be mindful of.
- Overpowering H4 resistance at 103.31 unlocks a potential bullish scenario to H4 resistance at 103.83.
- Below 103, the weekly Quasimodo support mentioned above at 102.55 represents a logical downside target.
USD/CAD:
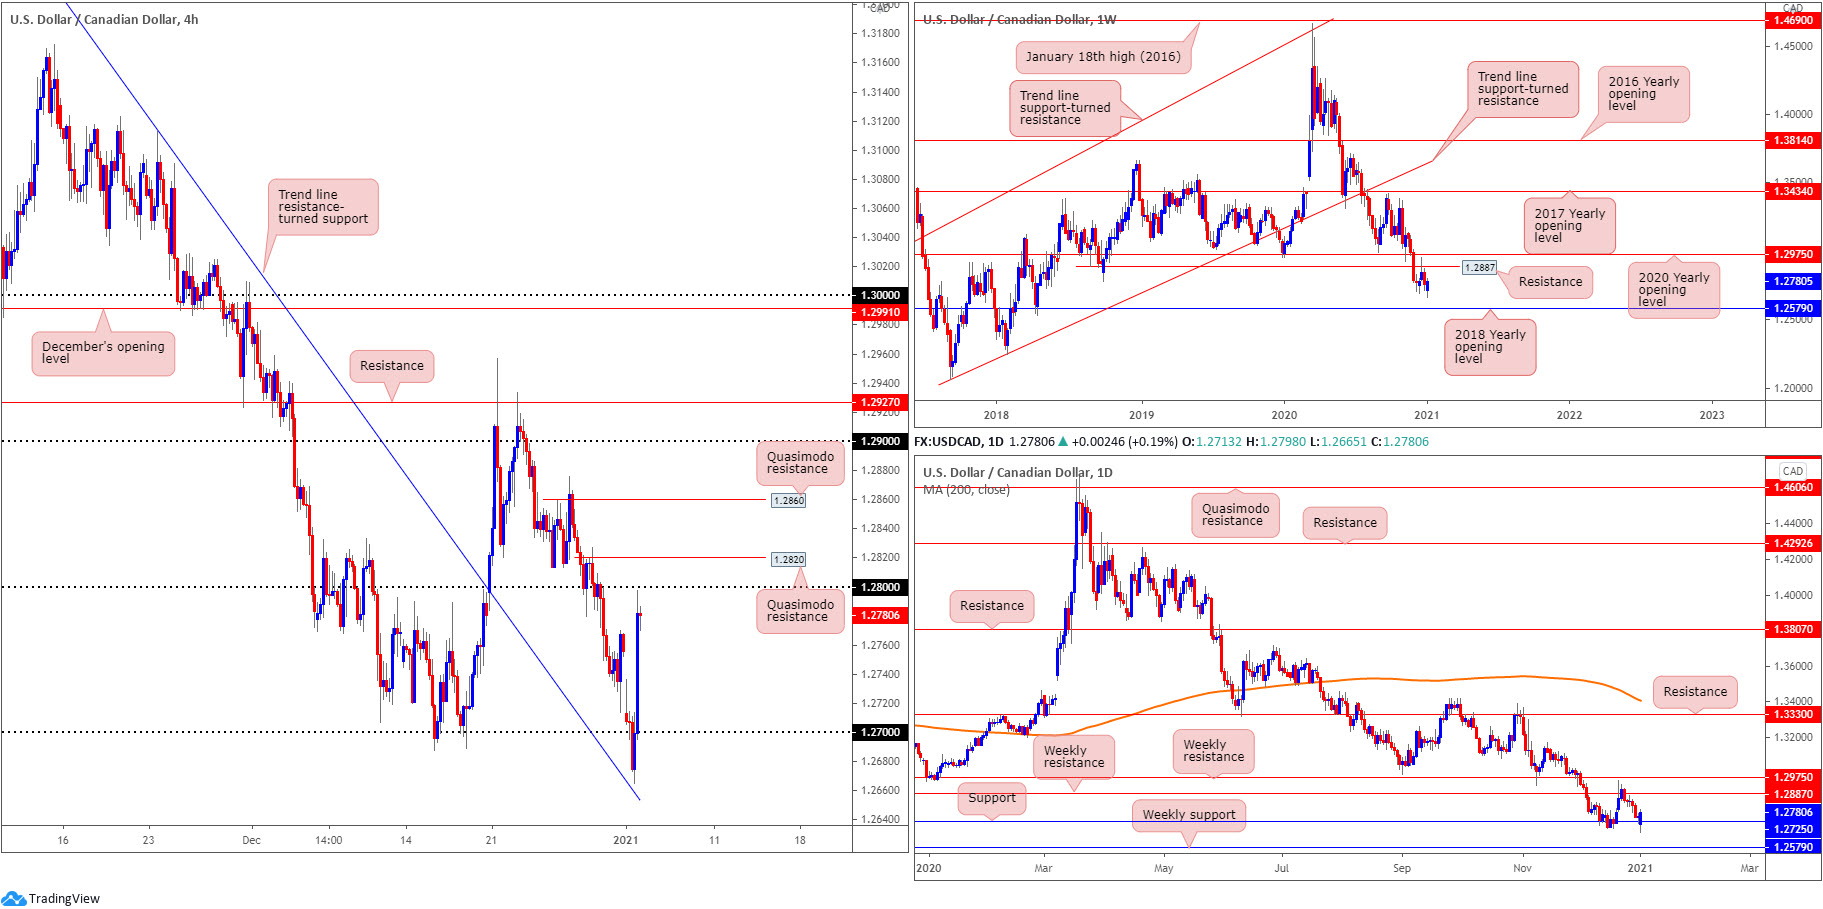
WTI ended sharply lower Monday, fading 10-month highs at $49.80 a barrel. This – coupled with strong recovery moves in the US dollar index – pulled USD/CAD north of 1.27 on the H4 (following near-test of trend line resistance-turned support, extended from the high 1.3389). In terms of resistance, 1.28 hovers overhead, with a break exposing Quasimodo resistances at 1.2820 and 1.2860.
Further afield, weekly price has buyers and seller going toe-to-toe between resistance at 1.2887 (previous Quasimodo support level) and support priced in at 1.2579 (the 2018 yearly opening value). Elsewhere, the daily timeframe shows support standing ground at 1.2725, with weekly resistance mentioned above at 1.2887 in the firing line as the first upside target.
Areas of consideration:
- A fakeout through 1.28 into H4 Quasimodo resistance at 1.2820 may spark a bearish theme, in line with the current downtrend.
- H4 Quasimodo resistance at 1.2860 may interest sellers, yet 1.29 could draw more attention given its close connection with weekly resistance at 1.2887.
USD/CHF:
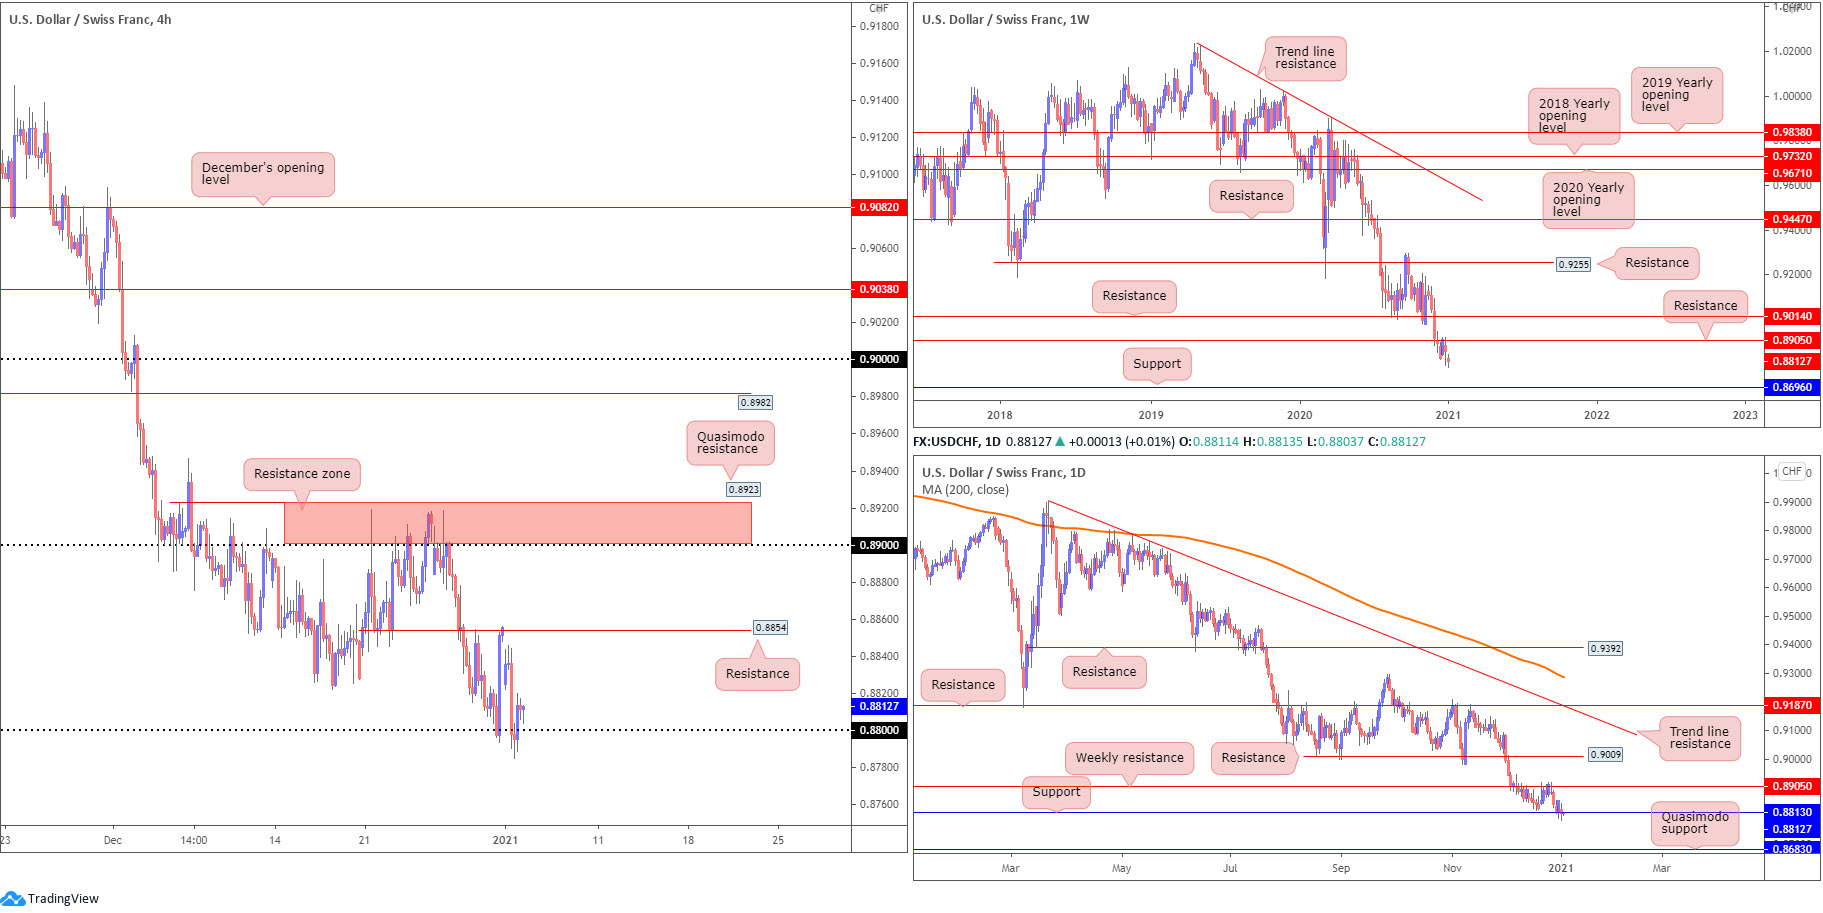
The US dollar phased in mild recovery gains against the Swiss franc Monday, defending troughs established just south of the 0.88 figure on the H4 timeframe. Resistance is placed overhead at 0.8854, a level serving sellers well since late December. Rupturing the latter theoretically frees upside to an interesting resistance area, composed of Quasimodo resistance at 0.8923 and the 0.89 figure. Beneath 0.88, sellers will likely be monitoring the 0.87 figure.
Broadening the technical view, we can see weekly price exhibits scope to produce further losses until shaking hands with support priced in at 0.8696. Daily support is seen in play at 0.8813, merging closely with the 0.88 figure based on the H4. Dropping through 0.8813 shines the spotlight on a daily Quasimodo support at 0.8683.
Areas of consideration:
- Weekly resistance at 0.8905 represents a key level in this market. Note the H4 resistance area between 0.8923-0.8900 also merges with the weekly base.
- Daily support at 0.8813 and the 0.88 figure form support to be watchful of.
- A H4 close above 0.8854 could spark intraday bullish flow to the 0.89ish region. Conservative buyers may seek a 0.8854 retest before committing.
- Should 0.88/0.8813 give way, a bearish scenario may form towards weekly support at 0.8696 – essentially the 0.87 figure on the H4.
Dow Jones Industrial Average:
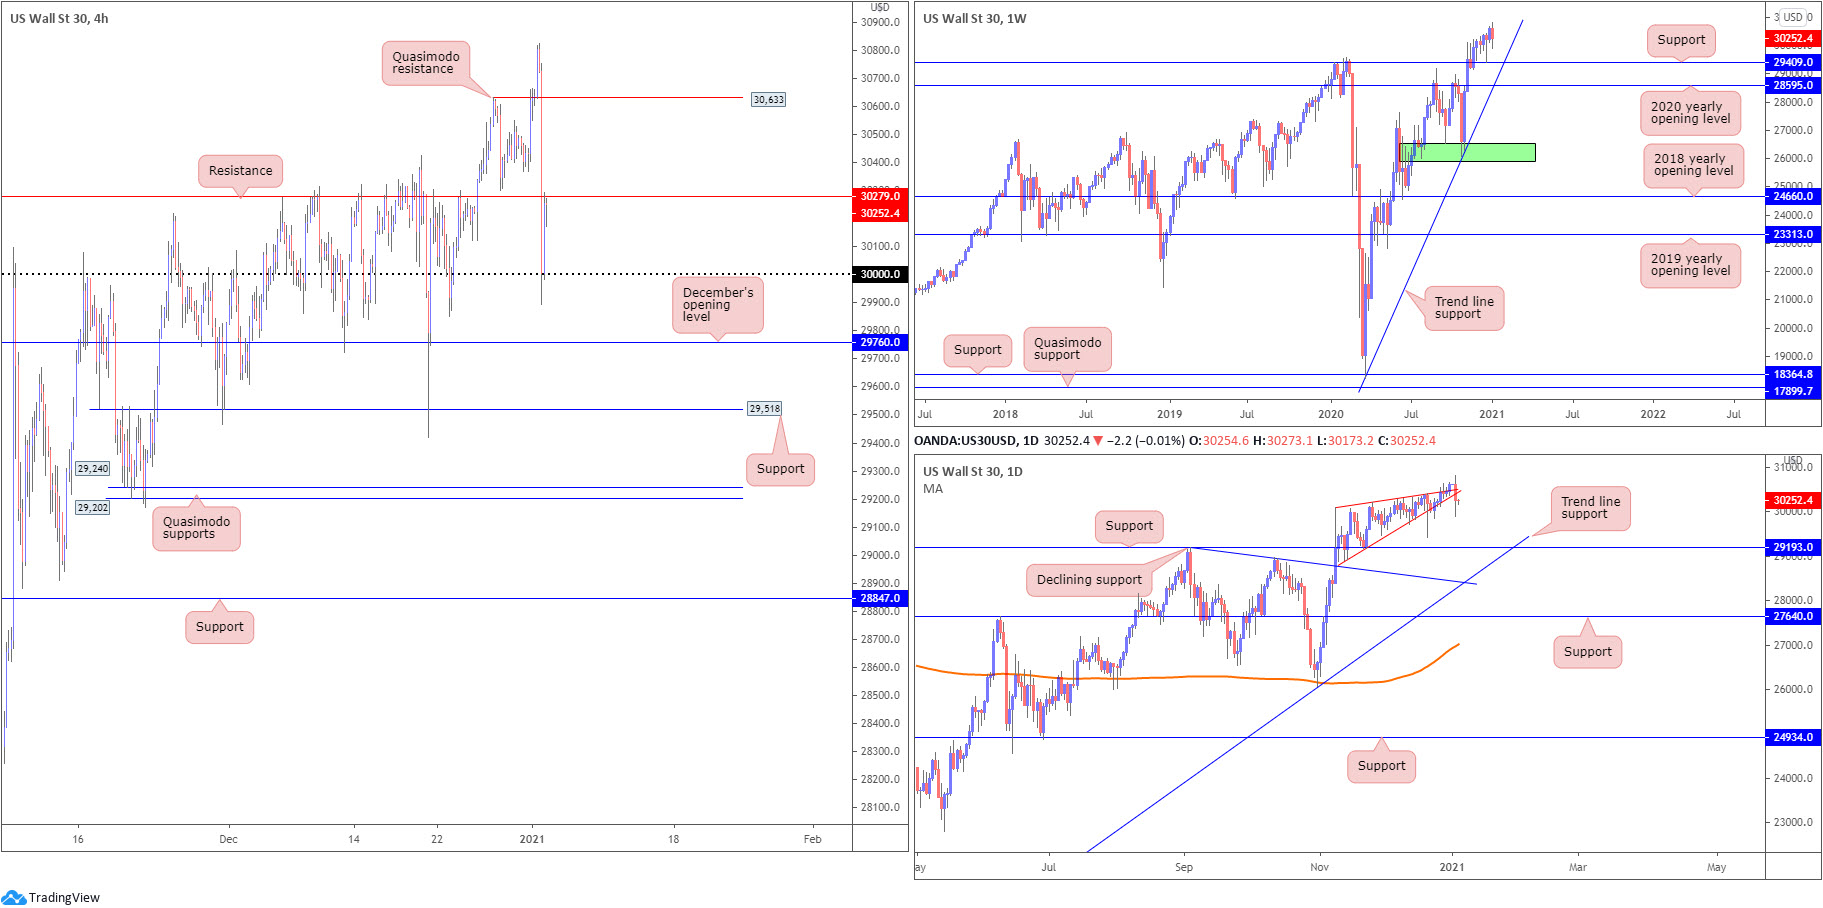
US equity benchmarks closed lower Monday amid COVID concerns. The Dow Jones Industrial Average shed 382.59 points, or 1.25%; the S&P 500 fell 55.42 points, or 1.48% and the Nasdaq dropped 189.84 points, or 1.47%.
From the weekly timeframe, support at 29,409 (previous Quasimodo resistance) remains in view, as does trend line support, extended from the low 18,213.
A closer reading of price action on the daily timeframe reveals the unit moulded a large bearish outside reversal candle on Monday. Pattern traders will also acknowledge the rising wedge between 28,940/30,097. Although somewhat of a disorderly pattern right now, yesterday’s bearish close possibly sets the stage to retest support at 29,193.
Monday’s sharp decline from all-time highs at 30,824 on the H4 formed a Quasimodo resistance level at 30,633, and subsequently breached support at 30,279 to test the 30,000 figure. As of current price, 30,279 is serving as resistance.
Areas of consideration:
- With the daily timeframe closing under a rising wedge, H4 resistance at 30,279 is a level sellers are likely aware of.
- Moving through 30,000 on the H4 has December’s opening value to target at 29,760.
XAU/USD (GOLD):
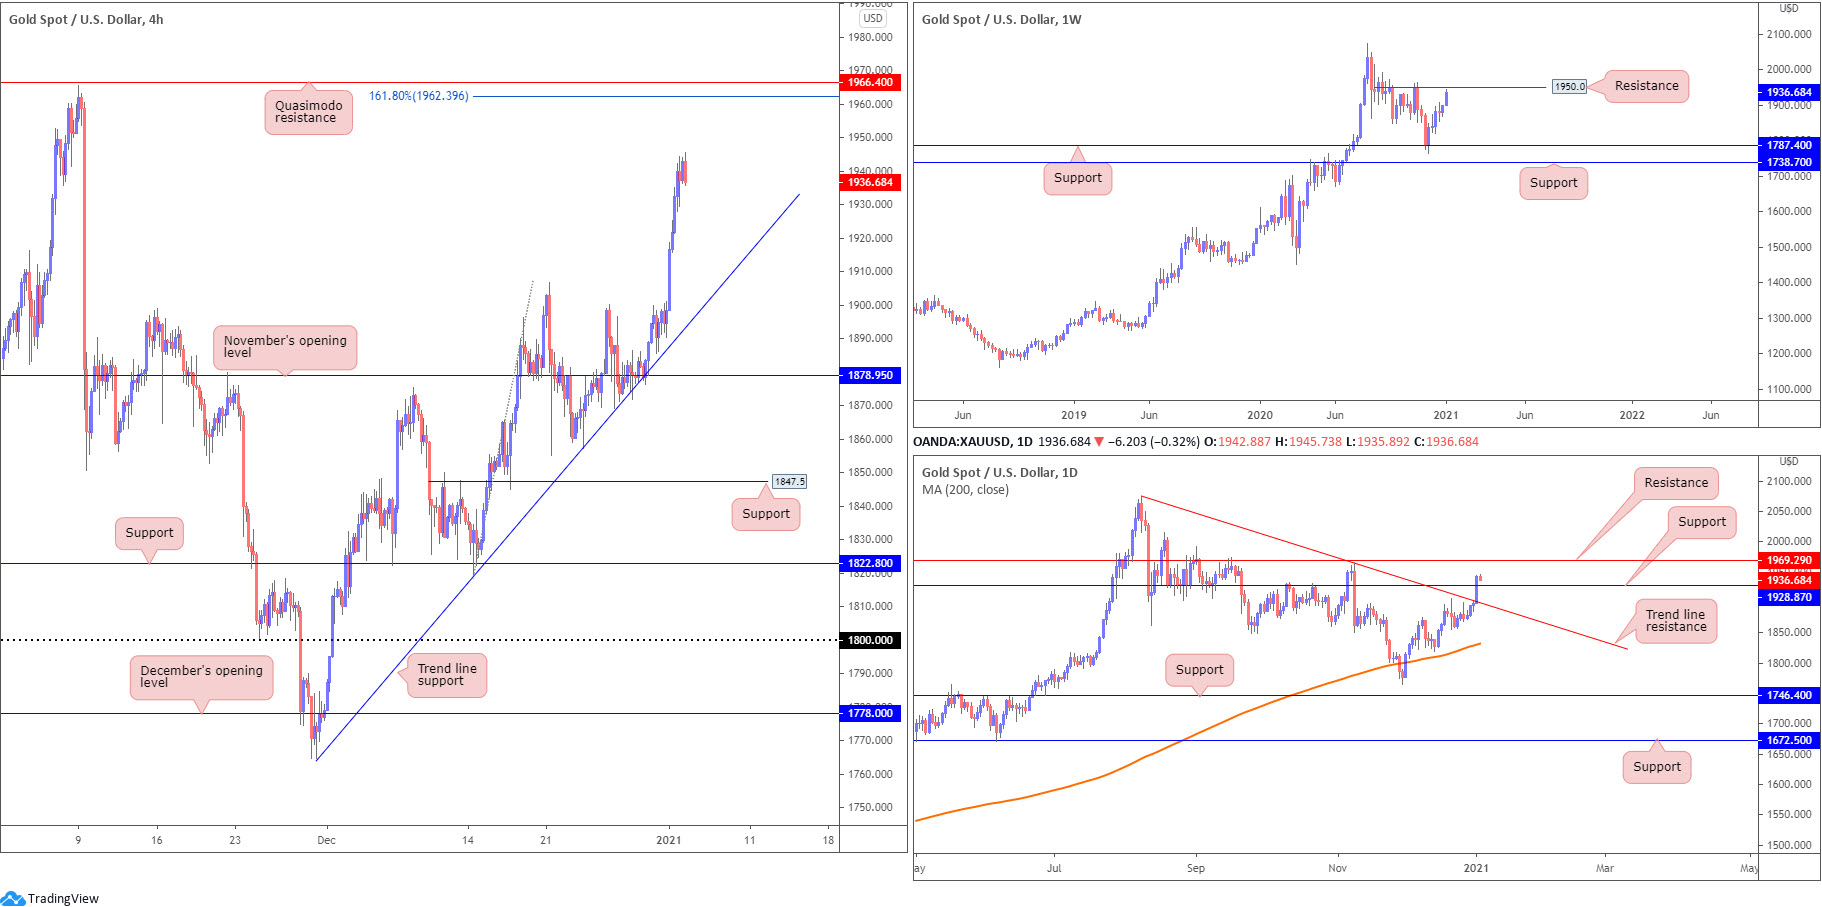
Weekly price remains in fine form north of support at $1,787, sited ahead of another support at $1,738. Further buying unveils resistance at $1,950, with a break here unlocking access to all-time peaks at $2,075. In terms of trend, the weekly timeframe shows we’ve been higher since early 2016.
A closer examination of price action on the daily chart shows price surged higher on Monday, boosted amidst initial USD weakness and safe-haven demand. Trend line resistance, taken from the high $2,075, together with resistance at $1,928 (now possible support), was engulfed. Technically, this shifts interest to resistance at $1,969.
Across the page on the H4 chart, trend line support, etched from the low $1,764, served buyers well. Yesterday’s advance, as you can see, placed Quasimodo resistance at $1,966 and a 161.8% Fibonacci projection point at $1,962 in sight.
Areas of consideration:
- Weekly price exhibits scope to approach resistance at $1,950, following the rebound off support at $1,787 in early December. Daily overthrowing resistance at $1,928 helps confirm an upside presence. In addition, H4 action reveals room to advance towards Quasimodo resistance at $1,966.
- A retest at daily support from $1,928 could interest dip-buying, targeting weekly resistance at $1,950. Another trend line retest on the H4 could also interest dip-buying.
The accuracy, completeness and timeliness of the information contained on this site cannot be guaranteed. IC Markets does not warranty, guarantee or make any representations, or assume any liability regarding financial results based on the use of the information in the site.
News, views, opinions, recommendations and other information obtained from sources outside of www.icmarkets.com.au, used in this site are believed to be reliable, but we cannot guarantee their accuracy or completeness. All such information is subject to change at any time without notice. IC Markets assumes no responsibility for the content of any linked site.
The fact that such links may exist does not indicate approval or endorsement of any material contained on any linked site. IC Markets is not liable for any harm caused by the transmission, through accessing the services or information on this site, of a computer virus, or other computer code or programming device that might be used to access, delete, damage, disable, disrupt or otherwise impede in any manner, the operation of the site or of any user’s software, hardware, data or property.


