
Waiting for lower timeframe confirmation is our main tool to confirm strength within higher timeframe zones, and has really been the key to our trading success. It takes a little time to understand the subtle nuances, however, as each trade is never the same, but once you master the rhythm so to speak, you will be saved from countless unnecessary losing trades. The following is a list of what we look for:
- A break/retest of supply or demand dependent on which way you’re trading.
- A trendline break/retest.
- Buying/selling tails/wicks – essentially we look for a cluster of very obvious spikes off of lower timeframe support and resistance levels within the higher timeframe zone.
We typically search for lower-timeframe confirmation between the M15 and H1 timeframes, since most of our higher-timeframe areas begin with the H4. Stops are usually placed 1-3 pips beyond confirming structures.
EUR/USD:
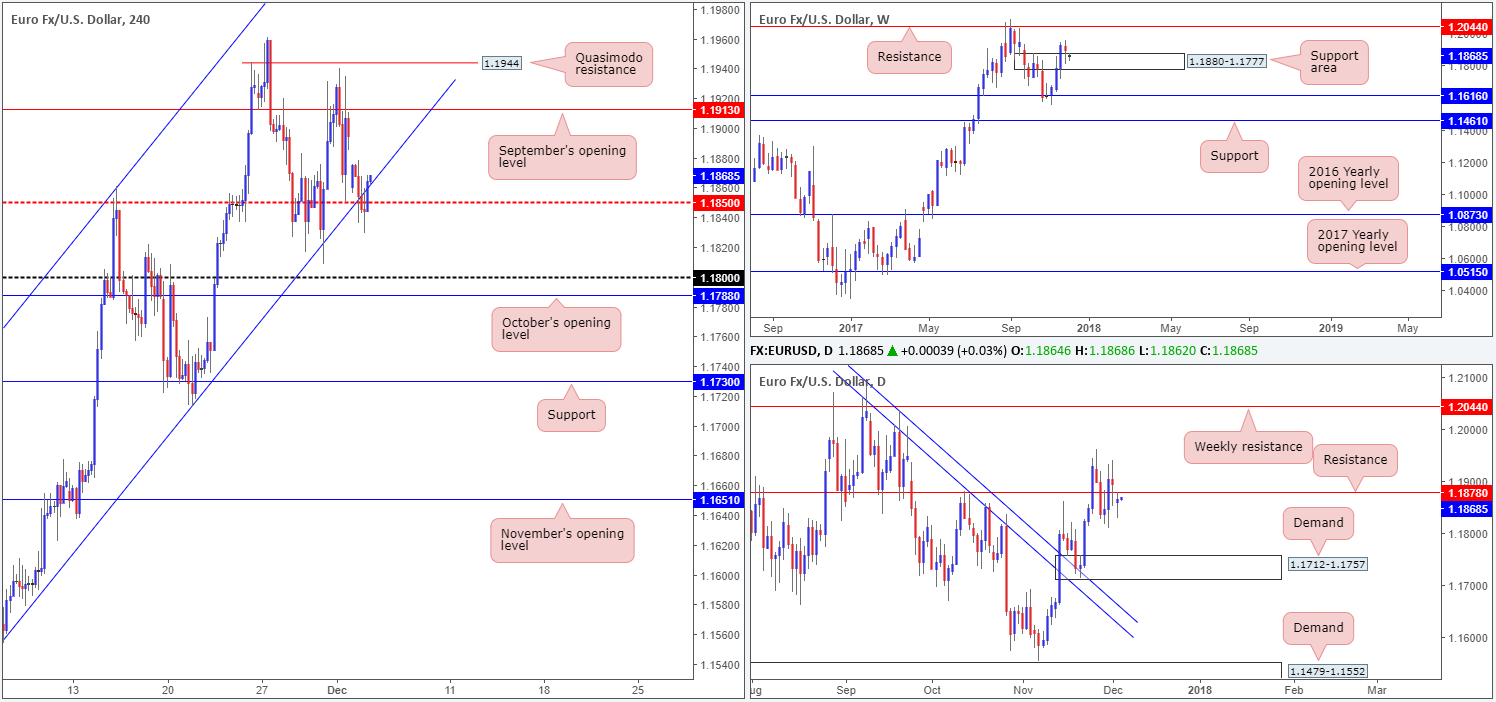
Demand for the euro remained weak on Monday, as the pair kicked off the week noticeably lower. Shortly after, H4 sellers attempted to breach a nearby H4 mid-level support at 1.1850 and an intersecting H4 channel support etched from the low 1.1553, managing to reach a session low of 1.1829 before rotating back to the upside.
Over on the weekly timeframe, the single currency remains trading within the walls of a weekly supply-turned support zone at 1.1880-1.1777. Eventually, we believe this could revive demand and lift the pair up to the weekly resistance seen at 1.2044. Daily support at 1.1878, as you can see, suffered another breach due to yesterday’s opening gap. Despite this, the recently closed daily candle displayed little bearish intent.
Suggestions: Given weekly structure indicates buying, and H4 price is currently seen trading back within the H4 ascending channel support, a buy is favored. The only problem we face is the daily resistance level. Buying into this level, although a break above it is high probability, is not something we’d feel comfortable with. Therefore, until this resistance is out of the picture, opting to stand on the sidelines today may be the better path to take.
Data points to consider: US trade balance at 1.30pm; US ISM non-manufacturing PMI at 3pm GMT.
Levels to watch/live orders:
- Buys: Flat (stop loss: N/A).
- Sells: Flat (stop loss: N/A).
GBP/USD:
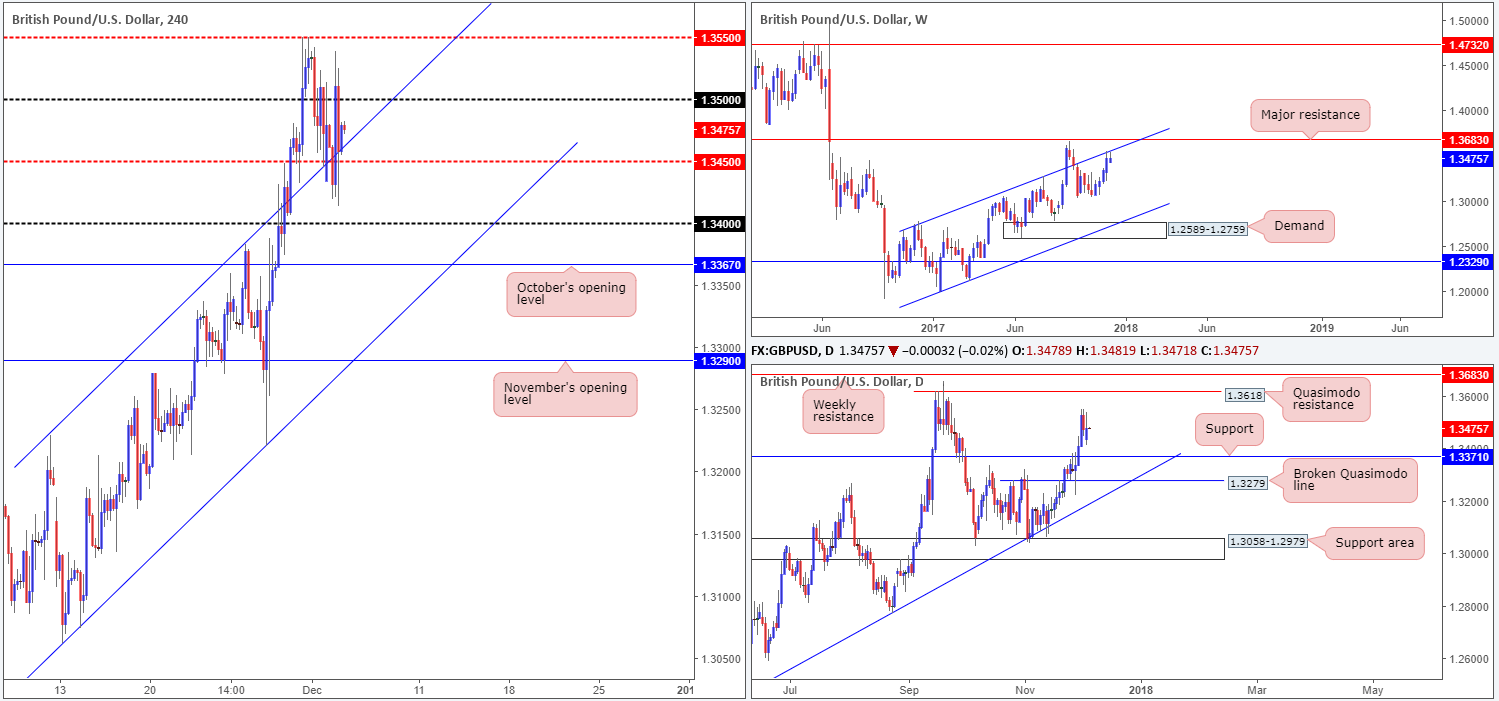
The GBP/USD failed to sustain upside beyond 1.35 after reports emerged from the BBC stating not to expect a deal from Brexit talks on Monday. May and Juncker who met on Monday confirmed the headlines, which sent the pair tumbling to lows of 1.3413.
As we write, however, the H4 candles appear to be bolstered by a H4 channel resistance-turned support taken from the high 1.3229/H4 mid-level support at 1.3450. The weekly picture remains capped by a weekly channel resistance extended from the high 1.2673. Regardless of the fact that this barrier was breached back in September, this line has proved worthy in the past and, therefore, may suppress buying this week and send the British pound lower. Assuming that the weekly channel resistance holds ground, daily price shows that the unit could trade as far south as the daily support level pegged at 1.3371. To the upside, nevertheless, there’s room for the daily candles to push up to a daily Quasimodo resistance level penciled in at 1.3618 (sited beneath weekly resistance at 1.3683 – the next upside target beyond the current weekly channel resistance).
Suggestions: Buying at current prices is challenging. Not only is the 1.35 lurking above, we also have the weekly channel resistance to contend with!
In much the same fashion as on Monday, rather than buying around 1.3450 we’re still looking for H4 price to close beneath this level. A decisive H4 close lower coupled with a retest and a reasonably sized H4 bearish candle (preferably in the shape of a full or near-full-bodied candle) would, in our view, be enough to suggest shorts. This potentially opens up downside to the 1.34 handle, followed closely by October’s opening level at 1.3367 (sits directly below the daily support mentioned above at 1.3371).
Data points to consider: UK services PMI at 9.30am; US trade balance at 1.30pm; US ISM non-manufacturing PMI at 3pm GMT.
Levels to watch/live orders:
- Buys: Flat (stop loss: N/A).
- Sells: Watch for H4 price to engulf 1.3450 and then look to trade any retest seen thereafter ([waiting for a reasonably sized H4 bearish candle to form following the retest – preferably a full or near-full-bodied candle – is advised] stop loss: ideally beyond the candle’s wick).
AUD/USD:
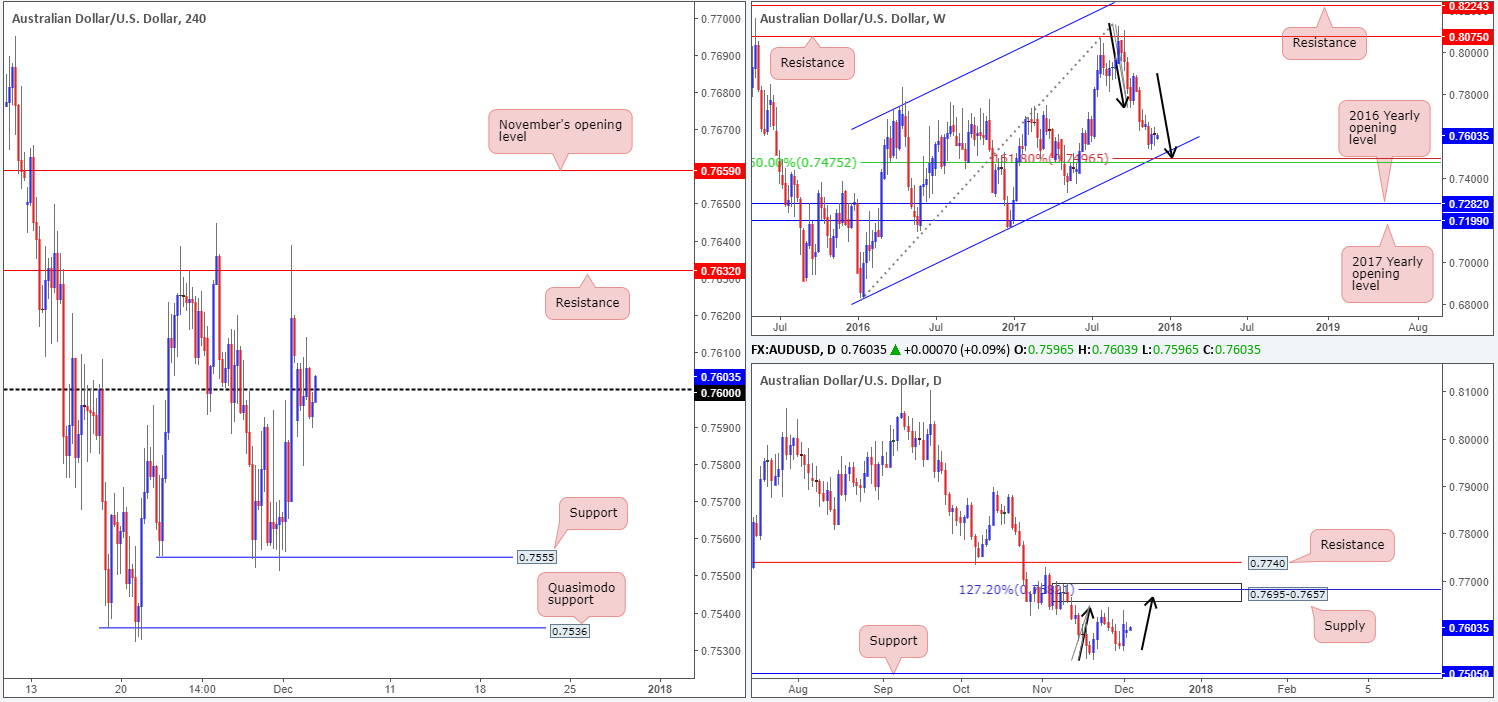
As can be seen from the H4 chart this morning, the Aussie opened the week marginally lower against the US dollar, consequently cracking through the 0.76 handle. From then on, the pair entered into a tight consolidation for the remainder of the day, oscillating back and forth around 0.76. Given the somewhat lackluster performance on Monday, much of the following report will echo similar thoughts put forward in yesterday’s analysis.
We still have our eye on a particularly interesting weekly support. Merging with a weekly channel support extended from the low 0.6827 and a weekly 50.0% value at 0.7475 taken from the high 0.8125, there’s a nice-looking weekly AB=CD (see black arrows) 161.8% Fib ext. point situated at 0.7496.
A closer look at price action on the daily timeframe reveals that price could be in the process of forming a potential daily AB=CD bearish formation (see black arrows) that completes around the 127.2% daily Fib ext. point at 0.7685, which is also seen positioned within the upper walls of a daily supply zone at 0.7695-0.7657.
Suggestions: According to our technicals, neither a long nor short is attractive at current prices.
However, we would be interested sellers within the aforesaid daily supply, specifically around the noted daily AB=CD completion point. On the buy side, the 0.75 handle is the area that continues to stand out, due to its weekly/daily confluence.
Data points to consider: RBA rate statement and interest rate decision at 3.30am; US trade balance at 1.30pm; US ISM non-manufacturing PMI at 3pm GMT.
Levels to watch/live orders:
- Buys: 0.75 region (50-70 pip stop loss).
- Sells: 0.7680 region (stop loss: 0.7720).
USD/JPY:
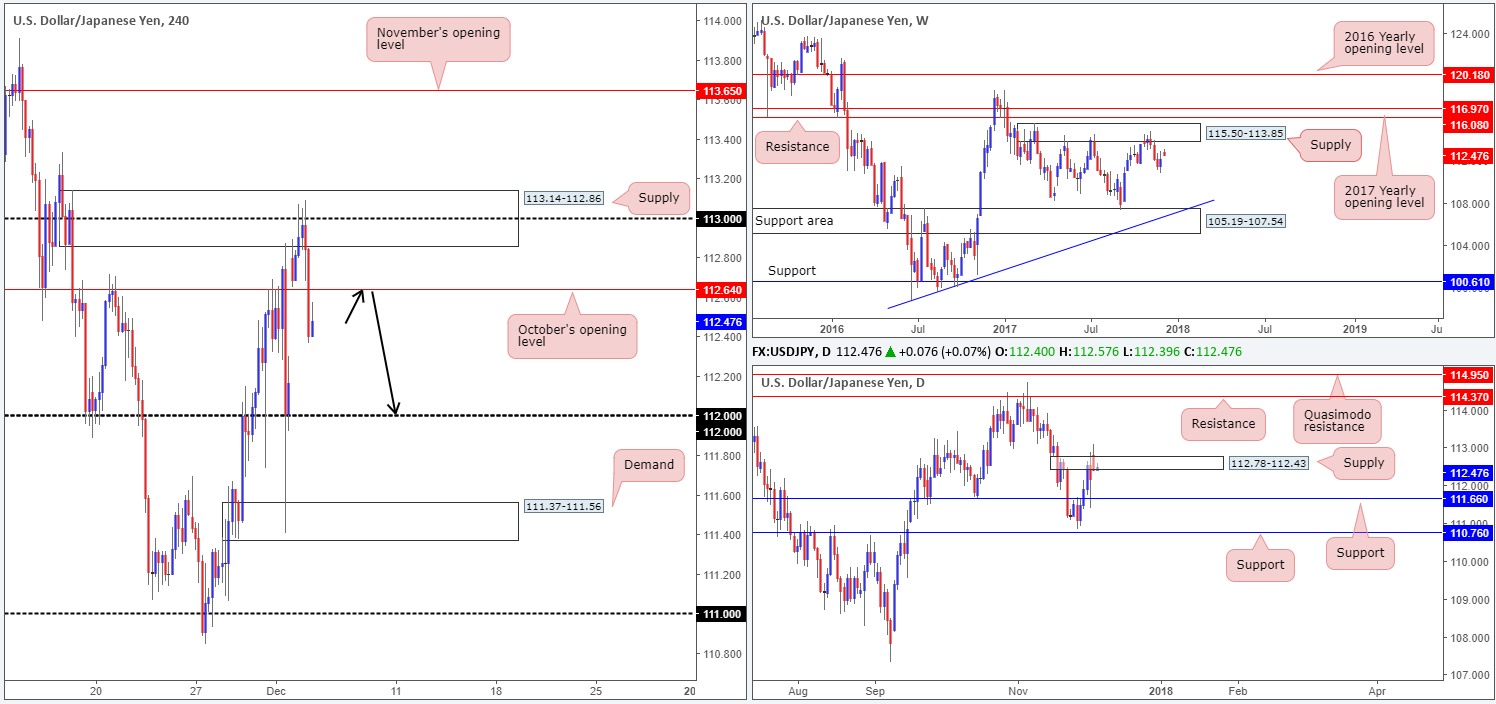
Following a rather aggressive 60-pip bullish gap on Monday, the USD/JPY extended early gains to a high of 113.08 before losing momentum and tumbling lower into the US segment. The selloff may have something to do with the strong-looking H4 supply at 113.14-112.86 and intersecting round number 113.
The day ended with H4 price closing beneath October’s opening level at 112.64. The next downside target from this point is the 112 handle, followed by a H4 demand located at 111.37-111.56.
Daily supply at 112.78-112.43 had its top edge challenged during yesterday’s movement, but somehow managed to survive! A continued push lower from here brings the daily support at 111.66 into the spotlight.
Suggestions: A retest to the underside of 112.64 on the H4 timeframe is, as far as we can see, a stable location to look for shorting opportunities. Besides having a daily supply bolstering downside at the moment, we also have the weekend gap which has ‘fill me’ written all over it. A sell from 112.64 is certainly something we’re interested in if H4 sellers prove intent in the shape of a full or near-full-bodied bearish candle. Assuming a trade comes to fruition, the 112 handle will be the first take-profit target, followed by daily support at 111.66.
Data points to consider: US trade balance at 1.30pm; US ISM non-manufacturing PMI at 3pm GMT.
Levels to watch/live orders:
- Buys: Flat (stop loss: N/A).
- Sells: 112.64 region ([waiting for a reasonably sized H4 bearish candle to form – preferably a full or near-full-bodied candle – is advised] stop loss: ideally beyond the candle’s wick).
USD/CAD:
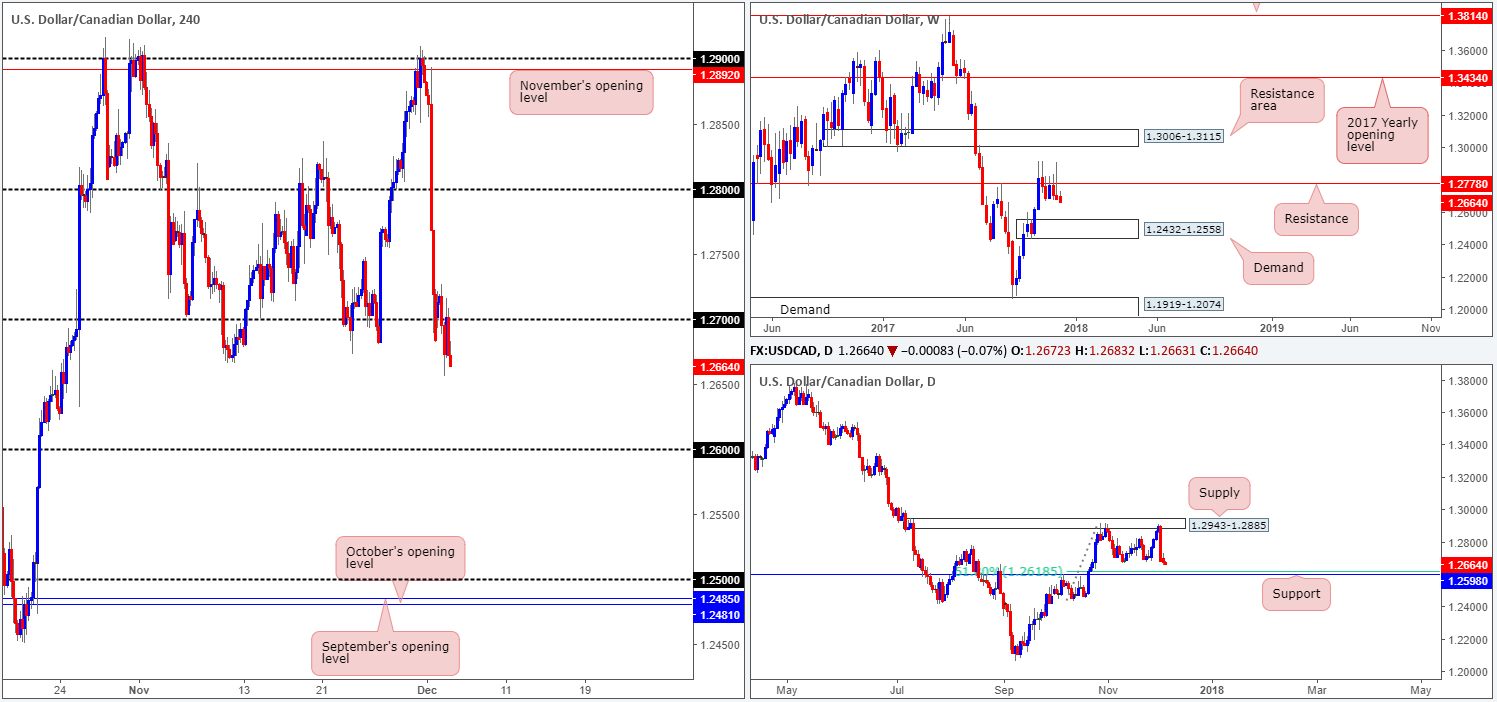
For those who read our previous report on the USD/CAD you may recall that we were looking to sell the retest of the 1.27 handle. Here’s why:
- Upside remains capped on the weekly timeframe at 1.2778. The current weekly resistance level on the USD/CAD shares a strong history that dates back to early 2004, so it is not one to ignore! Couple this with the fact that last week’s weekly action chalked up a strong-looking bearish selling wick (likely capturing the attention of candlestick traders), further selling could be in the offing this week. In the event that the market continues to dip south from here, traders’ crosshairs will likely be fixed on the weekly demand at 1.2432-1.2558. Boasting a strong base, this demand area communicates strength and, therefore, will likely hold back sellers should the area come into play.
- Daily price completely erased last week’s gains on Friday in the shape of a strong full-bodied daily bearish candle. This has perhaps opened up downside to daily support at 1.2598 this week (merges with a 61.8% Fib support at 1.2618).
As H4 price closed below 1.27 on Monday and struck a low of 1.2656, and then followed through with a retest of 1.27 as resistance in the shape of a near-full-bodied bearish H4 candle, the team took a short trade at 1.2672, and placed a stop at 1.2717.
Suggestions: The first take-profit level, as highlighted in yesterday’s report, will be set at the 1.26 handle, followed by the top edge of the weekly demand base at 1.2558.
Data points to consider: US trade balance at 1.30pm; US ISM non-manufacturing PMI at 3pm; Canadian trade balance at 1.30pm GMT.
Levels to watch/live orders:
- Buys: Flat (stop loss: N/A).
- Sells: 1.2672 ([live] stop loss: 1.2717).
USD/CHF:
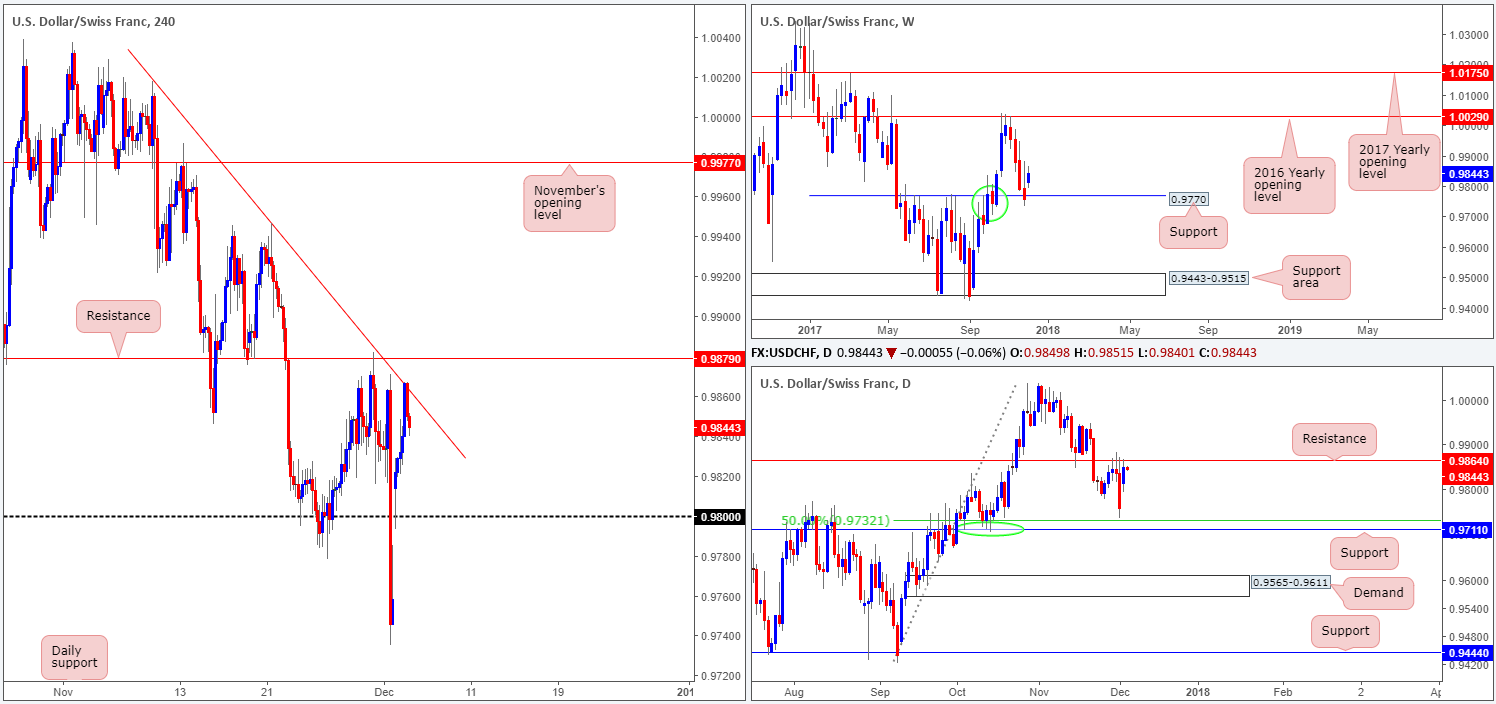
Kicking things off from the top this morning, the weekly timeframe shows that although the week concluded with a marginal close beneath weekly support at 0.9770, the pair aggressively rotated back to the upside on Monday. Technically speaking, this likely has something to do with the base of weekly demand to the left of current price marked with a green circle at 0.9704-0.9783. Before the bulls can push higher, though, daily price will need to overcome the daily resistance plotted at 0.9864. This barrier possesses a reasonably attractive history, so expect some selling pressure to materialize from here.
Across on the H4 timeframe, the week began with a rather abrupt opening gap, consequently clearing the 0.98 handle and retesting it as support. The Swissie continued to extend its gains throughout the day on improved market sentiment, pushing up to a H4 trendline resistance extended from the high 1.0017.
Suggestions: Entering into a long position on the basis of weekly structure knowing that daily price is testing the underside of a daily resistance and H4 price is busy pairing recent gains from the current H4 trendline resistance, is not a trade we’d label high probability. Despite both H4 and daily price displaying a rather strong bearish tone, selling is just as awkward. Selling into weekly flow seldom ends well!
Remaining on the sidelines until more conducive price action presents itself is the route we’ve chosen to take.
Data points to consider: US trade balance at 1.30pm; US ISM non-manufacturing PMI at 3pm GMT.
Levels to watch/live orders:
- Buys: Flat (stop loss: N/A).
- Sells: Flat (stop loss: N/A).
DOW 30:
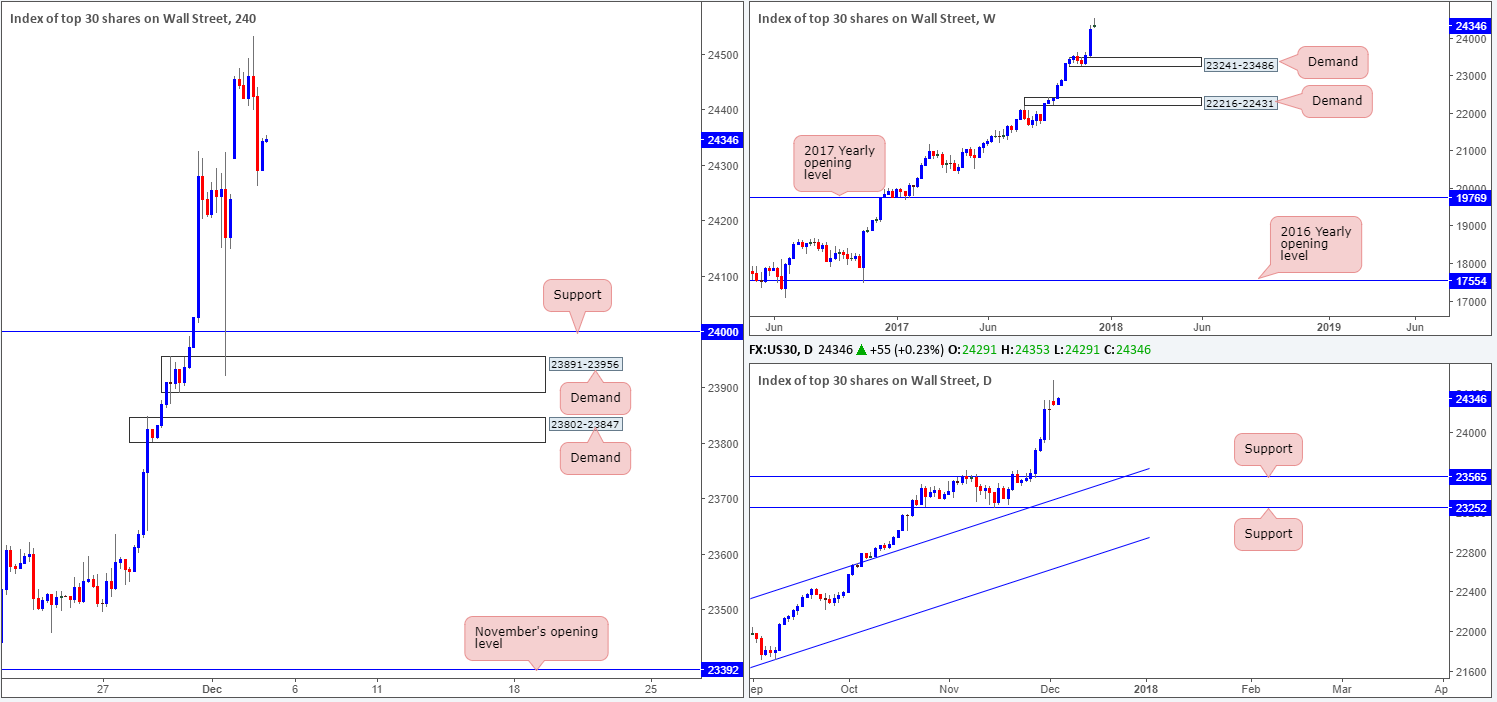
The DJIA gapped 74 points north to begin the week. This attracted fresh buying and eventually saw the index connect with a fresh record high of 24532. It was only once the US segment got underway did we see the unit depreciate and fill the weekend gap.
Investors assessed the potential impact of the tax bill in different sectors. Financial shares boasted a good start to the week as banks benefit from the proposed tax cuts.
Over the course of last week’s sessions US equities put in a strong performance. What this move did was help create a strong-looking demand base seen on the weekly timeframe at 23241-23486. As is evident from the H4 timeframe, the index aggressively stabbed lower on Friday, whipsawing through the 24K mark and shaking hands with a H4 demand area at 23891-23956.
Suggestions: As the H4 demand area at 23891-23956 proved itself worthy on Friday, this is an area, alongside the H4 demand printed below it at 23802-23847, we’ll be watching this week for potential longs. Given that there is a chance H4 price could fake below the upper H4 demand base to connect with the one below, a H4 full or near-full-bodied candle must take shape in order to confirm buyer intent, before we’d feel comfortable pulling the trigger.
Data points to consider: US trade balance at 1.30pm; US ISM non-manufacturing PMI at 3pm GMT.
Levels to watch/live orders:
- Buys: 23891-23956 ([waiting for a reasonably sized H4 bullish candle to form – preferably a full or near-full-bodied candle – is advised] stop loss: ideally beyond the candle’s tail). 23802-23847 ([waiting for a reasonably sized H4 bullish candle to form – preferably a full or near-full-bodied candle – is advised] stop loss: ideally beyond the candle’s tail).
- Sells: Flat (stop loss: N/A).
GOLD:
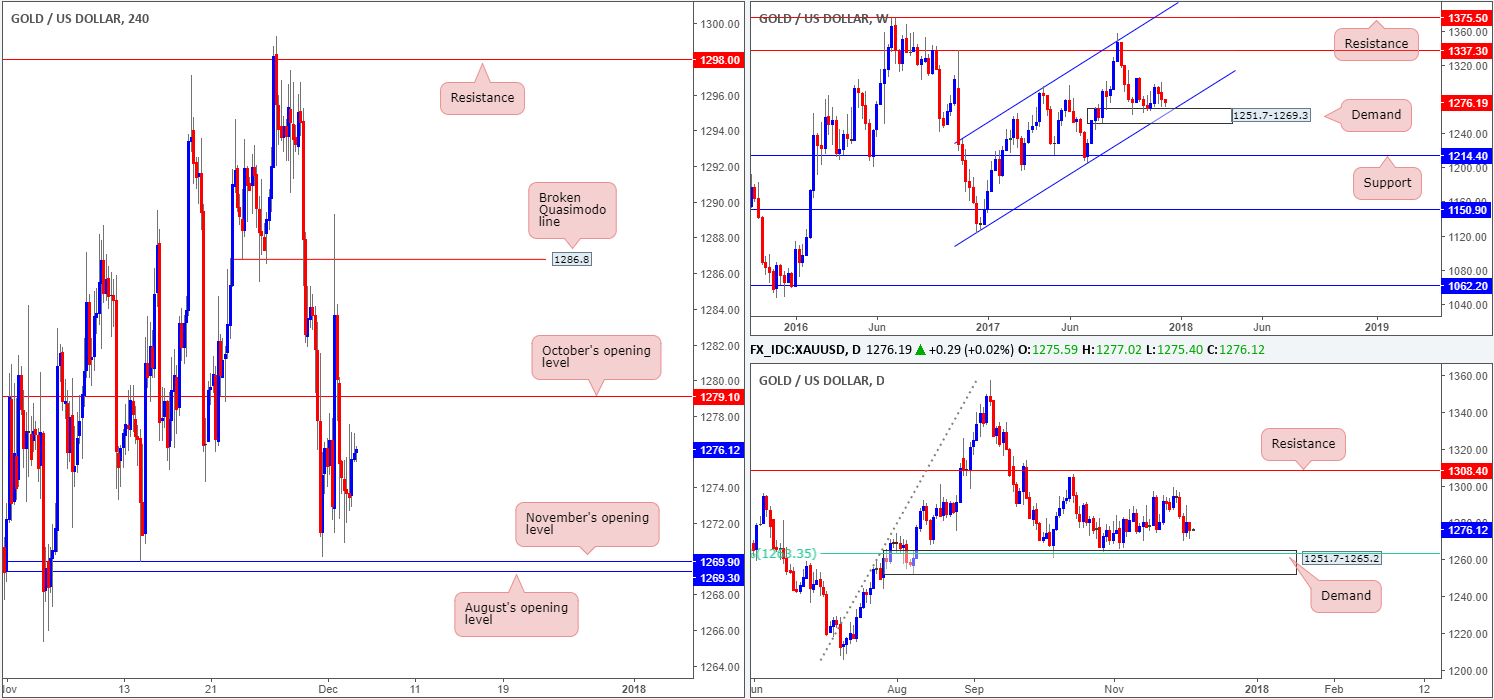
During the course of Monday’s sessions, the yellow metal spent the majority of the day hovering above August/November’s opening levels seen on the H4 timeframe at 1269.3/1269.9. H4 bulls, as you can see though, went on the offensive in the later hours, and, at the time of writing, seem poised to challenge October’s opening level at 1279.1.
Elsewhere, the bigger picture shows that gold formed a nice-looking weekly bearish engulfing candle last week.
Should this candle formation be of concern to traders who are currently long from the weekly demand at 1251.7-1269.3? It is difficult to judge from where we’re sitting. Here’s why. On the one hand, this weekly demand is bolstered by a weekly channel support etched from the low 1122.8, therefore promoting strength. On the other hand, each time the weekly demand base is tested, price fails to print a higher high, which could mean that sellers are overwhelming buying momentum here.
Last week’s descent has placed daily candles within touching distance of daily demand at 1251.7-1265.2, which is not only positioned within the lower limits of the weekly demand mentioned above, it also houses a 61.8% daily Fib support at 1263.3.
Suggestions: From our perspective, this remains a somewhat difficult market to trade at the moment. Weekly action is challenging to read given the conflicting price action, along with H4 price not showing enough confluence to base a trade from.
With the above notes in mind, we see little choice but to remain on the sidelines today.
Levels to watch/live orders:
- Buys: Flat (stop loss: N/A).
- Sells: Flat (stop loss: N/A).


