
DXY:
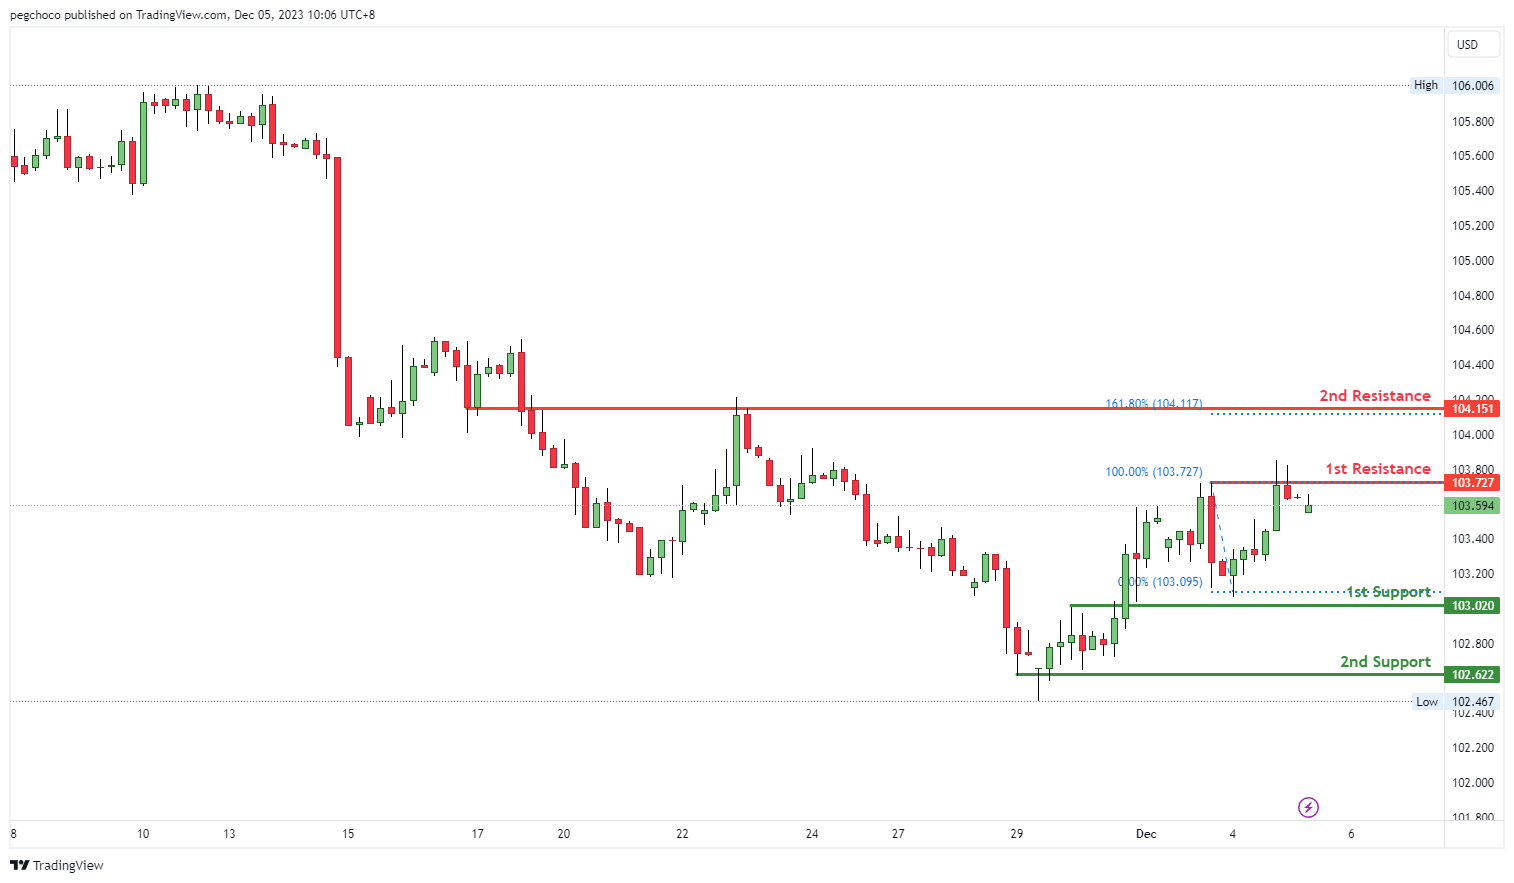
The DXY (US Dollar Index) chart currently has a bearish overall momentum. Price could potentially continue this bearish trend towards the 1st support at 103.02, which is identified as an overlap support. This level may act as a significant area where buying interest could emerge and potentially provide some support for the DXY.
If the bearish momentum continues, the 2nd support at 102.62, categorized as a multi-swing low support, may come into play as an additional level of potential support.
On the resistance side, the 1st resistance at 103.72 is noted as a multi-swing high resistance, indicating it as a significant barrier where selling interest may intensify, potentially limiting further upward movement. The 2nd resistance at 104.15 is categorized as an overlap resistance, adding to the potential resistance factors for the DXY.
EUR/USD:
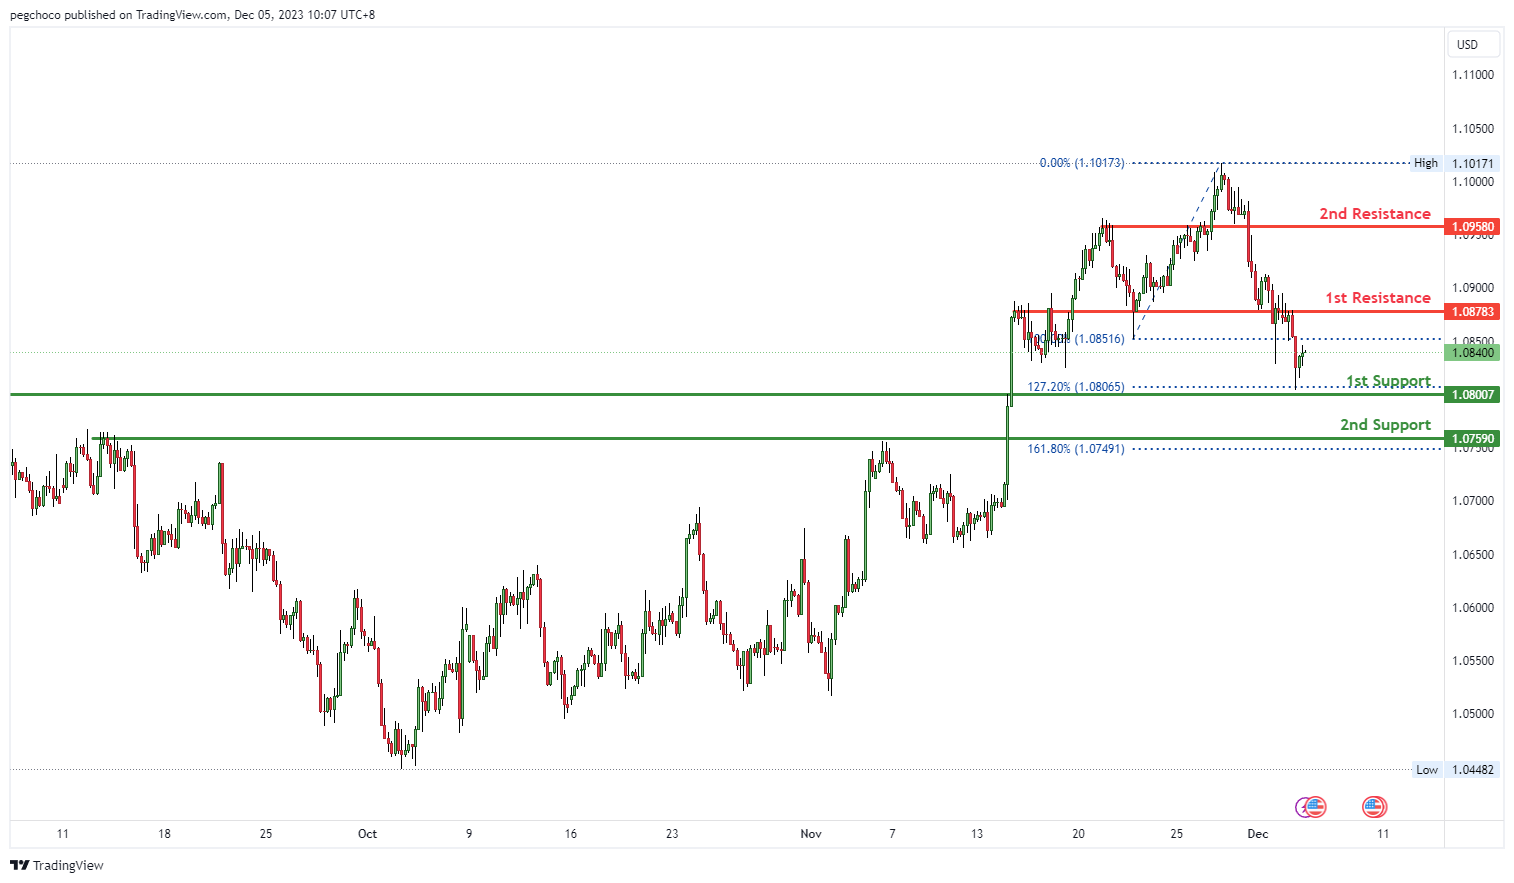
The EUR/USD chart currently exhibits a bullish overall momentum. Price could potentially experience a bullish bounce off the 1st support at 1.0800, which is identified as an overlap support with the added significance of a 127.20% Fibonacci Extension. This level may act as a strong support zone where buying interest could emerge, potentially propelling the currency pair higher.
If the bullish momentum continues, the 2nd support at 1.0759, categorized as a pullback support with the significance of a 161.80% Fibonacci Extension, may provide an additional level of support.
On the resistance side, the 1st resistance at 1.0878 is noted as an overlap resistance, indicating it as a significant barrier where selling interest may intensify, potentially limiting further upward movement. The 2nd resistance at 1.0958 is categorized as a pullback resistance, adding to the potential resistance factors for the EUR/USD.
EUR/JPY:
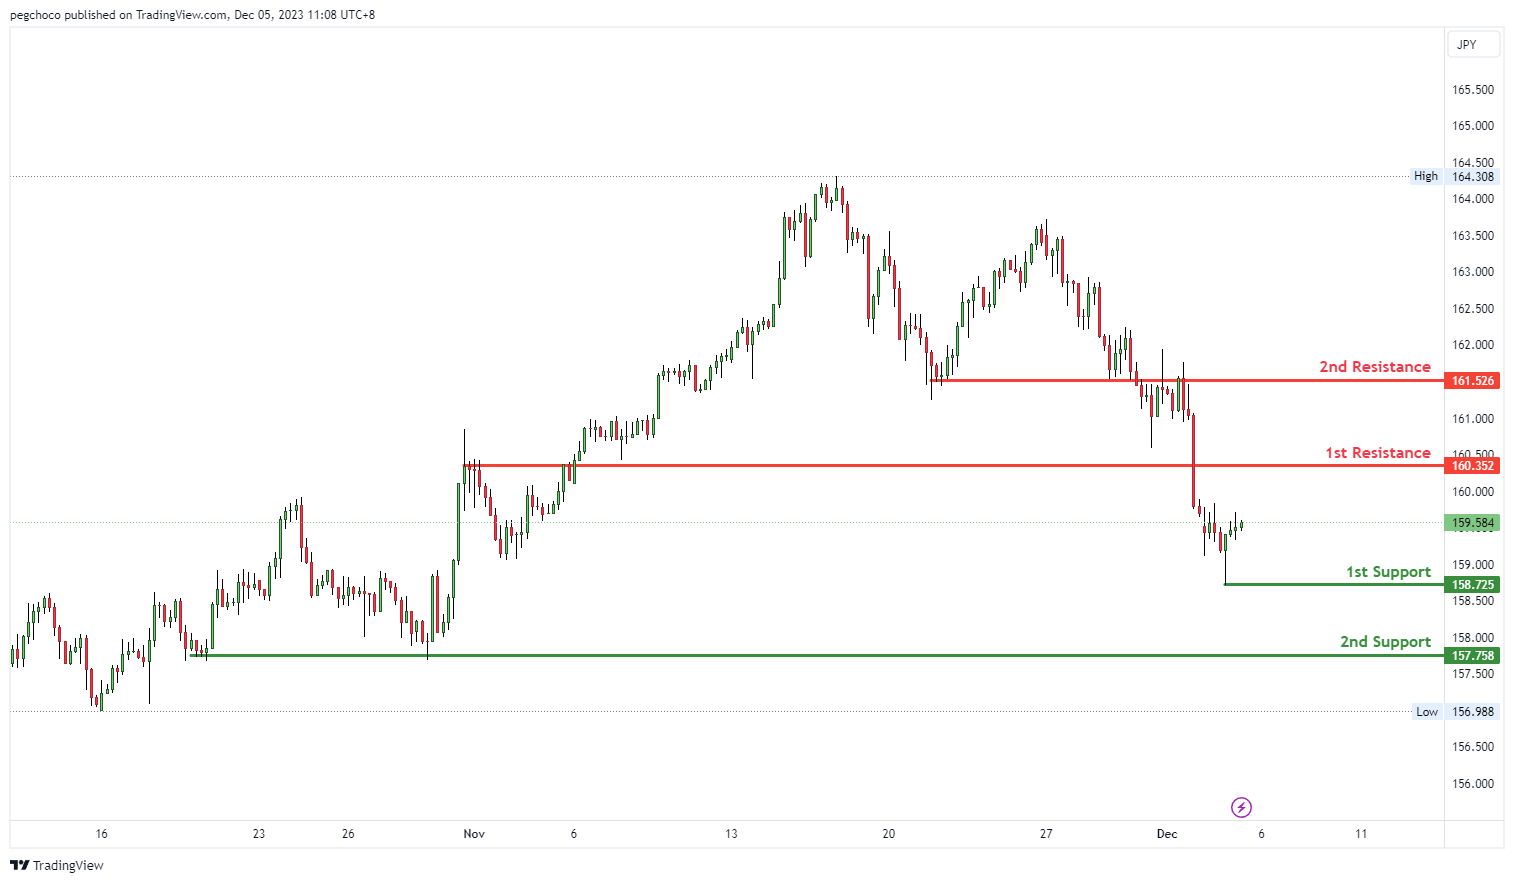
The EUR/JPY chart currently has a bearish overall momentum, and there’s a potential scenario in which the price could rise towards the 1st resistance in the short term before reversing and dropping towards the 1st support level.
1st support at 158.72: This level is identified as a swing low support, suggesting that it could be a significant area where buying interest may emerge, potentially providing support for EUR/JPY.
2nd support at 157.75: This support level is categorized as a multi-swing low support, indicating that it’s a level where buyers might become active.
On the resistance side, 1st resistance at 160.35: The 1st resistance is noted as a pullback resistance, suggesting that it’s a substantial barrier where selling interest could intensify, potentially triggering a reversal.
2nd resistance at 161.52: This is identified as an overlap resistance, indicating another level where selling pressure may increase.
.
EUR/GBP:
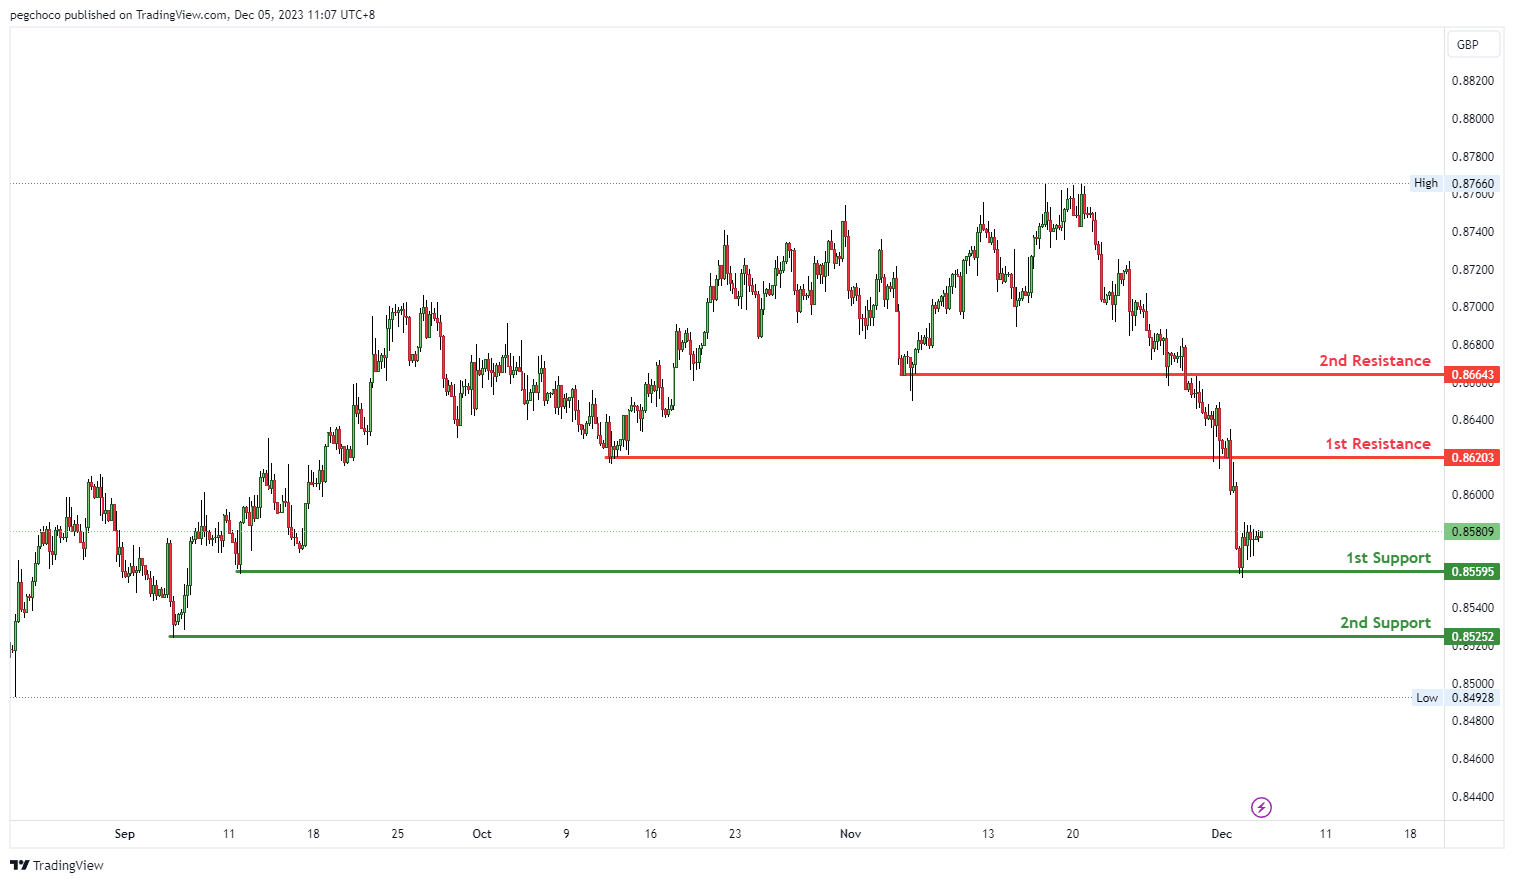
The EUR/GBP chart currently has a bearish overall momentum, and there’s a potential scenario in which the price could rise towards the 1st resistance in the short term before reversing and dropping towards the 1st support level.
1st support at 0.8559: This level is identified as a multi-swing low support, indicating that it could be a significant area where buying interest may emerge, potentially providing support for EUR/GBP.
2nd support at 0.8525: This support level is categorized as a swing low support, suggesting that it’s a level where buyers might become active.
On the resistance side, 1st resistance at 0.8620: The 1st resistance is noted as a pullback resistance, suggesting that it’s a substantial barrier where selling interest could intensify, potentially triggering a reversal.
2nd resistance at 0.8664: This is identified as an overlap resistance, indicating another level where selling pressure may increase.
GBP/USD:
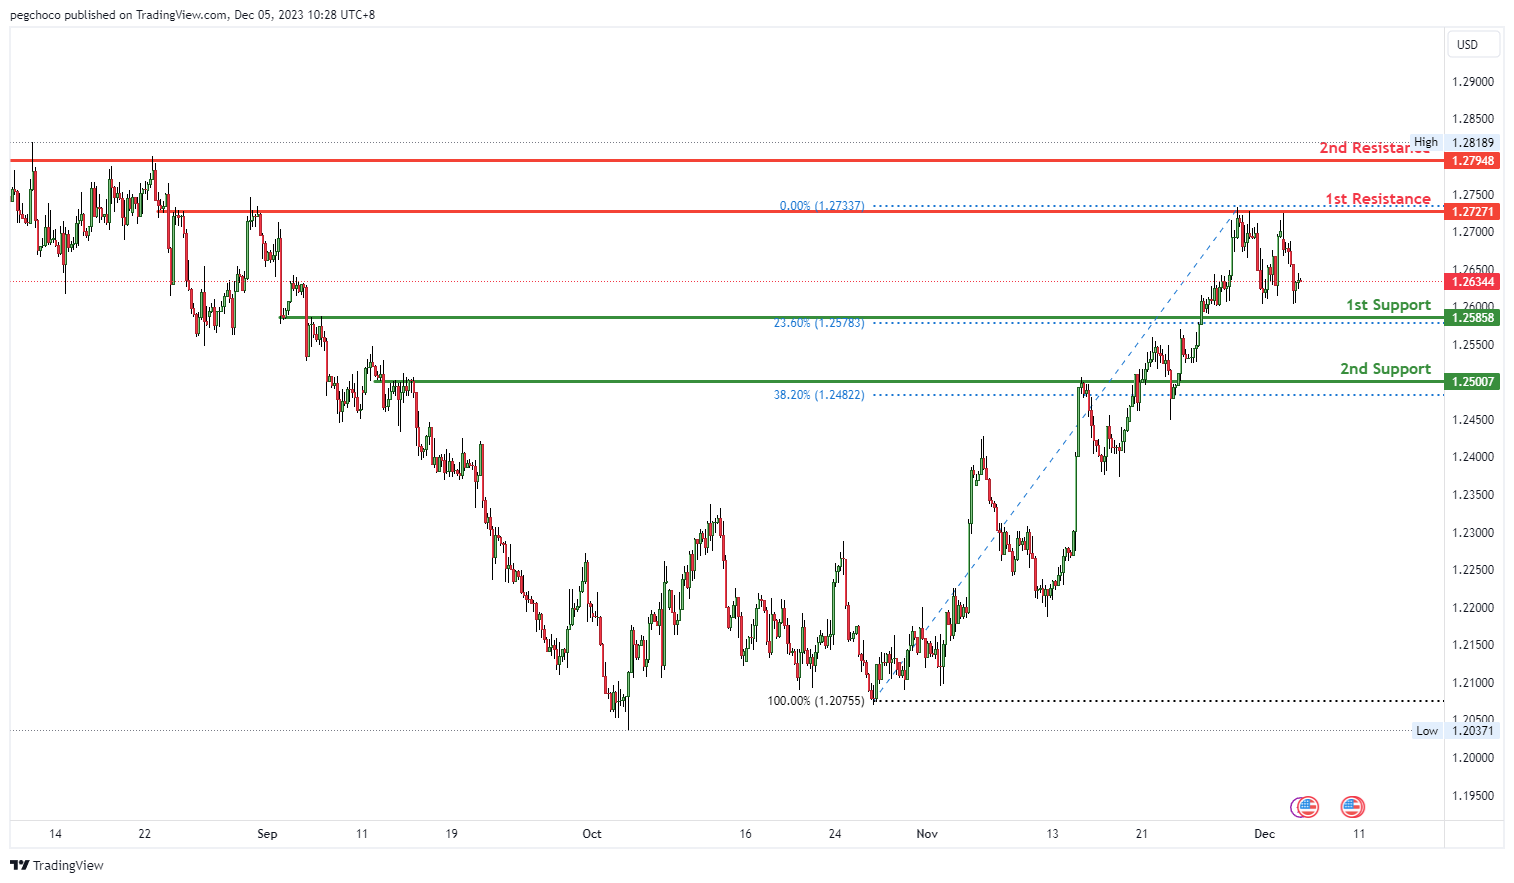
The GBP/USD chart currently has a bullish overall momentum. Price could potentially make a bullish bounce off the 1st support at 1.2585, which is identified as an overlap support and coincides with the 23.60% Fibonacci Retracement level. This support level may act as a strong zone where buying interest could emerge, potentially driving the currency pair higher.
If the bullish momentum continues, the 2nd support at 1.2500, categorized as a pullback support and associated with the 38.20% Fibonacci Retracement, may offer an additional level of support.
On the resistance side, the 1st resistance at 1.2727 is noted as an overlap resistance, indicating it as a significant barrier where selling interest may intensify. The 2nd resistance at 1.2794 is categorized as a multi-swing high resistance, further adding to potential resistance factors for the GBP/USD.
GBP/JPY:
The overall momentum of GBP/JPY is bearish. Price could potentially rise towards the 1st resistance in the short term before reversing off it and dropping towards the 1st support.
There could be a potential bullish move towards the 1st resistance, but traders should watch for signs of reversal or a failure to break above the 186.43 level. If the price fails to break above the 1st resistance, it could reverse and target the support levels.
1st support at 185.09: This level is a multi-swing low support, suggesting potential buying interest if the price approaches it.
2nd support at 184.21: This support level is based on a pullback and could provide additional buying interest if tested.
1st resistance at 186.43: This is the initial resistance level. It’s an overlap resistance and coincides with the 50% Fibonacci Retracement, making it a significant barrier for potential bullish moves.
2nd resistance at 186.43 – This is the initial resistance level. It’s an overlap resistance and coincides with the 50% Fibonacci Retracement, making it a significant barrier for potential bullish moves.

USD/CHF:
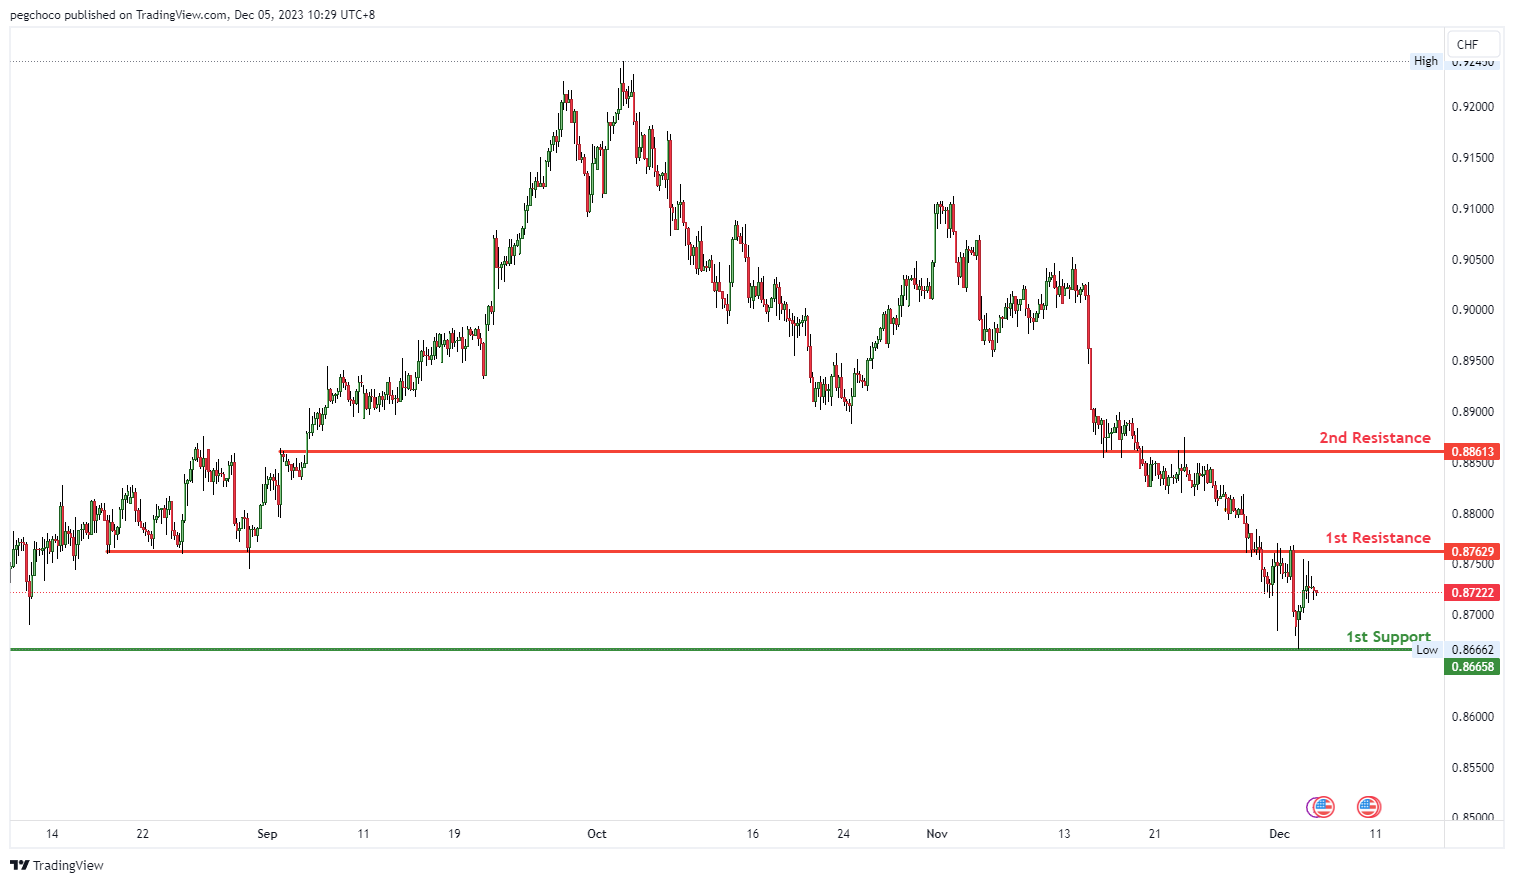
The USD/CHF chart currently has a bearish overall momentum, and price could potentially make a bearish continuation towards the 1st support at 0.8665. This support level is identified as a multi-swing low support, indicating that it has held as a significant level of buying interest in the past.
On the resistance side, the 1st resistance at 0.8762 is categorized as an overlap resistance, which suggests it could act as a substantial barrier where selling interest may intensify. The 2nd resistance at 0.8861 is also noted as an overlap resistance, further reinforcing the potential resistance factors for the USD/CHF.
USD/JPY:
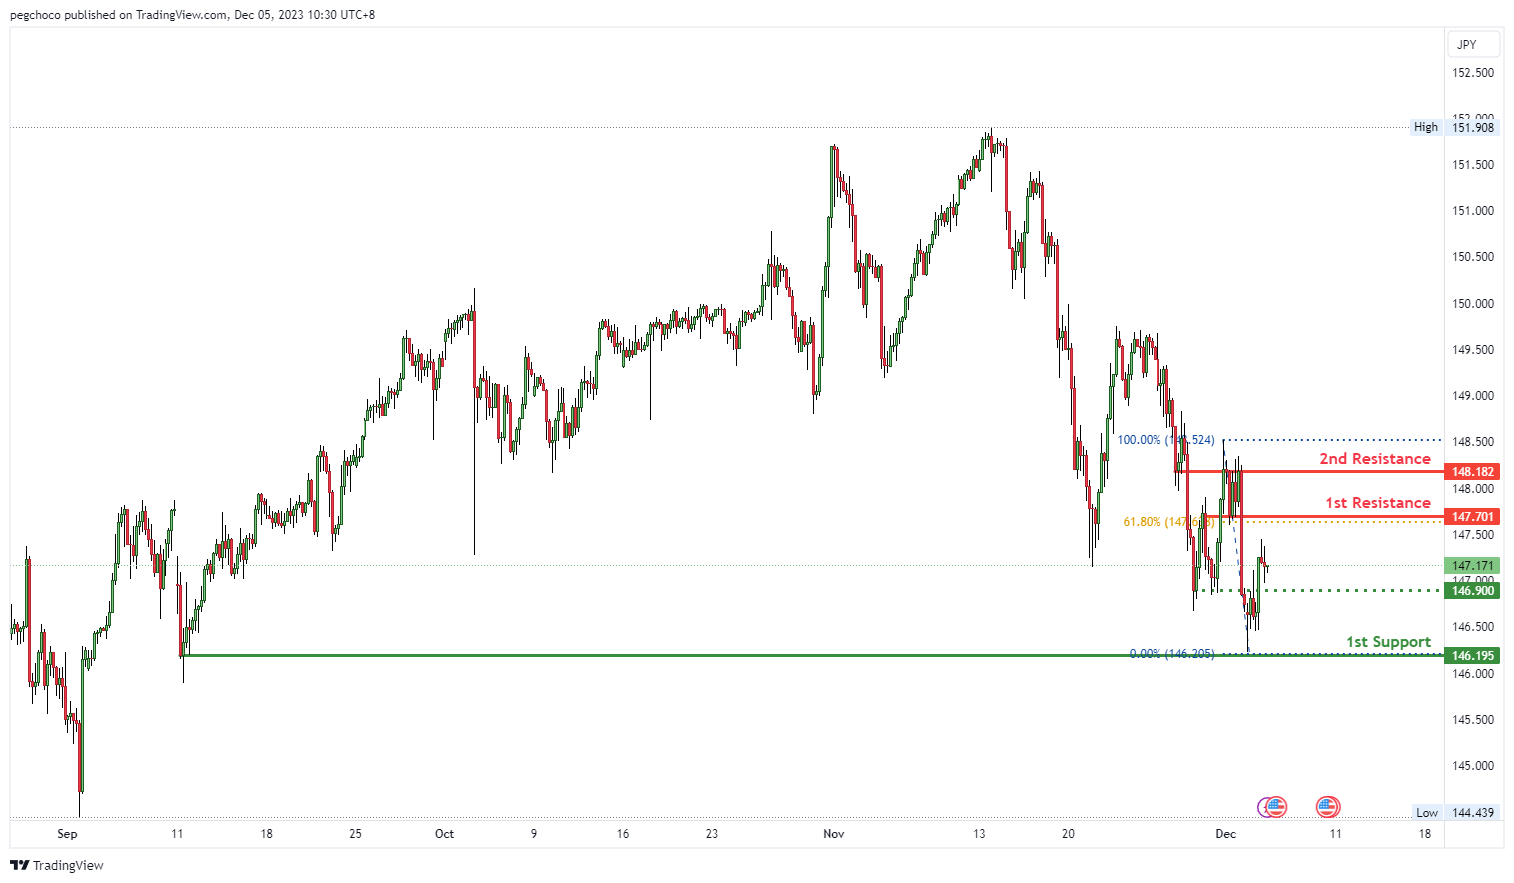
The USD/JPY chart currently has a bearish overall momentum, and price could potentially continue this bearish trend towards the 1st support at 146.19. This support level is identified as a swing low support, indicating its significance as a potential area where buying interest may emerge.
Additionally, there is an intermediate support at 146.90, categorized as an overlap support, which further reinforces its potential as a level where buyers might become active, potentially providing some support for USD/JPY.
On the resistance side, the 1st resistance at 147.70 is noted as a pullback resistance, and it also coincides with the 61.80% Fibonacci retracement level. This suggests it could act as a substantial barrier where selling interest may intensify. The 2nd resistance at 148.18 is categorized as an overlap resistance.
USD/CAD:
The USD/CAD chart currently exhibits a bearish overall momentum, and there is potential for a bearish reaction off the 1st resistance level, leading to a drop towards the 1st support.
The 1st support at 1.3521 is identified as an overlap support level, indicating it could be a significant level where buying interest may emerge.
Further down, there is a 2nd support at 1.3481, noted as a swing low support, which adds to its potential importance as another area where buyers might become active.
On the resistance side, the 1st resistance at 1.3571 is supported by the 61.80% Fibonacci Retracement level, suggesting it could act as a substantial barrier where selling interest may intensify. The 2nd resistance at 1.3622 is identified as a swing high resistance, reinforcing the potential resistance factors for USD/CAD.

AUD/USD:
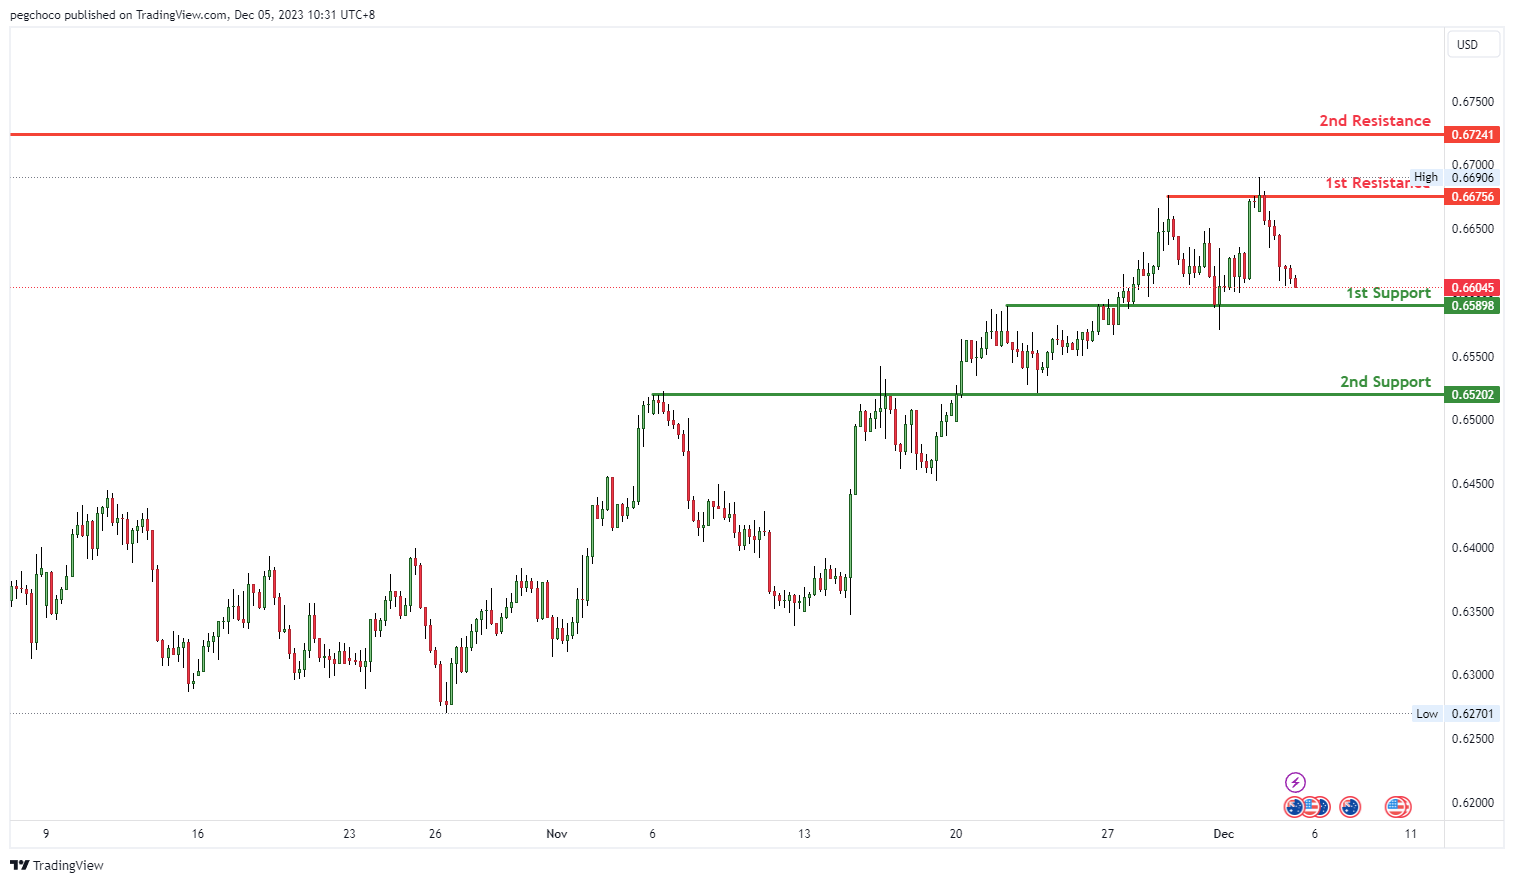
The AUD/USD chart currently exhibits a bearish overall momentum, and there is potential for a bearish continuation towards the 1st support level.
The 1st support at 0.6589 is identified as an overlap support, indicating it could be a significant level where buying interest may emerge.
Further down, there is a 2nd support at 0.6520, also noted as an overlap support level, which adds to its potential importance as another area where buyers might become active.
On the resistance side, the 1st resistance at 0.6675 is categorized as a multi-swing high resistance, suggesting it could act as a substantial barrier where selling interest may intensify. The 2nd resistance at 0.6724 is identified as a swing high resistance, reinforcing the potential resistance factors for AUD/USD.
NZD/USD
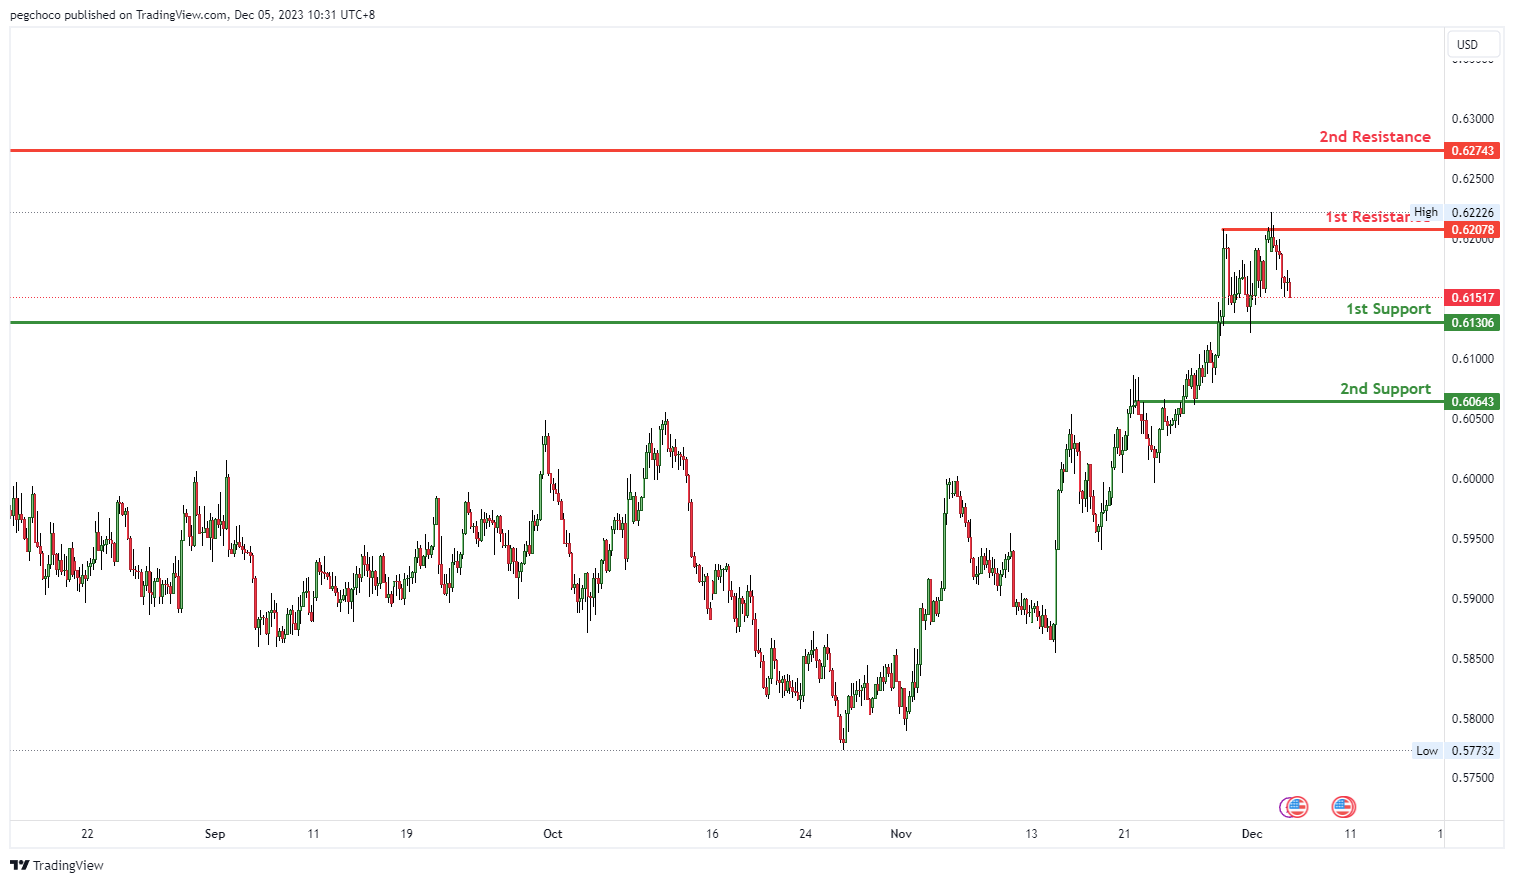
The NZD/USD chart currently exhibits a bearish overall momentum, and there is potential for a bearish continuation towards the 1st support level.
The 1st support at 0.6130 is considered significant as it aligns with an overlap support level, indicating it could serve as a strong level where buying interest might emerge.
Further down, there is a 2nd support at 0.6064, also identified as an overlap support level, adding to its potential importance as another area where buyers could become active.
On the resistance side, the 1st resistance at 0.6207 is categorized as a multi-swing high resistance, suggesting it could act as a substantial barrier where selling interest may intensify. The 2nd resistance at 0.6274 is noted as a swing high resistance, further reinforcing the potential resistance factors for NZD/USD.
DJ30:
The DJ30,the momentum of the chart is the overall momentum of the chart is weak bullish with low confidence. Price could potentially make a bullish continuation towards 1st resistance.
1st support at 35726.00: This level is a multi-swing low support, indicating that it has previously provided a base for the price. Traders may view this as a potential level for buying interest.
2nd support at 35058.06: This level represents an overlap support, which is formed when previous price action has clustered around a particular level. It could act as a support zone if the price approaches it.
1st resistance at 36299.99: This level is a swing high resistance, where the price has encountered selling pressure in the past. Traders may look for potential bullish breakouts or reversals around this level.
2nd resistance at 3699.07: This level aligns with the 127.2% fibonacci retracement level.

GER40:
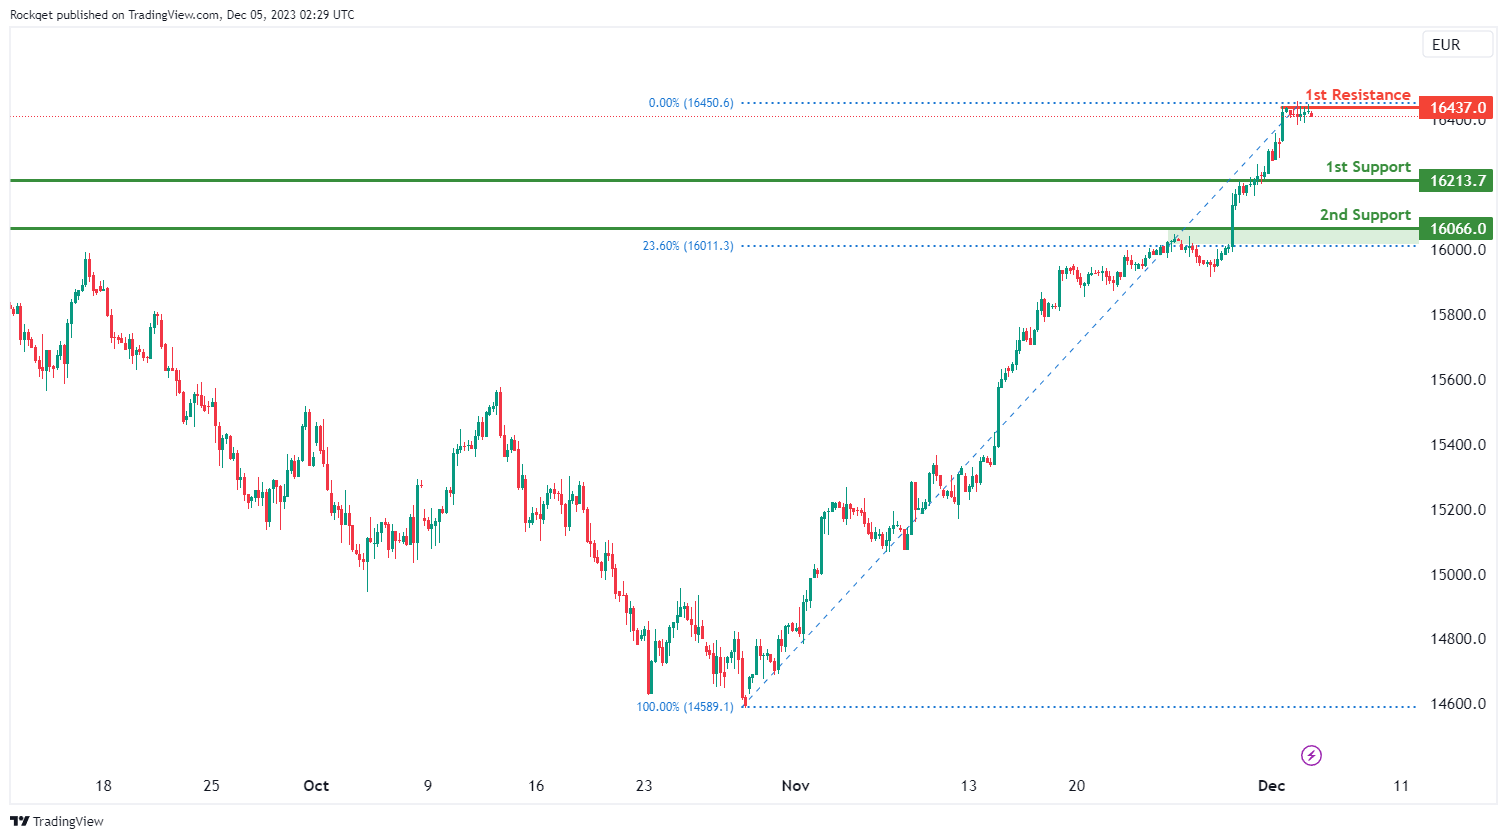
The GER40 overall momentum is the overall momentum of the chart is bearish. There is a potential bearish reaction off 1st resistance and drop to 1st support.
1st support at 16213.7: This level is a pullback support and has previously acted as a support level. It might attract buying interest if the price approaches it.
2nd support at 15523.4 (23.60% Fibonacci Retracement): Fibonacci retracement levels are often watched by traders as potential support or resistance areas. This level aligns with a key Fibonacci retracement, making it a significant support level.
1st resistance at 16437.0: This level is a swing high resistance. It’s an important level where the price has previously encountered selling pressure. Traders may look for potential reversals or bearish opportunities around this level.
`US500:
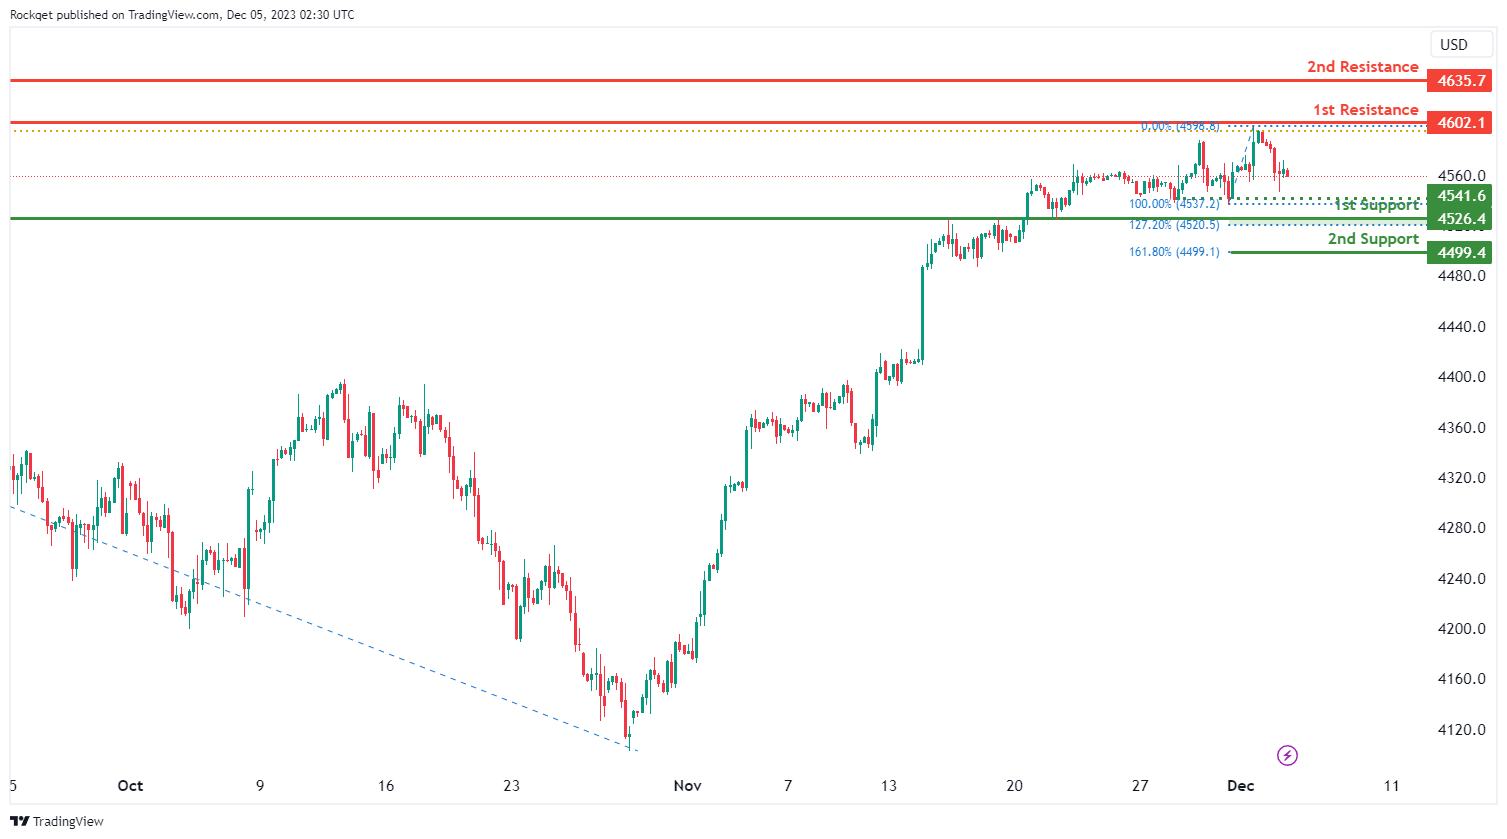
The overall momentum of US500 is the overall momentum of the chart is bearish. There is a possibility of a bearish continuation towards 1st support.
1st support at 4526.4: This level is a pullback support, which makes it a good candidate for a potential bounce. It has previously acted as a support level.
2nd support at 4499.4: This level corresponds to the 161.80% Fibonacci Extension. Fibonacci extensions are used to identify potential reversal or continuation levels. In this case, it provides an additional support level.
1st resistance at 4602.1: This level is a pullback resistance and coincides with the 61.80% Fibonacci Projection. It’s a significant resistance area where price may face selling pressure. A break above this level could signal a bullish reversal.
2nd resistance at 4635.7: This level represents a swing high resistance, which could act as a strong barrier for further upside. It’s another important level to watch for potential reversals.
BTC/USD:
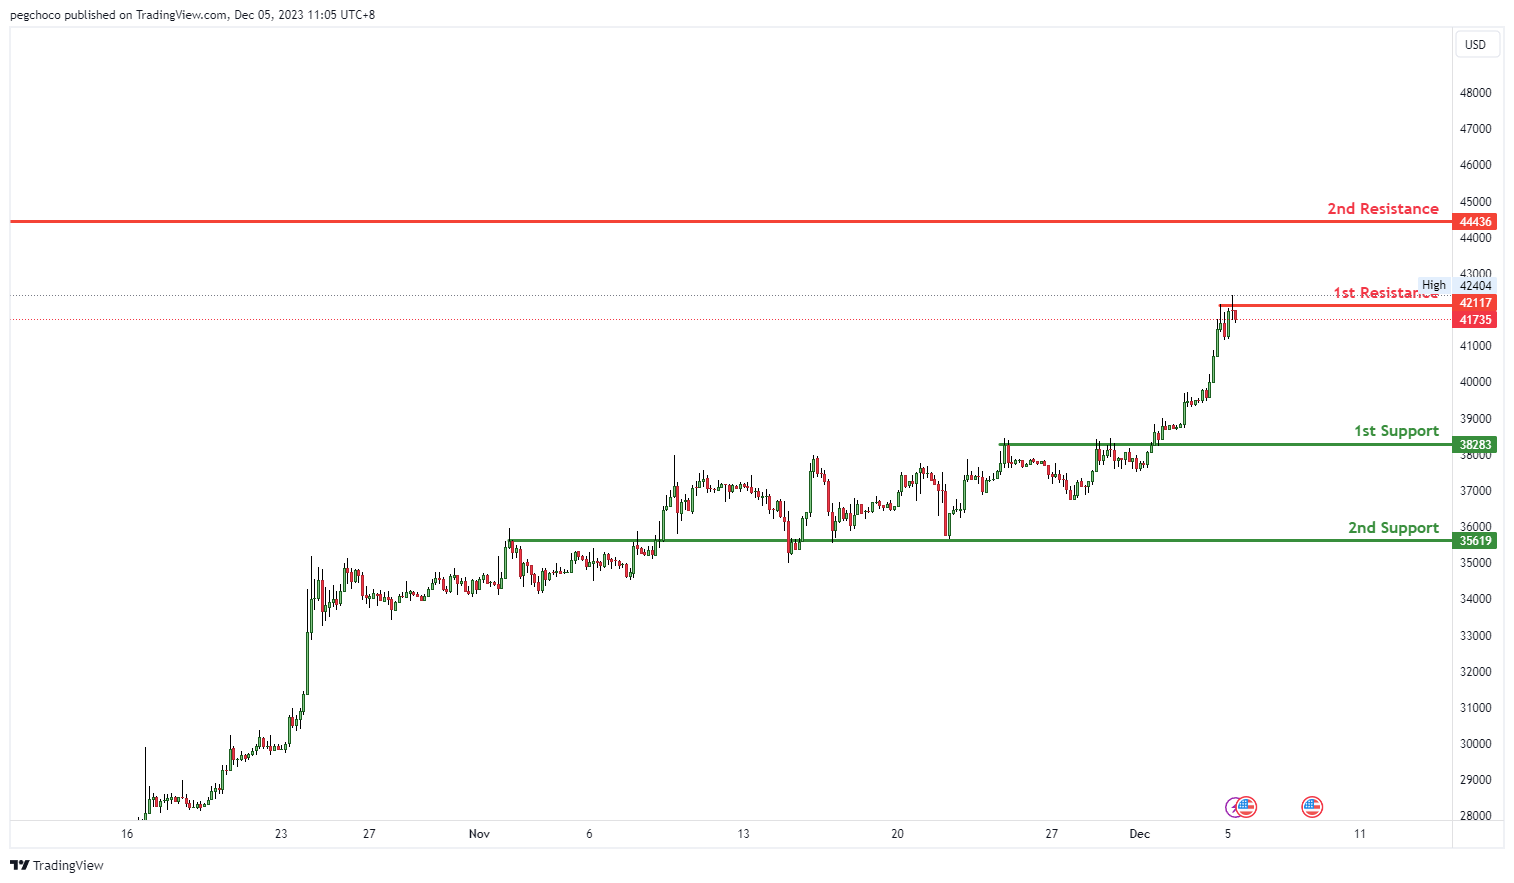
The BTC/USD chart currently has a bearish overall momentum, and there’s potential for a bearish continuation towards the 1st support level.
The 1st support at 38283 is categorized as an overlap support, indicating that it could be a significant level where buying interest may emerge, potentially providing support for the BTC/USD pair.
Further down, there is a 2nd support at 35619, also identified as an overlap support. This reinforces the significance of this support level, suggesting it as a potential area where buyers might become active.
On the resistance side, the 1st resistance at 41735 is noted as a swing high resistance. This implies that it’s a substantial barrier where selling interest could intensify, potentially triggering a bearish continuation.
The 2nd resistance at 44436 is identified as a pullback resistance, indicating another level where selling pressure may increase.
ETH/USD:
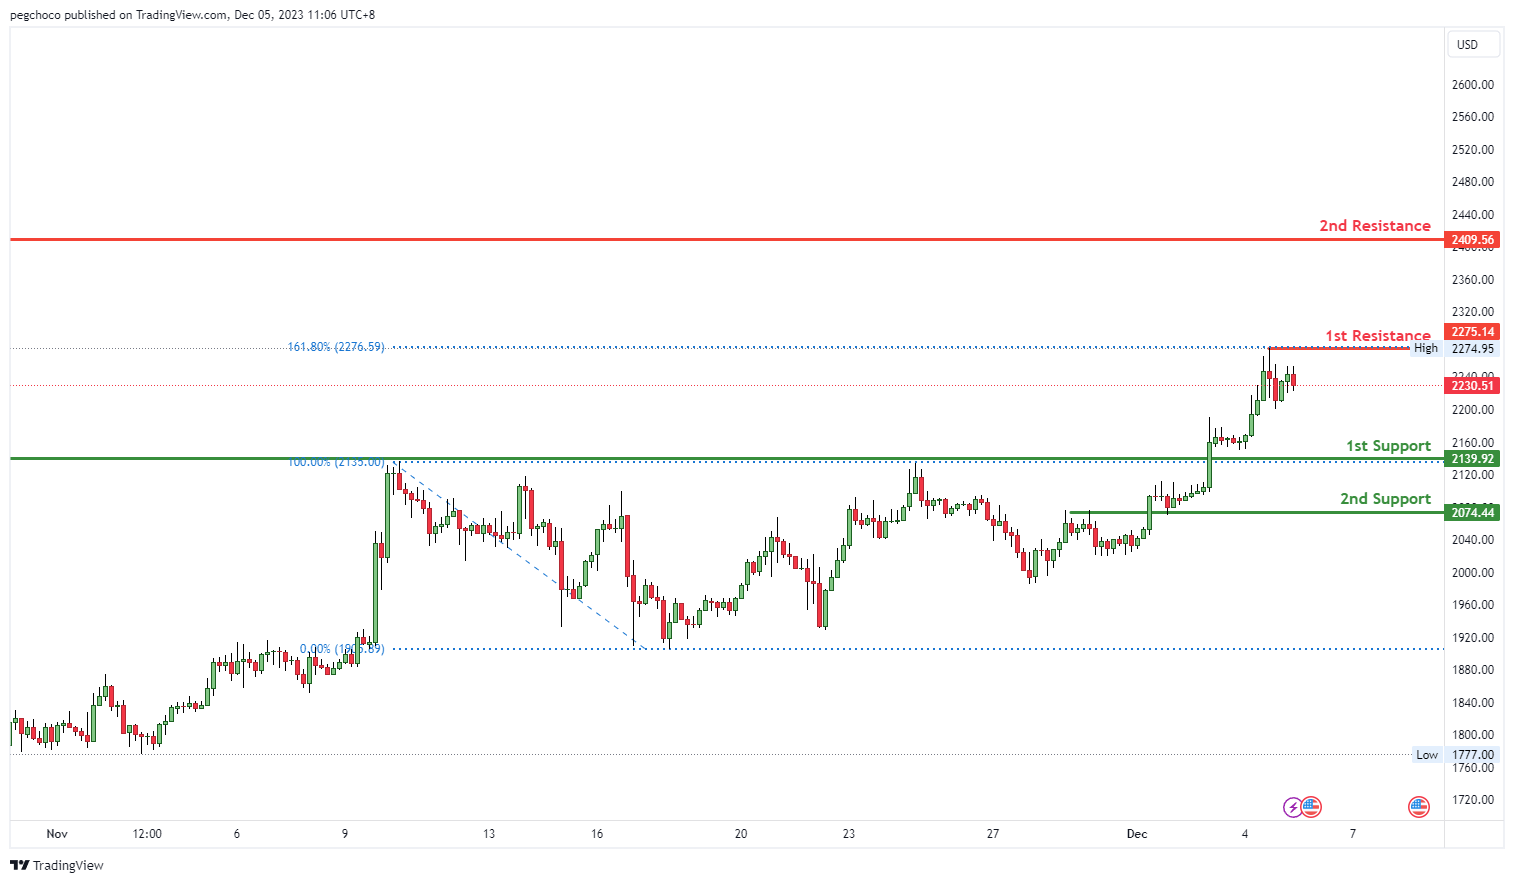
The ETH/USD chart currently has a bearish overall momentum, and there’s potential for a bearish continuation towards the 1st support level.
The 1st support at 2139.92 is categorized as a pullback support, indicating that it could be a significant level where buying interest may emerge, potentially providing support for the ETH/USD pair.
Further down, there is a 2nd support at 2074.44, identified as an overlap support. This adds to the significance of this support level, indicating it as a potential area where buyers might become active.
On the resistance side, the 1st resistance at 2275.14 is noted as a swing high resistance. This suggests that it’s a substantial barrier where selling interest could intensify, potentially triggering a bearish continuation.
The 2nd resistance at 2409.56 is identified as a multi-swing high resistance, reinforcing the potential resistance factors for ETH/USD.
WTI/USD:
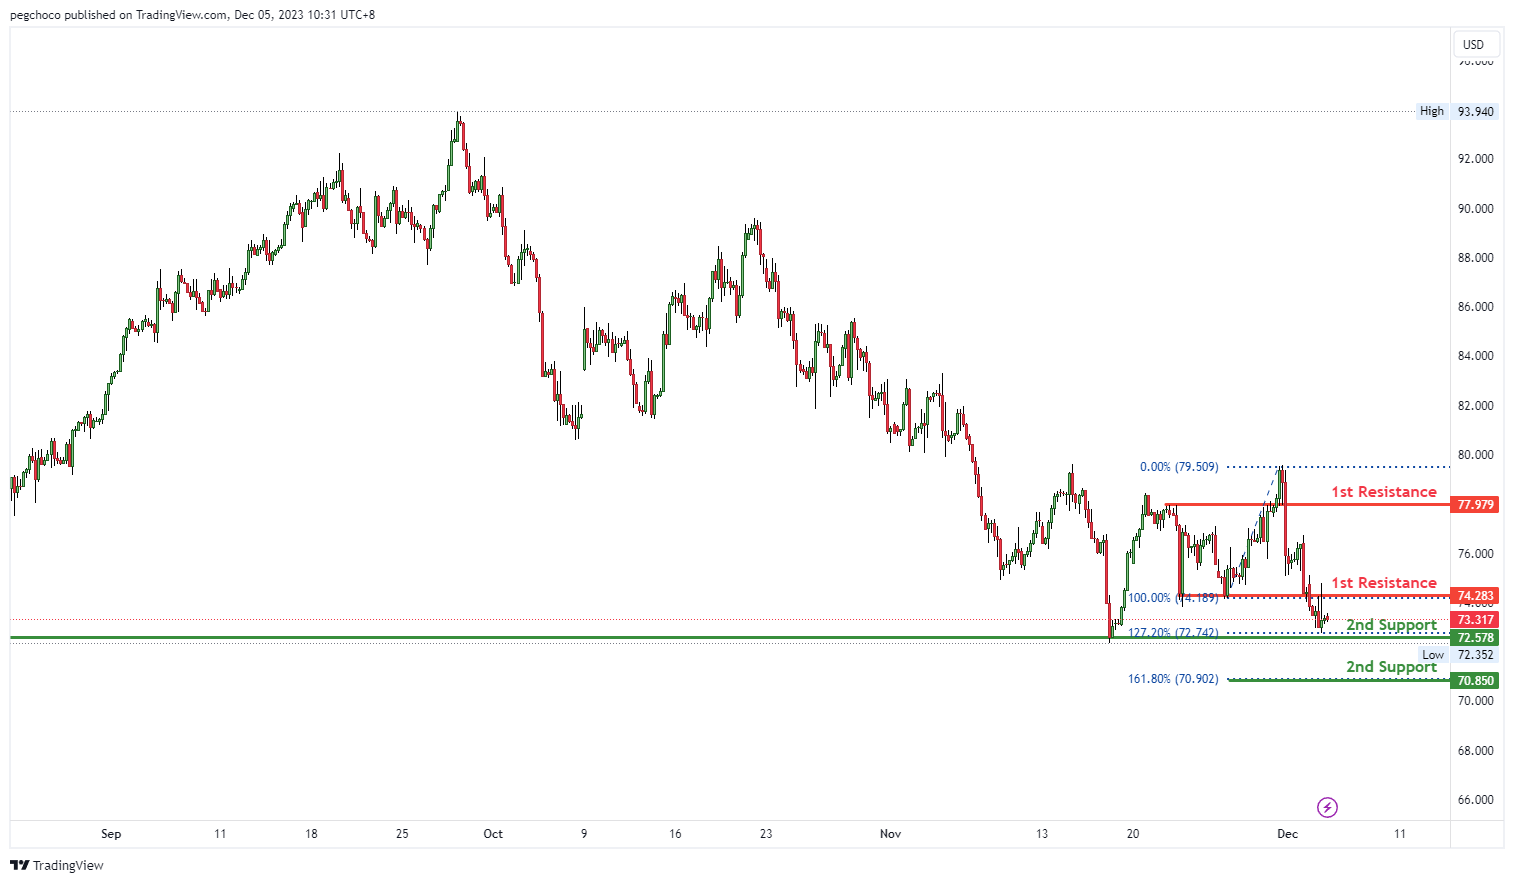
The WTI chart currently shows a bearish overall momentum, and it could potentially continue this bearish trend by breaking below the 1st support and heading towards the 2nd support.
The 1st support at 72.57 is considered significant as it aligns with a multi-swing low support level and coincides with the 127.20% Fibonacci extension level, adding to its importance as a potential area where buying interest may emerge.
Further down, there is a 2nd support at 70.85, which is also identified as a support level and corresponds with the 161.80% Fibonacci extension level, emphasizing its potential significance as another level where buyers might become active.
On the resistance side, the 1st resistance at 74.28 is categorized as an overlap resistance, suggesting it could act as a substantial barrier where selling interest may intensify. The 2nd resistance at 77.97 is noted as a pullback resistance, further reinforcing potential resistance factors for WTI.
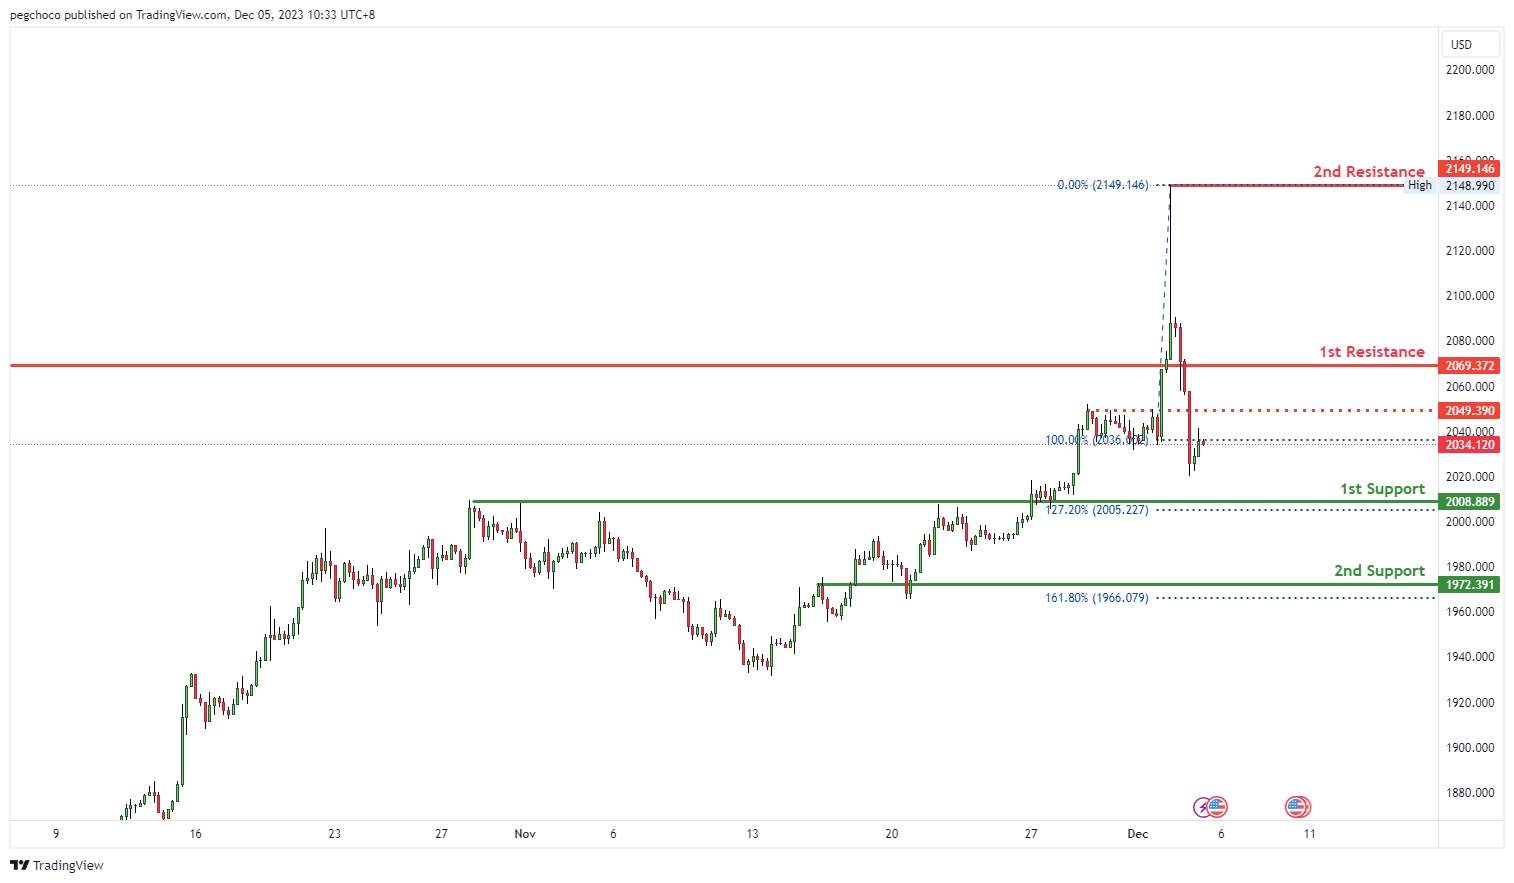
XAU/USD (GOLD):
The XAU/USD (Gold) chart currently exhibits a bearish overall momentum, and it could potentially continue this bearish trend towards the 1st support at 2008.88. This support level is categorized as a pullback support and coincides with the 127.20% Fibonacci extension level, adding to its significance as a potential area where buying interest may emerge.
Further down, there is a 2nd support at 1972.39, which is also identified as a pullback support and aligns with the 161.80% Fibonacci extension level, emphasizing its potential importance as a level where buyers might become active.
On the resistance side, the 1st resistance at 2069.37 is categorized as a pullback resistance, indicating it could act as a substantial barrier where selling interest may intensify. The 2nd resistance at 2149.14 is noted as a swing high resistance, further reinforcing potential resistance factors for XAU/USD.
.
The accuracy, completeness and timeliness of the information contained on this site cannot be guaranteed. IC Markets does not warranty, guarantee or make any representations, or assume any liability regarding financial results based on the use of the information in the site.
News, views, opinions, recommendations and other information obtained from sources outside of www.icmarkets.com, used in this site are believed to be reliable, but we cannot guarantee their accuracy or completeness. All such information is subject to change at any time without notice. IC Markets assumes no responsibility for the content of any linked site.
The fact that such links may exist does not indicate approval or endorsement of any material contained on any linked site. IC Markets is not liable for any harm caused by the transmission, through accessing the services or information on this site, of a computer virus, or other computer code or programming device that might be used to access, delete, damage, disable, disrupt or otherwise impede in any manner, the operation of the site or of any user’s software, hardware, data or property.


