
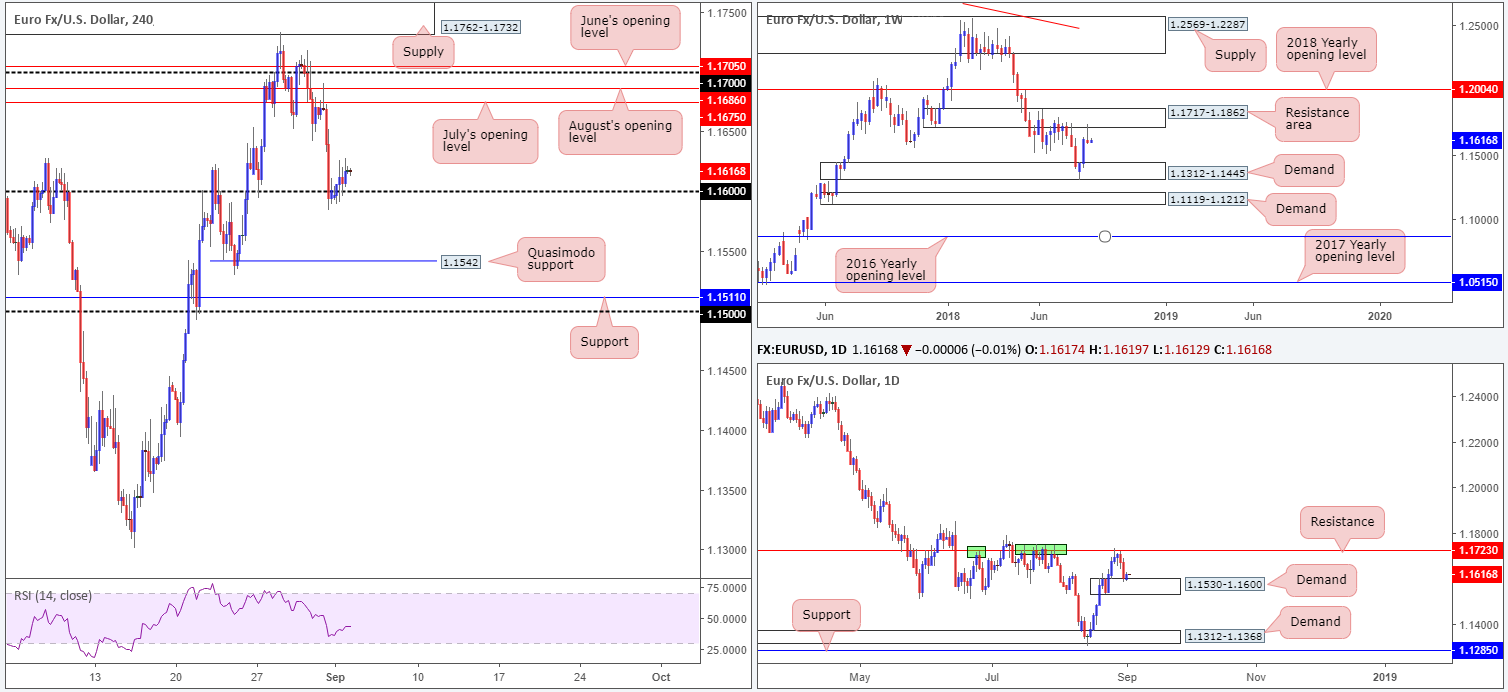
EUR/USD:
The EUR/USD employed more of a sober tone on Monday, thanks largely to US banks closing its doors in observance of Labor Day.
Despite Friday’s action reclaiming the 1.16 handle to the downside, sellers were incapable of defending the underside of this number as resistance on Monday. The H4 candles, as you can see, used 1.16 as support amid London hours and clocked a daily high of 1.1627 going into US trade.
On the weekly timeframe, the shared currency shook hands with the underside of a resistance area at 1.1717-1.1862 last week by way of a tasty-looking bearish pin-bar formation. This – coupled with room seen for the pair to stretch as far south as demand coming in at 1.1312-1.1445 – could draw in candlestick traders this week.
Daily demand at 1.1530-1.1600, however, elbowed its way into the spotlight on Friday, following a selloff from nearby resistance plotted at 1.1732 (positioned within the lower limits of the aforementioned weekly resistance area). Outside of this demand, the next area of interest can be seen around demand penciled in at 1.1312-1.1368.
Areas of consideration:
In view of the support formed off 1.16, traders may attempt to build on this today, targeting July’s opening level at 1.1675. The problem here is 1.16 offers limited H4 confluence, along with the market’s contradictory higher-timeframe position (daily demand at 1.1530-1.1600 is supportive of buying, though weekly price suggests further selling could be on the cards). To help avoid taking an unnecessary loss from 1.16, traders are urged to consider waiting and seeing if price can form a full or near-full-bodied H4 bull candle before pulling the trigger. Not only will this display bullish intent, it’ll provide one an entry (at the close of the candle) and a stop-loss location (around the underside of the candle’s tail).
Today’s data points: US ISM manufacturing PMI.
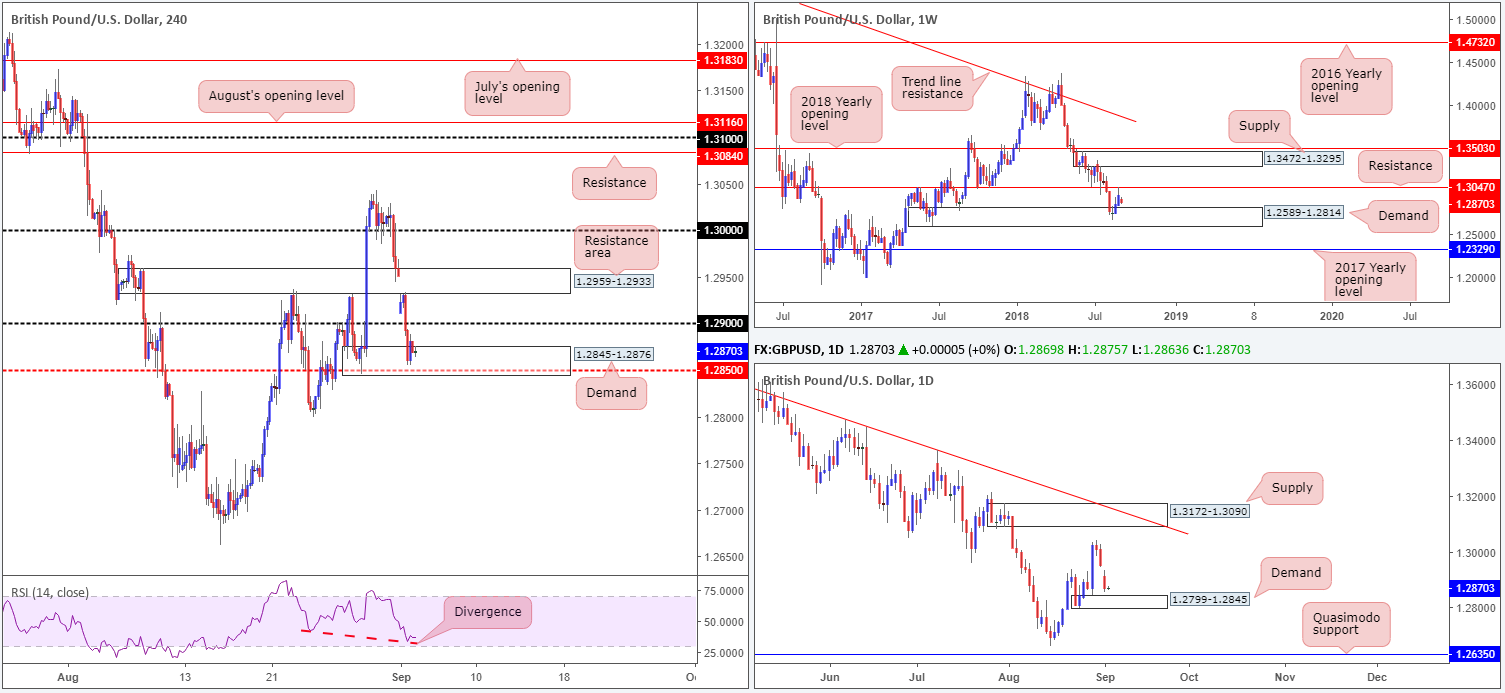
GBP/USD:
Sterling, once again, traded on the back foot on Monday amid Brexit headline risk. UK’s PM May ruled out a second Brexit referendum, while elsewhere, Tory rebels are planning to derail May’s ‘Chequers plan’. EU Chief Negotiator Barnier also spoke against UK PM May’s plans on the relationship post-Brexit.
On the technical front, the 1.29 handle seen on the H4 timeframe gave way and opened the gate for a test of nearby demand plotted at 1.2845-1.2876. Notable features here are the strong bullish momentum derived from its base and mid-level support at 1.2850 seen within its lower limits, as well as the RSI indicator displaying a divergence reading.
On a wider perspective, however, weekly price appears poised to challenge a nearby demand base coming in at 1.2589-1.2814, after coming within an ant’s hair of testing resistance at 1.3047 last week. Glued to the top edge of the aforementioned weekly demand, nevertheless, is a daily demand base seen at 1.2799-1.2845. This, assuming sellers remain in the driving seat, is the next area on the hit list.
Areas of consideration:
Seen positioned around the top edge of daily demand at 1.2799-1.2845, along with reasonably strong H4 confluence, the current H4 demand at 1.2845-1.2876 may well hold its ground today and offer traders an opportunity to buy this market. The only grumble is the 1.29 handle may hinder upside, as well as limited space seen to maneuver above this number owing to a H4 resistance area seen plotted at 1.2959-1.2933.
Considering the nearby resistances positioned directly above the current H4 demand, entering long is somewhat difficult. For that reason, traders may want to consider passing on this zone.
Today’s data points: UK construction PMI; UK inflation report hearings; US ISM manufacturing PMI.
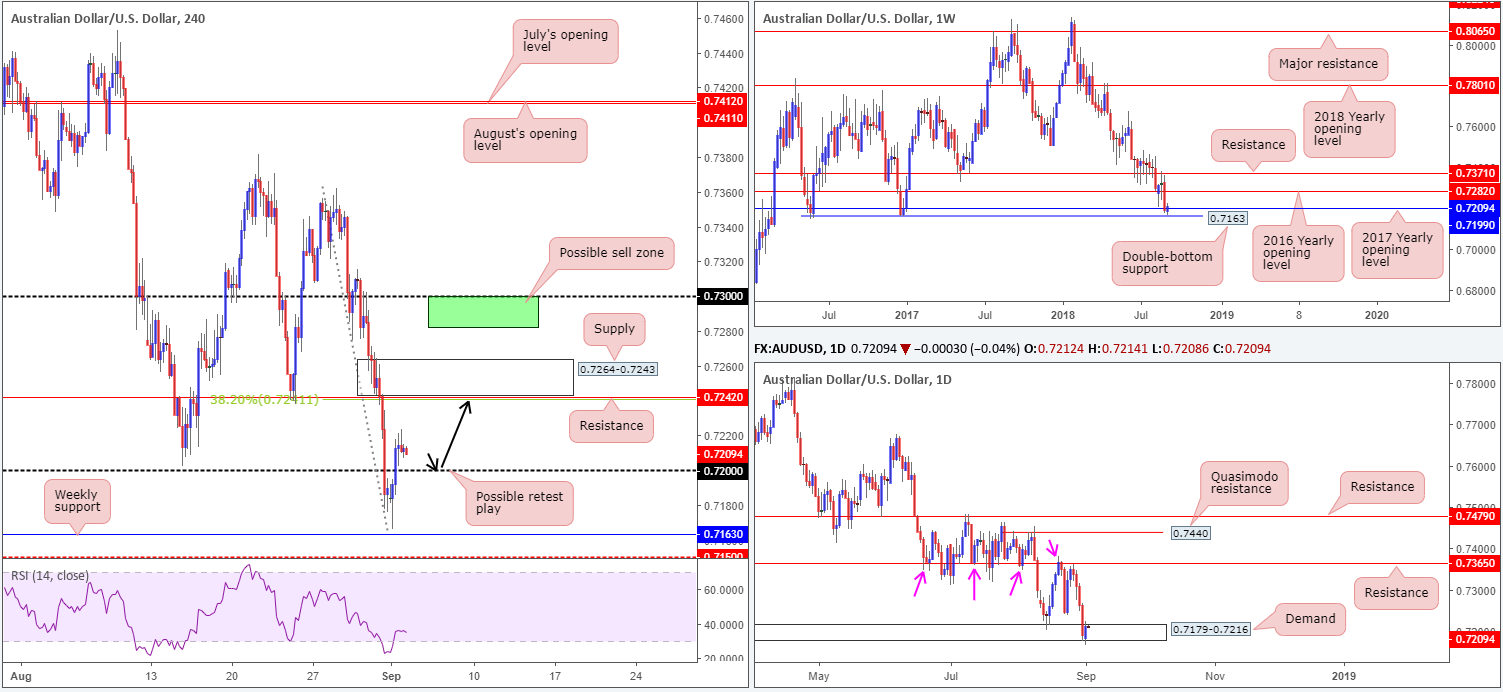
AUD/USD:
In recent sessions, the commodity currency crossed swords with levels not seen since December 2016 at 0.7166 on a disappointing Australian retail sales print. Despite this, the pair swiftly recovered its losses and reclaimed 0.72 status as focus turns to the RBA meeting. Recent upside could have something to do with the fact weekly price connected with the 2017 yearly opening level at 0.7199, which, as you can see, is shadowed closely by a double-bottom support formation at 0.7163. Also worth noting on the higher-timeframe picture is daily demand at 0.7179-0.7216 held firm, in spite of a marginal breach to the lower edge of its area.
Upside targets to be aware of on the H4 scale this morning fall in at a resistance level drawn from 0.7242, which happens to fuse with a 38.2% Fib resistance value at 0.7241 and a nearby supply zone at 0.7264-0.7243. Beyond here the 0.73 handle appears inviting, though weekly price shows resistance plotted just ahead of this number at 0.7282: the 2016 yearly opening level.
Areas of consideration:
In light of where we are positioned on the bigger picture right now, a retest play off of the 0.72 base could be an option for intraday players today, targeting 0.7242ish as the initial upside target.
In terms of selling opportunities, although the H4 resistance at 0.7242 will likely produce a bounce lower, attention is possibly focused more towards the 0.73 region. This is simply because if merges closely with a weekly resistance level mentioned above at 0.7282 (green area marked on the H4 timeframe).
Today’s data points: AUD current account; RBA rate statement and cash rate decision; RBA Gov. Lowe speaks; US ISM manufacturing PMI.
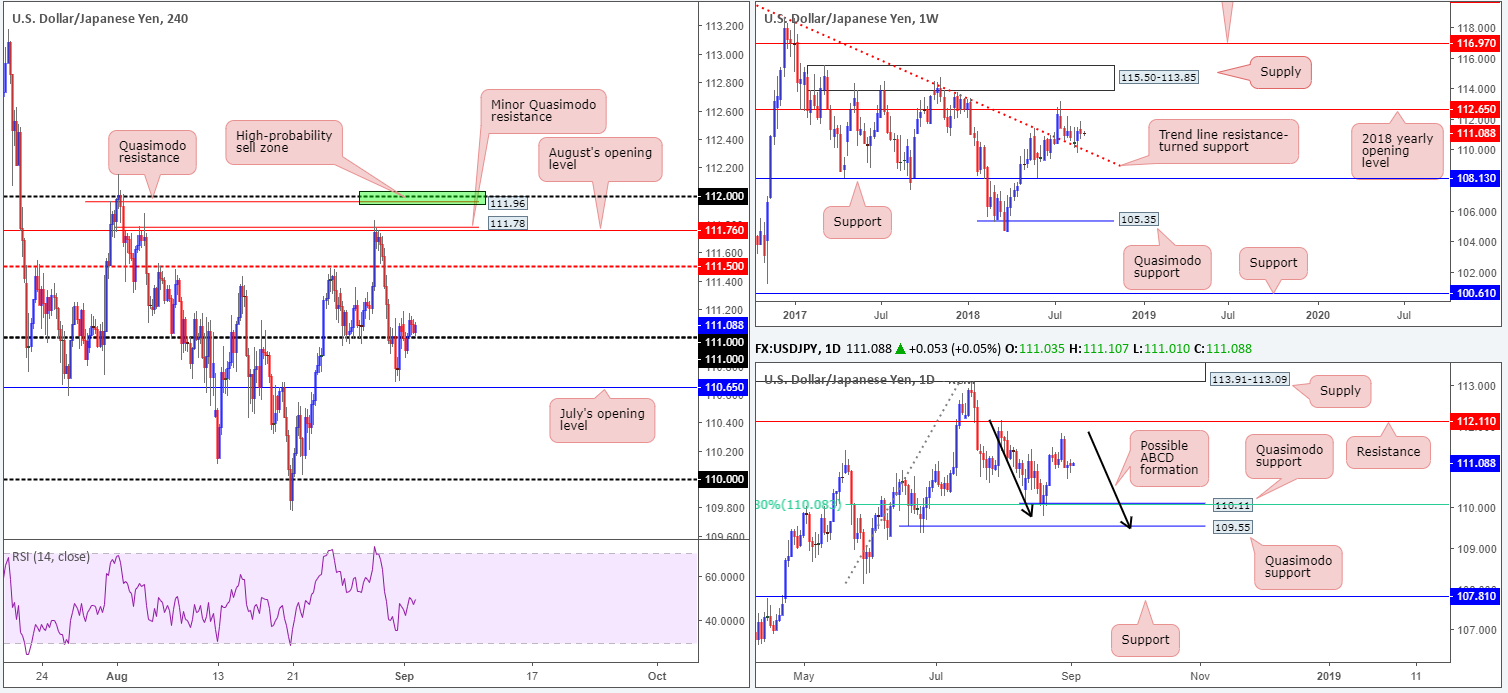
USD/JPY:
Trade was relatively thin during yesterday’s sessions due to US banks closing its doors in observance of Labor Day. As of current price, the H4 candles remain supportive off the 111 handle, despite a modest dip to lows of 110.85 on Monday. Assuming traders remain bullish above 111 today, the mid-level resistance at 111.50 is likely the next base on the hit list.
Weekly movement, as you can see, strongly retested a trend line resistance-turned support (taken from the high 123.57) two weeks back, though failed to generate much upside presence last week. Having seen this line hold firm as resistance on a number of occasions in the past, however, it’s likely to remain a defensive barrier going forward. Further buying from current price has the 2018 yearly opening level at 112.65 to target
Structure on the daily timeframe to be cognizant of this week falls in at a resistance level drawn from 112.11, and two layers of Quasimodo support: 109.55 and 110.11. Note 110.11 converges with a 61.8% Fib support value at 110.08, and 109.55 fuses with a possible ABCD completion point around 109.49 (black arrows).
Areas of consideration:
For those who favor break/retest plays around psychological levels, buying off 111 could be an option today, targeting 111.50 as the initial upside target.
August’s opening level at 111.76 seen on the H4 timeframe is likely of interest to traders this week for potential shorts, given it fuses with a minor H4 Quasimodo resistance at 111.78. What’s also attractive for shorts, and possibly the higher-probability setup, is the H4 Quasimodo resistance seen at 111.96. Aside from this level merging closely with the 112 handle, the apex (112.15) of the Quasimodo formation is bolstered by the daily resistance level mentioned above at 112.11 (stop-loss orders, therefore, can be positioned above the Quasimodo apex at around 112.17ish).
Today’s data points: US ISM manufacturing PMI.
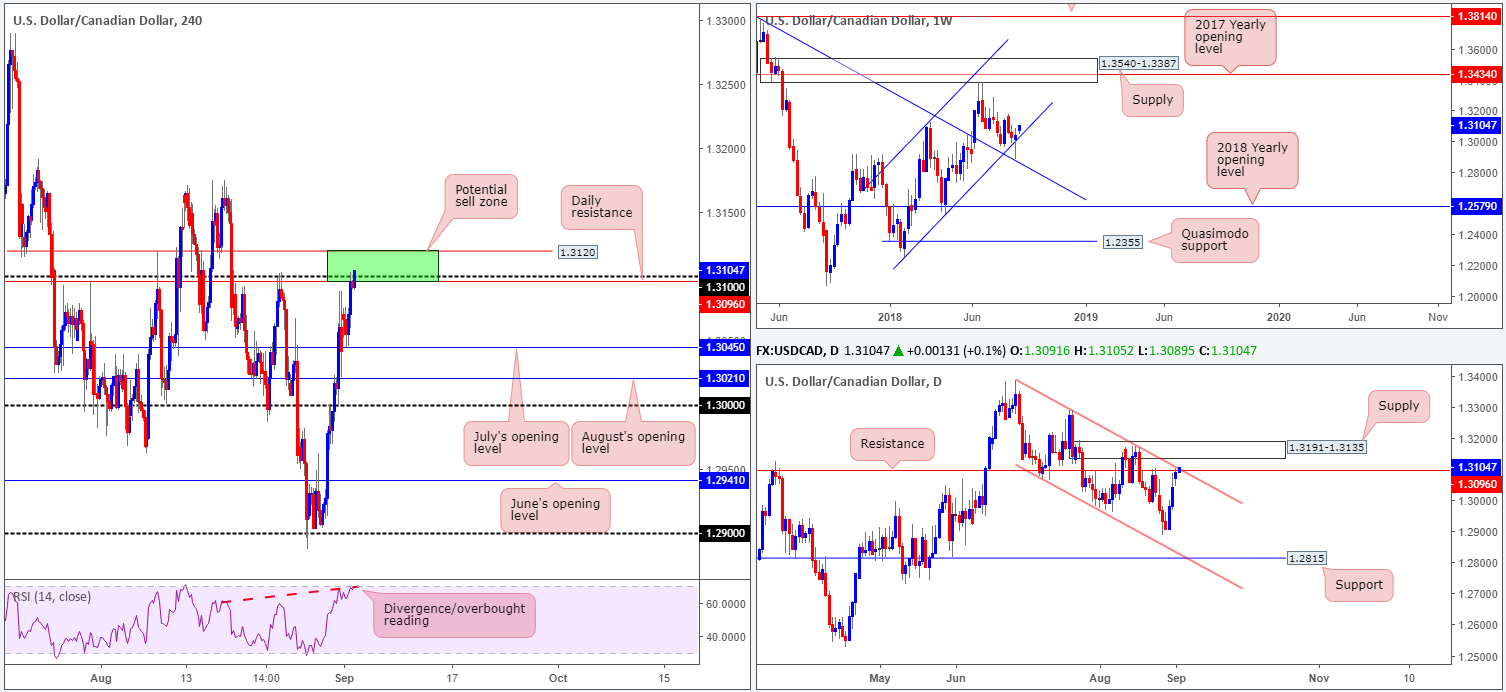
USD/CAD:
The markets observed a reasonable flurry of buying take shape on Monday, despite both US and Canadian banks shutting their doors in observance of Labor Day.
Coming in from the top this morning, we can clearly see the USD/CAD has been compressing within an ascending channel formation (1.2247/1.3098). It was only last week traders witnessed a notable breach to the lower edge of this channel, breaking to lows of 1.2887. Thanks to a strong recovery just ahead of a nearby trend line resistance-turned support (etched from the high 1.4689), however, the channel remains intact.
Turning our attention to the daily timeframe, the unit has been grinding lower within a descending channel formation (1.3386/1.3066) since late June. Resistance at 1.3096, as is shown on the chart, is currently in play. This level is particularly interesting given it fuses closely with the channel resistance.
Across on the H4 timeframe, price is seen testing a potential sell zone marked in green at 1.3120/1.3096 (comprised of a H4 resistance level at 1.3120, the 1.31 handle and a daily resistance at 1.3096). Knowing we also have the RSI showing an overbought/divergence reading and a daily channel resistance level intersecting with this area, a move lower could be in the offing today.
Areas of consideration:
Having seen weekly price defend its channel support, traders are urged to consider waiting for additional candle confirmation before shorting the green H4 sell zone mentioned above at 1.3120/1.3096. A H4 full or near-full-bodied bearish candle (stop-loss orders can be positioned above the rejecting candle’s wick) printed within this H4 zone would, according to the overall technical picture, be considered a strong sell signal, with an initial downside target seen at 1.3045: July’s opening level on the H4 timeframe.
Today’s data points: US ISM manufacturing PMI.
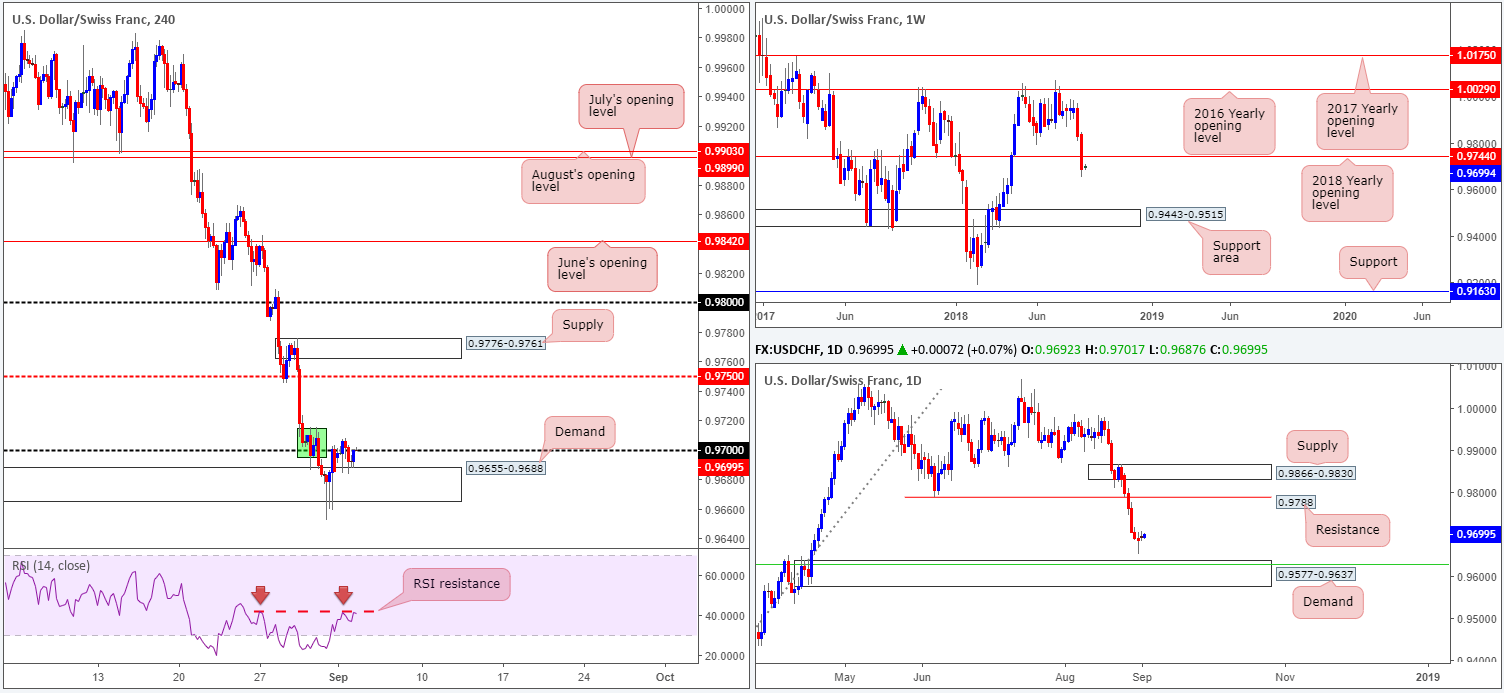
USD/CHF:
With US banks closed in observance of Labor Day, USD/CHF movement on Monday was somewhat subdued. The H4 candles spent the day trading off the top edge of demand at 0.9655-0.9688, despite having its lower edge taken out on Friday. For the time being, the 0.97 handle is struggling to gain presence with price action appearing capped by nearby supply painted in green at 0.9715-0.9694. Also worth noting on the H4 scale is the RSI is currently seen trading off resistance around the 41.87ish mark.
Looking over at the bigger picture, you’ll immediately see weekly price trading beneath the 2018 yearly opening level at 0.9744. In view of last week’s decisive close below this number, this market could be in for additional selling in the near future, targeting as far south as the support area coming in at 0.9443-0.9515. Before further selling is seen, though, traders need to be prepared for the possibility of a retest play off the recently broken 2018 yearly level as resistance.
Before weekly price can drag the unit lower, however, traders will need to contend with a tasty-looking daily demand at 0.9577-0.9637, which happens to converge with a 50.0% support value at 0.9627 (green line –taken from the low 0.9187). Given the strong momentum produced from this demand area’s base, the odds of buyers entering the fold from here are high!
Areas of consideration:
From a technical standpoint, both weekly and daily timeframes suggest further selling could be on the cards. With that being the case, shorts around the underside of 0.97, targeting the top edge of daily demand at 0.9637, could still be something to consider (stops can be positioned around the top edge of the green H4 supply [0.9715]).
Yes, we know price is still trading off H4 demand at the moment, though with overhead pressure potentially seen coming in from the higher timeframes along with the lower edge of the H4 base recently being taken, this H4 zone is likely to eventually break.
Today’s data points: US ISM manufacturing PMI.
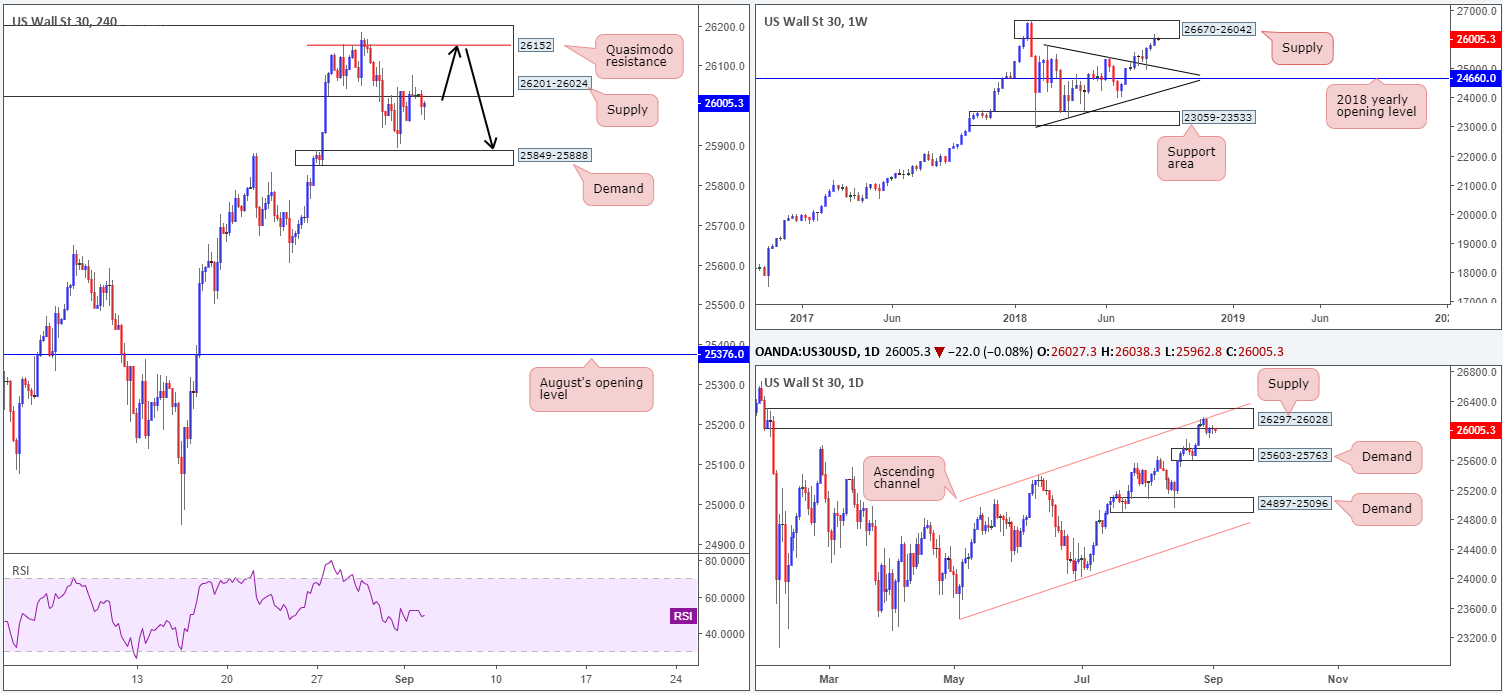
Dow Jones Industrial Average:
Trading action was on the ‘quiet side’ on Monday, given US traders kept their books closed in observance of Labor Day. As a result of this, much of the following report will echo thoughts put forward in Monday’s analysis.
Although the DJIA registered its third consecutive weekly gain last week, traders may have noticed price recently engaged with the lower edge of a weekly supply at 26670-26042, following a strong retest off a weekly trend line resistance-turned support (etched from the high 25807) a few weeks back.
In terms of the daily timeframe, strong supply at 26297-26028 remains in the fold. What gives this area credibility comes down to the following:
- Downside momentum drawn from the base is incredibly strong.
- The zone intersects with a daily channel resistance (taken from the high 25399).
- Glued to the underside of the aforesaid weekly supply area.
A closer look at price action on the H4 timeframe shows the unit testing the underside of a supply zone at 26201-26024 (seen fixed to the lower edge of the current daily supply), after bottoming just north of a demand area at 25849-25888 on Friday.
Areas of consideration:
As the current H4 supply is rather large, entering short from the H4 Quasimodo resistance level seen within the upper limits of the area at 26152 could be something to consider. This allows traders the option of positioning stops above the overall H4 supply (while keeping risk/reward in check), targeting the H4 demand area mentioned above at 25849-25888 as the initial take-profit zone.
Today’s data points: US ISM manufacturing PMI.
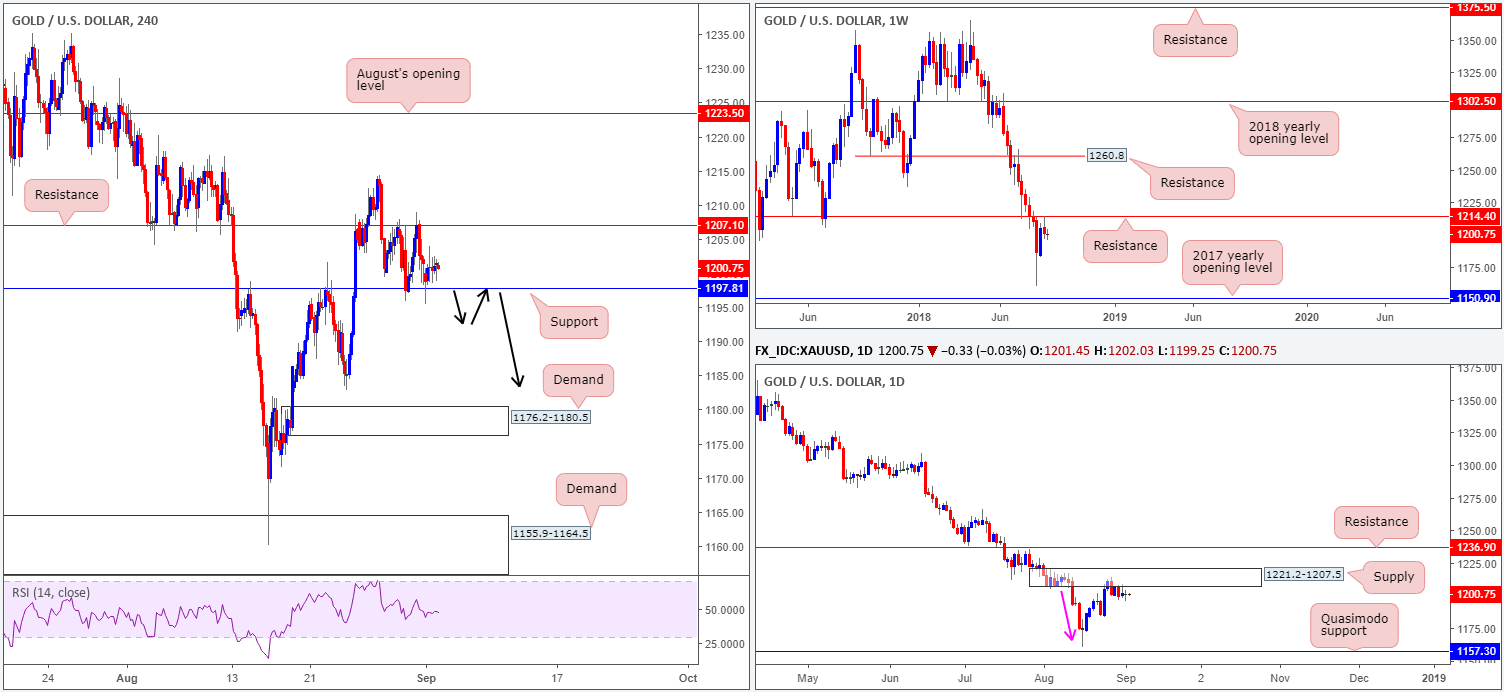
XAU/USD (Gold)
Trading volume was thin during the course of Monday’s sessions, as the USD entered into a stagnant phase largely due to US banks closing its doors in observance of Labor Day.
Since Wednesday last week, the H4 candles have been carving out a range between resistance plotted at 1207.1 and a support level drawn from 1197.8. Knowing this consolidation is forming around the underside of a nice-looking daily supply zone at 1221.2-1207.5, the chances of price breaking out of this range to the downside are high. Also worth noting and remembering is the fact weekly price retested the underside of resistance at 1214.4 and sold off last week by way of a reasonably nice-looking bearish pin-bar formation.
Further downside on both the weekly and daily timeframes show plenty of space for price to maneuver. However, the closest downside targets in view can be seen on the H4 scale around August 24 low at 1182.9, followed closely by H4 demand at 1176.2-1180.5.
Areas of consideration:
To our way of seeing things, traders have themselves two options today/this week:
- Look to fade the top edge of the current H4 range: the H4 resistance level mentioned above at 1207.1, in the hope higher-timeframe sellers kick into gear. To help pin down an entry and place stops, traders may want to consider entering on a bearish candlestick formation.
- Wait and see if H4 price breaks beneath the current H4 support level at 1197.8. A H4 close beneath this number, followed up with a retest in the shape of a full or near-full-bodied H4 bear candle would, technically speaking, likely be sufficient enough to consider shorts (black arrows), targeting August 24 low at 1182.9, followed closely by H4 demand at 1176.2-1180.5.
The use of the site is agreement that the site is for informational and educational purposes only and does not constitute advice in any form in the furtherance of any trade or trading decisions.
The accuracy, completeness and timeliness of the information contained on this site cannot be guaranteed. IC Markets does not warranty, guarantee or make any representations, or assume any liability with regard to financial results based on the use of the information in the site.
News, views, opinions, recommendations and other information obtained from sources outside of www.icmarkets.com.au, used in this site are believed to be reliable, but we cannot guarantee their accuracy or completeness. All such information is subject to change at any time without notice. IC Markets assumes no responsibility for the content of any linked site. The fact that such links may exist does not indicate approval or endorsement of any material contained on any linked site.
IC Markets is not liable for any harm caused by the transmission, through accessing the services or information on this site, of a computer virus, or other computer code or programming device that might be used to access, delete, damage, disable, disrupt or otherwise impede in any manner, the operation of the site or of any user’s software, hardware, data or property.


