
EUR/USD:
EUR/USD bulls firmly entered an offensive phase Monday, adding 0.64%. The euro garnered broad support as the US dollar index, or DXY, came under pressure. Disappointing US ISM manufacturing PMI data as well as Chicago Fed President Bullard unbolting the door for a rate cut collectively weighed on the buck.
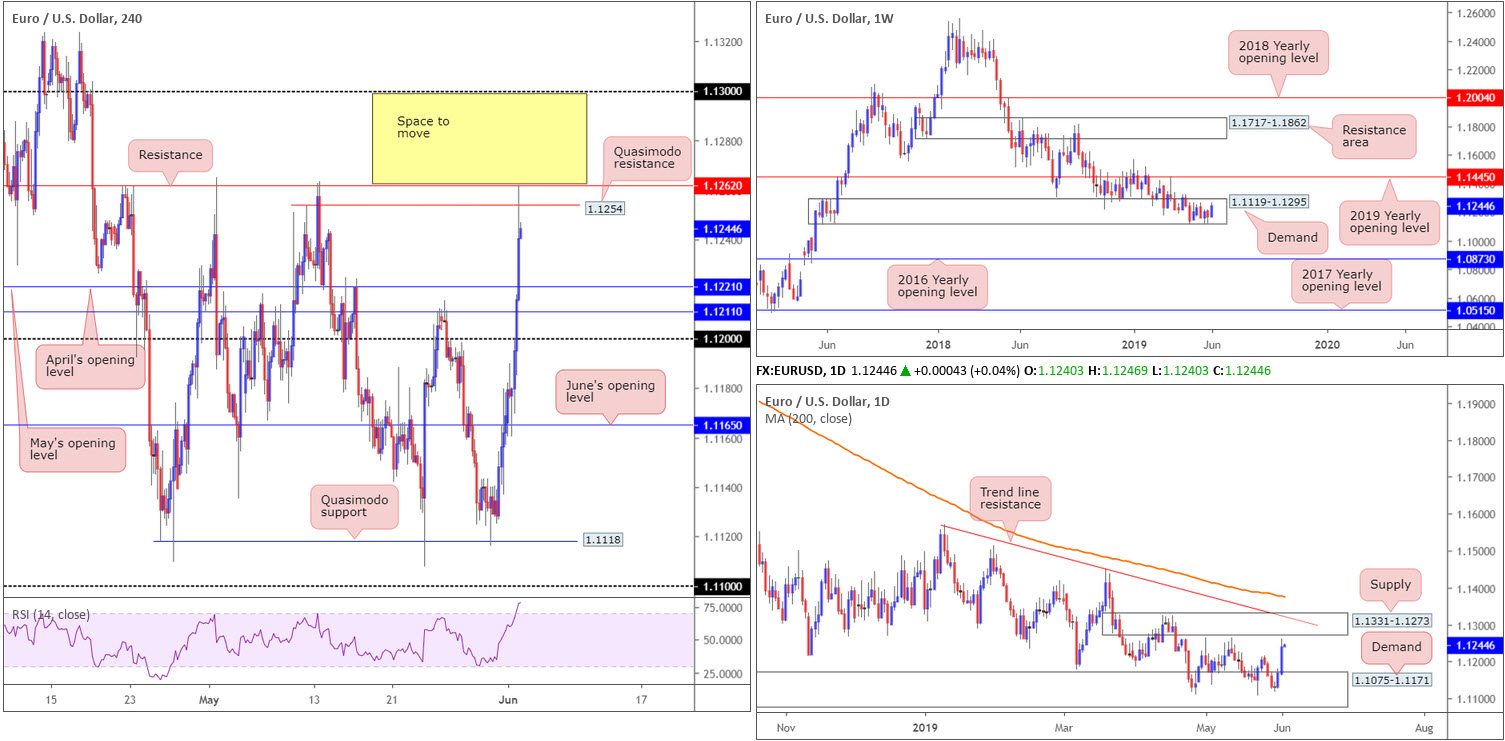
Longer-term technical flows remain positioned within the lower boundary of a long-standing weekly demand zone at 1.1119-1.1295. Upside from this point shows room for extension to as far north as the 2019 yearly opening level at 1.1445. Despite a positive start to June, however, traders may still want to acknowledge the overall trend remains facing a southerly bearing since topping in early 2018.
Daily demand coming in at 1.1075-1.1171 – glued to the underside of the current weekly demand – provided key support in recent movement, lifting the pair to within striking distance of daily supply coming in at 1.1331-1.1273. Note within this boundary we also have a daily trend line resistance extended from the high 1.1569.
A closer reading of price action on the H4 timeframe reveals the unit overthrew a number of key resistances Monday, including the 1.12 handle. As you can see, the session ended mildly fading resistance at 1.1262 and nearby Quasimodo resistance at 1.1254. Beyond this region, the research team notes limited resistance until shaking hands with the 1.13 neighbourhood, whereas continued rejection off 1.1262 may witness a pullback to April’s opening level plotted at 1.1221.
Areas of consideration:
With weekly demand at 1.1119-1.1295 attempting to make a stance and room seen within daily supply at 1.1331-1.1273 to push as far north as trend line resistance (1.1569), a break of H4 resistance at 1.1262 is a possibility today. In the event this comes to fruition, a short-term long position might be worth considering, targeting 1.13. Whether traders opt to buy the breakout candle (stops positioned beneath the lower shadow of breakout candle) or wait and see if a pullback to 1.1262 emerges is trader dependant (entry and risk can be determined according to the rejection candle’s structure). The latter is considered the higher-probability trade.
Today’s data points: EUR CPI Flash Estimate y/y; EUR Core CPI Flash Estimate y/y; FOMC Member Williams Speaks; Fed Chair Powell Speaks.
GBP/USD:
Sterling extended Friday’s recovery – a daily bullish engulfing pattern – Monday and added 0.26%. Upside was limited, however, due to dismal UK manufacturing PMI and British politics continuing to weigh heavily on the market.
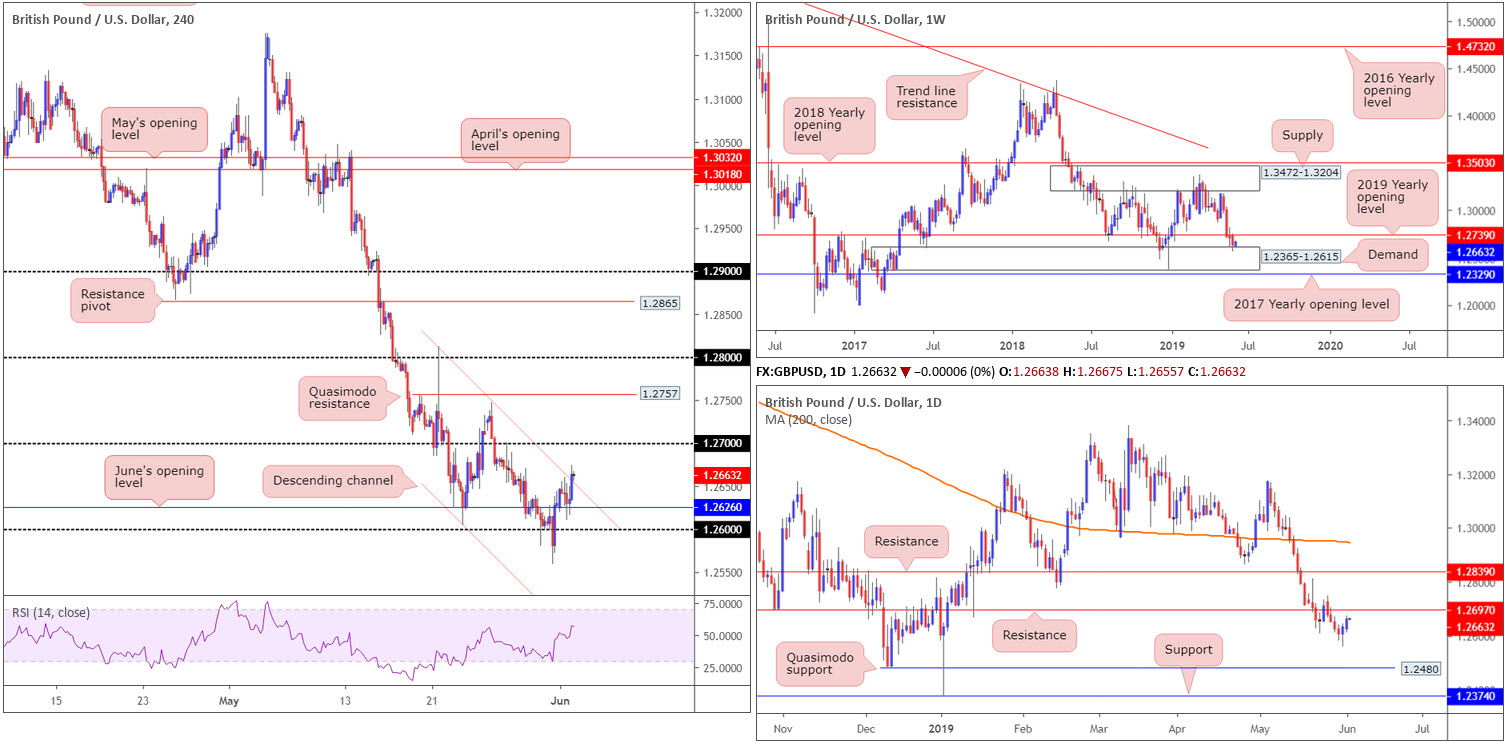
From a technical viewpoint, the H4 candles established support off June’s opening level at 1.2626 and climbed above channel resistance (taken from high 1.2812). The next upside objective from this point has the 1.27 handle in view. In conjunction with 1.27, daily structure has resistance pencilled in at 1.2697. Beyond 1.27, however, H4 Quasimodo resistance resides around 1.2757, which happens to be positioned just above weekly resistance at 1.2739 by way of the 2019 yearly opening level. It might also be worth noting weekly price is seen rebounding from the top edge of demand at 1.2365-1.2615.
Areas of consideration:
Overall, the research team believes there’s still some upside left in this market until sellers make an appearance, with the H4 Quasimodo resistance at 1.2757 positioned as the limit.
With that being the case, and assuming H4 price retests its broken channel resistance as support today (preferably in the shape of a H4/H1 bullish candlestick formation [entry/risk can be determined according to its structure]), a short-term buying opportunity may be on the cards. As highlighted above, 1.2757 is our set limit for upside moves, though traders can expect selling activity to emerge from 1.27 and also 1.2739.
Today’s data points: FOMC Member Williams Speaks; Fed Chair Powell Speaks.
AUD/USD:
In the early hours of Monday, the commodity-linked currency derived fresh impetus from better-than-expected Caixin PMI data out of China. Further buying materialised in US trade as unearthed speculations of a Fed rate cut on the back of comments from Chicago Fed President Bullard.
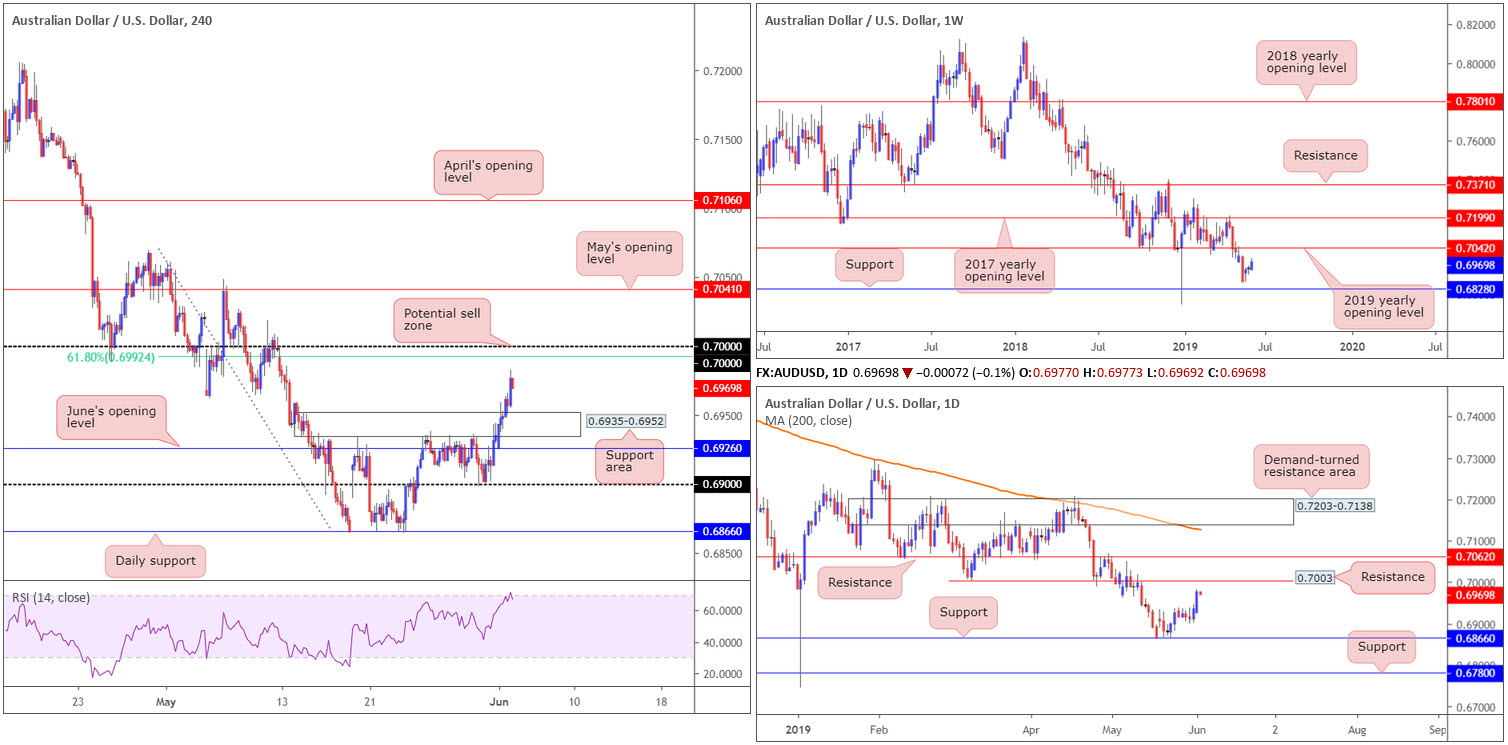
Although market participants are looking to the RBA today, the technical landscape offers fresh resistance around key figure 0.70 applied to the H4 chart. Merging closely with a 61.8% H4 Fibonacci resistance value at 0.6992 and daily resistance offering a potential ceiling close by at 0.7003, this area likely has active sellers in waiting. What’s also notable from a technical perspective is the clear-cut downtrend since early 2018 and the H4 RSI indicator is visibly testing overbought waters.
The only drawback to shorting 0.70, according to our technical studies, is weekly price appears poised to drive above the psychological number and approach the 2019 yearly opening level at 0.7042.
Areas of consideration:
0.70, despite weekly price suggesting a move higher, remains a key point of interest today. For folks concerned by longer-term flows may want to consider waiting and seeing how H4 action behaves prior to selling 0.70. A H4 bearish candlestick pattern, for example – think shooting star formation or bearish engulfing pattern – not only helps identify seller intent, it also provides traders entry and risk levels to work with.
Today’s data points: Australian Retail Sales m/m; Australian Current Account; RBA Cash Rate and Rate Statement; RBA Gov Lowe Speaks; FOMC Member Williams Speaks; Fed Chair Powell Speaks.
USD/JPY:
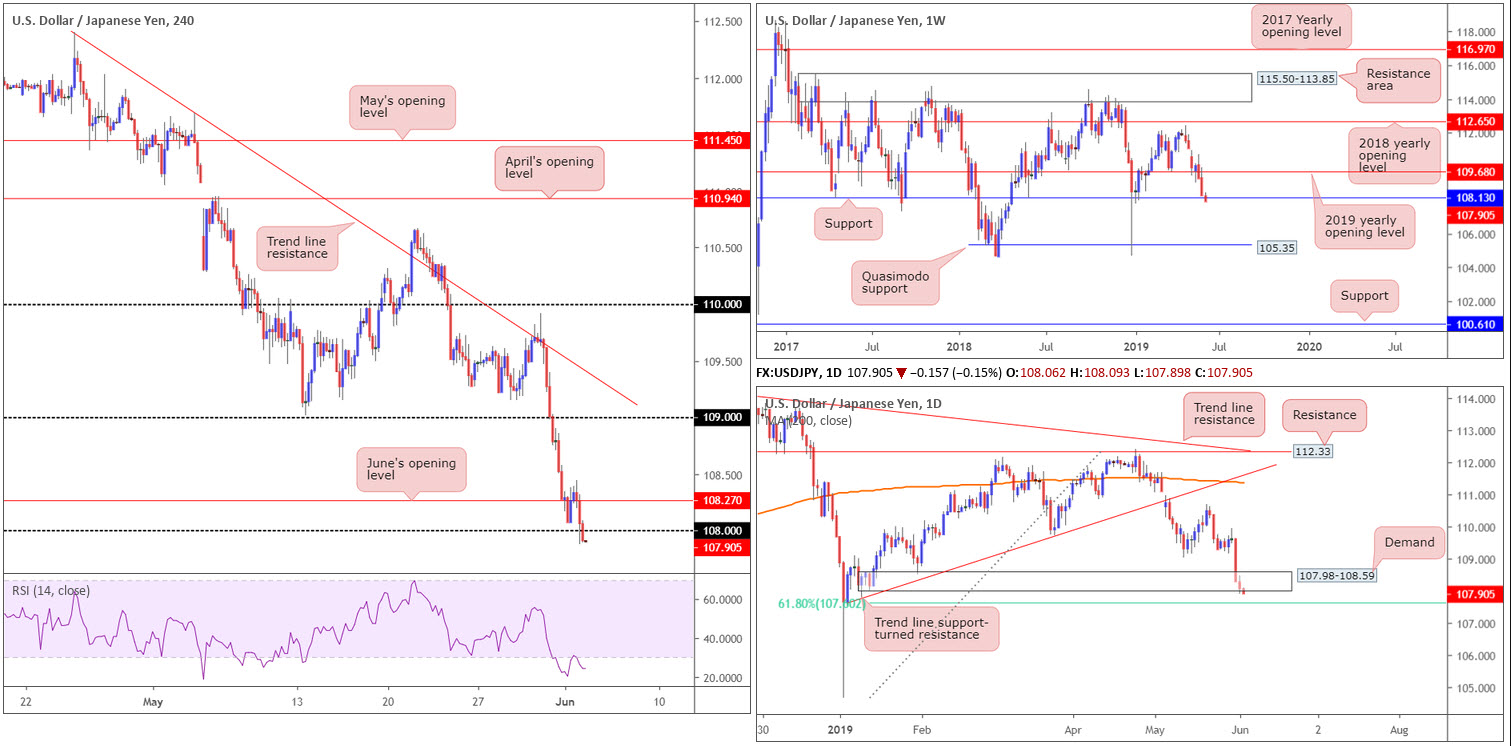
The dollar was on the back foot again Monday after Fed’s Bullard unbolted the door for a potential rate cut. The Japanese yen picked up a safe-haven bid, alongside bullion, and is, as of current price, seen probing sub 108 on the H4 chart. Beneath 108, the technical landscape appears starved of support until reaching 107.
In conjunction with H4 action, daily price recently breached the lower edge of demand at 107.98-108.59, potentially opening the gates towards a 61.8% Fibonacci support at 107.60. The story on the weekly timeframe has price trading at weekly support priced in at 108.13. Should this level give way, the river south appears ripple free until Quasimodo support at 105.35.
Areas of consideration:
A decisive H4 close formed beneath 108 today likely seals downside to at least the 61.8% daily Fibonacci support mentioned above at 107.60. The ultimate downside target, though, can be seen on the weekly timeframe at 105.35, though traders should also expect some buying to materialise around 107 and 106.
On account of the above, a decisive H4 close beneath 108 that’s followed up with a retest, preferably by way of a H4 bearish candlestick configuration, is considered a high-probability move. Entry and risk levels can be applied according to the selected bearish candlestick pattern.
Today’s data points: FOMC Member Williams Speaks; Fed Chair Powell Speaks.
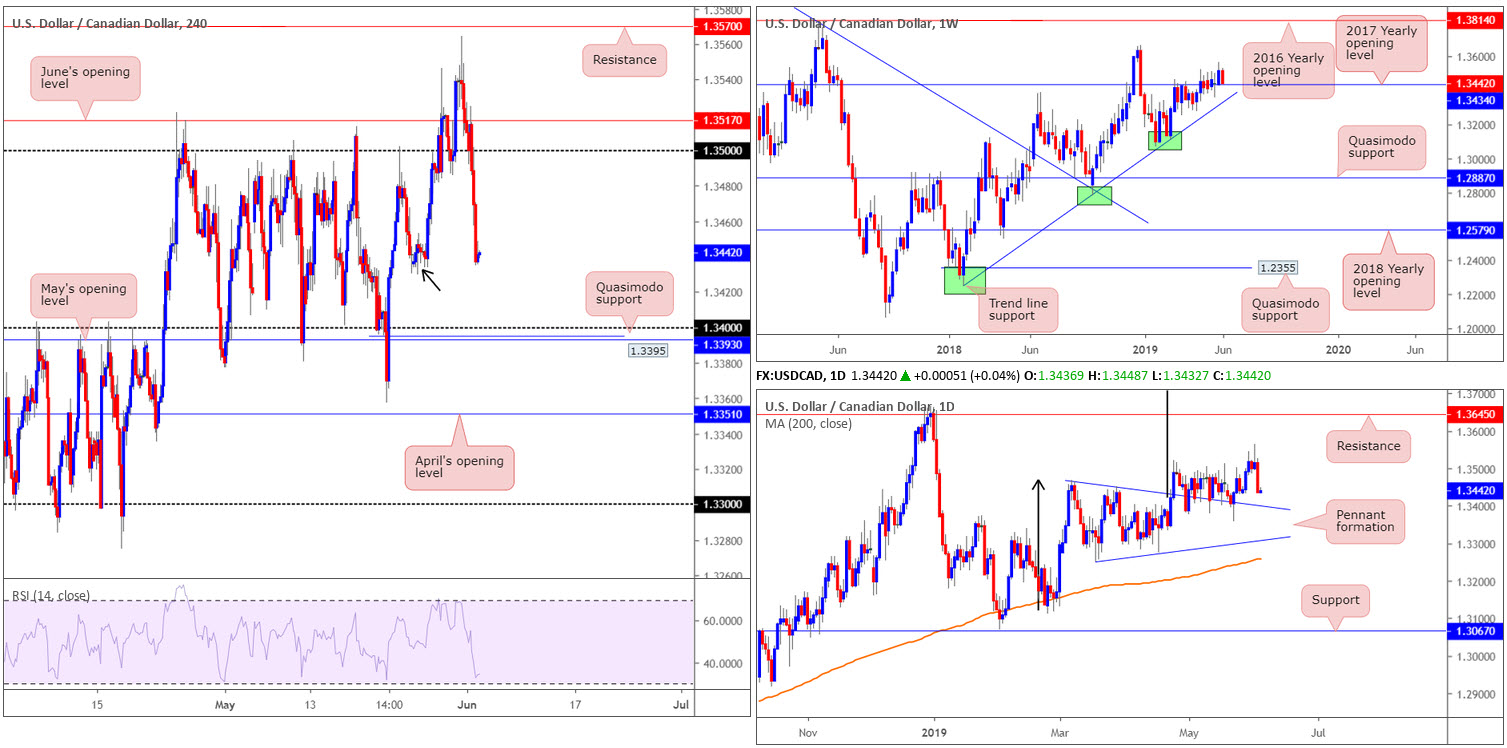
USD/CAD:
Broad-based USD selling sent the USD/CAD market aggressively lower Monday, down 0.58%. The move, in the shape of a near-full-bodied daily bearish candle, overthrew 1.35 on the H4 chart and clocked session lows of 1.3434.
Aside from potential H4 demand emerging from the 1.3429 May 27 low (black arrow), downside appears relatively free until shaking hands with 1.34, as well as May’s opening level at 1.3393 and a Quasimodo support at 1.3395.
The higher-timeframe picture, nonetheless, has support in motion at 1.3434: the 2017 yearly opening level applied to the weekly timeframe. This is followed closely by a trend line support extended from the low 1.2247. Closer analysis of the daily timeframe also shows support meandering nearby in the form of a pennant pattern (1.3467). For the past month, price action has been feeding off this level. Assuming the barrier holds once again, the traditional price target (calculated by taking the distance from the beginning of the preceding move and adding it to the breakout price) remains on the chart at 1.3768 (black arrows), though the next upside target from a structural standpoint falls in around resistance at 1.3645.
Areas of consideration:
While weekly price may attempt to defend 1.3434 as support, the research team favours the 1.34 neighbourhood on the H4 for potential longs today/this week. Not only is this number closely supported by May’s opening level at 1.3393 and a Quasimodo support at 1.3395, it merges closely with the daily pennant pattern.
Traders have the option of entering at market around 1.34 with a tight stop-loss order of around 10-15 points, or waiting and seeing if additional price action confirmation develops. This could be something as simple as a H4 bullish candlestick pattern, a moving average crossover or even drilling down to the lower timeframes and attempting to trade local structure. What this does is help identify buyer intent and also provide traders levels to enter and base stop-loss orders from.
Today’s data points: FOMC Member Williams Speaks; Fed Chair Powell Speaks.
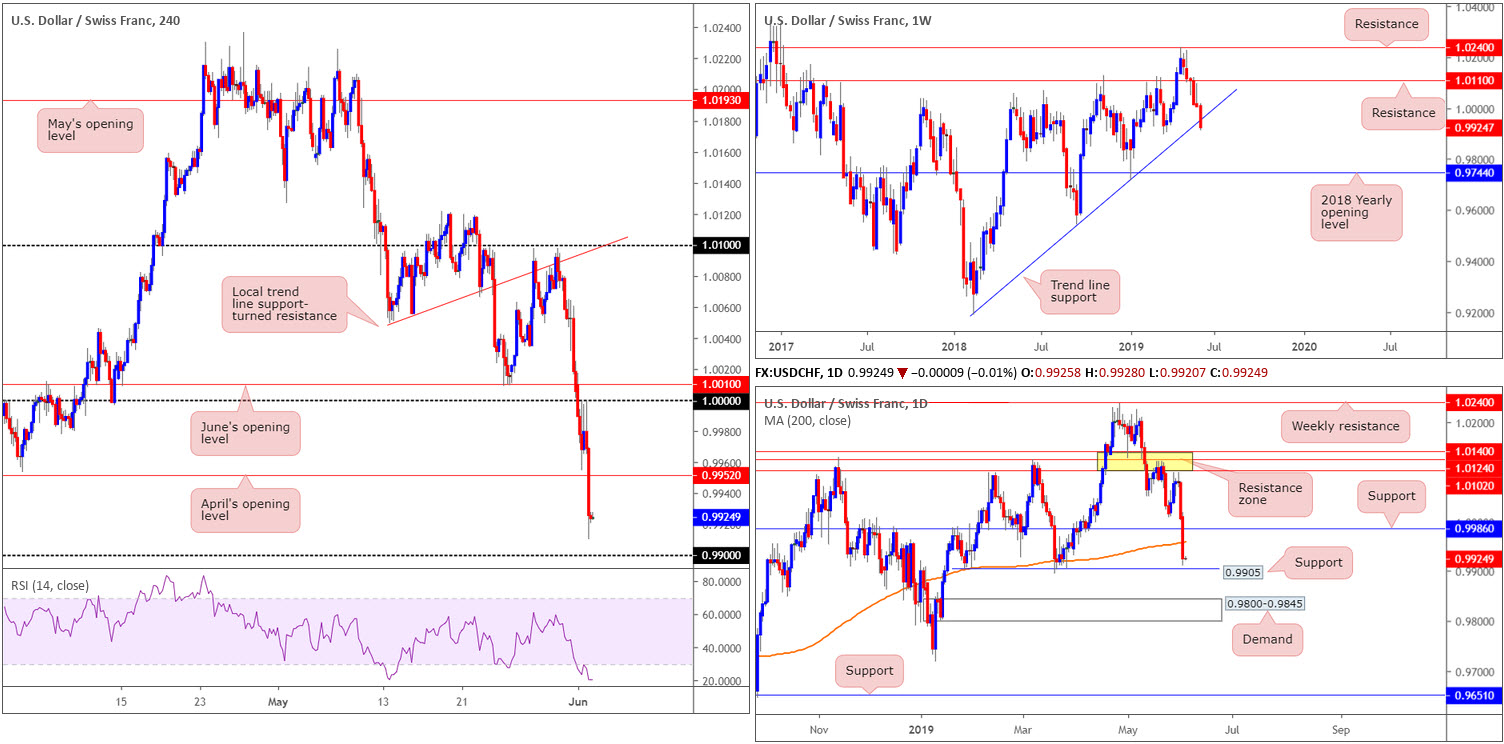
USD/CHF:
Down 0.80%, the US dollar ceded further ground to its Swiss counterpart Monday. Bolstered by a waning dollar index, the H4 candles dethroned 1.0000 (parity) in robust fashion and swiftly retested the underside of this limit twice yesterday, once going into London hours and again as US businesses unlocked their doors. The selloff from this boundary was strong, taking out April’s opening level at 0.9952 and exposing the 0.99 handle as the next viable support on the H4 timeframe.
On a wider perspective, weekly price engulfed trend line support (extended from the low 0.9187). In the event price action remains beneath this boundary, longer-term action may attempt an approach towards the 2018 yearly opening level at 0.9744. Daily movement, on the other hand, crossed beneath its 200-day SMA in recent trading, poised to connect with support priced in at 0.9905.
Areas of consideration:
The 0.99 handle applied to the H4 chart is likely to offer some respite should it be tested today. This is largely due to its connection with daily support at 0.9905. Whether a bounce from here will amount to much, though, is difficult to decipher, given weekly price recently took out trend line support. Therefore, traders looking to fade 0.99 are urged to trade cautiously and adopt strict trade managed rules.
Should we turn higher and leave 0.9905 unchallenged, however, a short-term selling opportunity from April’s opening level at 0.9952 may be of interest, as each analysed timeframe displays room to press lower. Cautious sellers may want to exercise patience before pulling the trigger, since a fakeout above 0.9952 is a possibility – confirmation techniques will vary between traders.
Today’s data points: FOMC Member Williams Speaks; Fed Chair Powell Speaks.
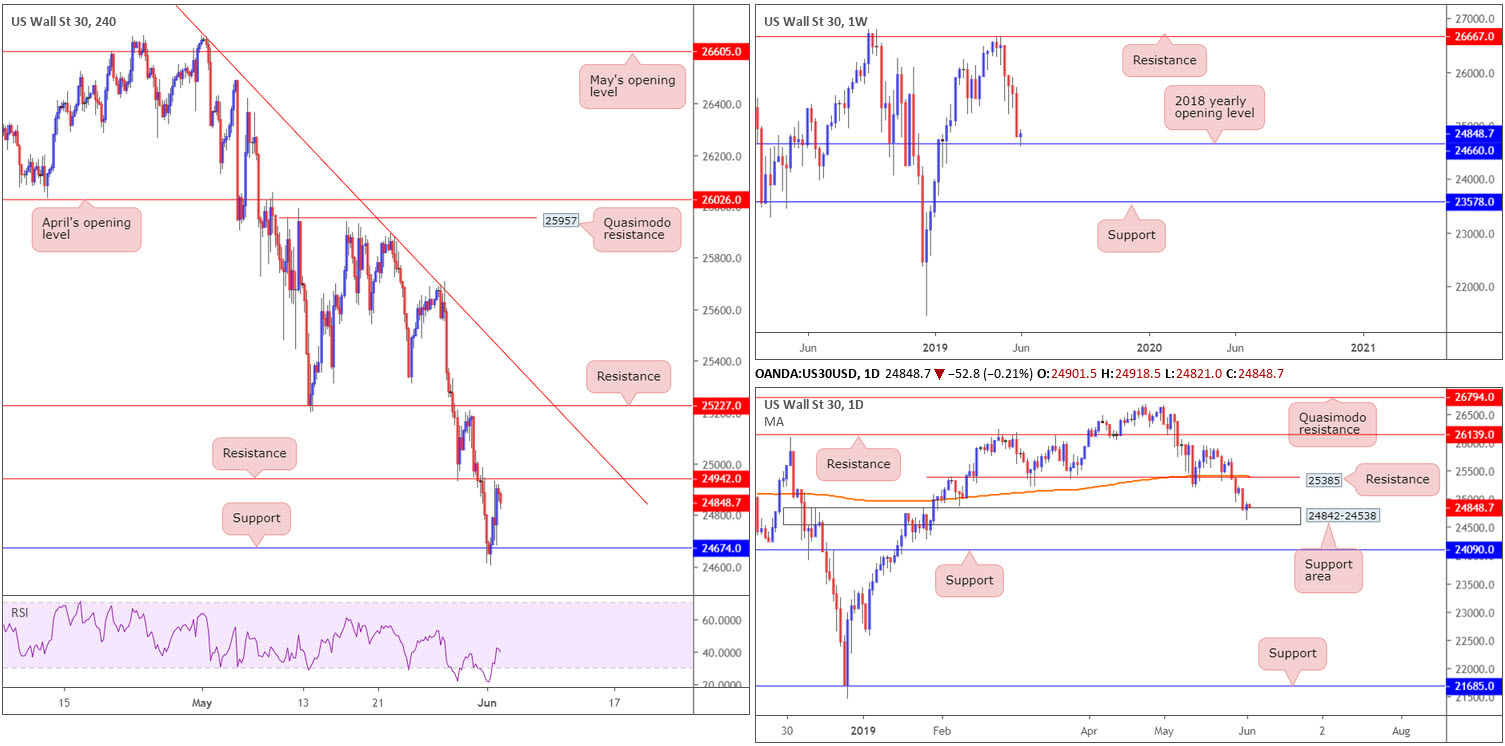
Dow Jones Industrial Average:
US benchmarks finished Monday mostly lower amid signs the Justice Department is laying the groundwork to ratchet up scrutiny on some of the market’s biggest technology names. The Dow Jones Industrial Average eked out minor gains of 0.02%, while the S&P 500 fell 0.28% along with the tech-heavy Nasdaq 100 losing more than 2.00%.
The technical view on the DJIA, however, reveals support emerging on the weekly timeframe from the 2018 yearly opening level at 24660. Beyond this mark, limited support is visible until 23578. In conjunction with weekly flow, daily price challenged a support area at 24842-24538 in the shape of a nice-looking hammer formation. The next upside target from this point falls in around resistance at at 25385, which, as of writing, aligns with the 200-day SMA.
For traders who read Monday’s report you may recall the piece highlighted the following:
Aggressive traders might opt to position a long entry around 24674 (H4 support) and position a protective stop-loss order beneath the daily support area (24538). Should the above reading prove correct, the risk/reward could be monstrously huge from here.
Well done to any of our readers who managed to take advantage of this move, as price action recently struck its first take-profit target at H4 resistance drawn from 24942. In the event we overcome this level and push higher, resistance at 25227 is next in the firing range.
Areas of consideration:
Traders long from 24674 might want to consider reducing risk to breakeven at this point and taking some profits off the table.
Aside from the call out of 24674, the research team sees little to hang their hat on this morning in terms of high-probability setups.
Today’s data points: FOMC Member Williams Speaks; Fed Chair Powell Speaks.
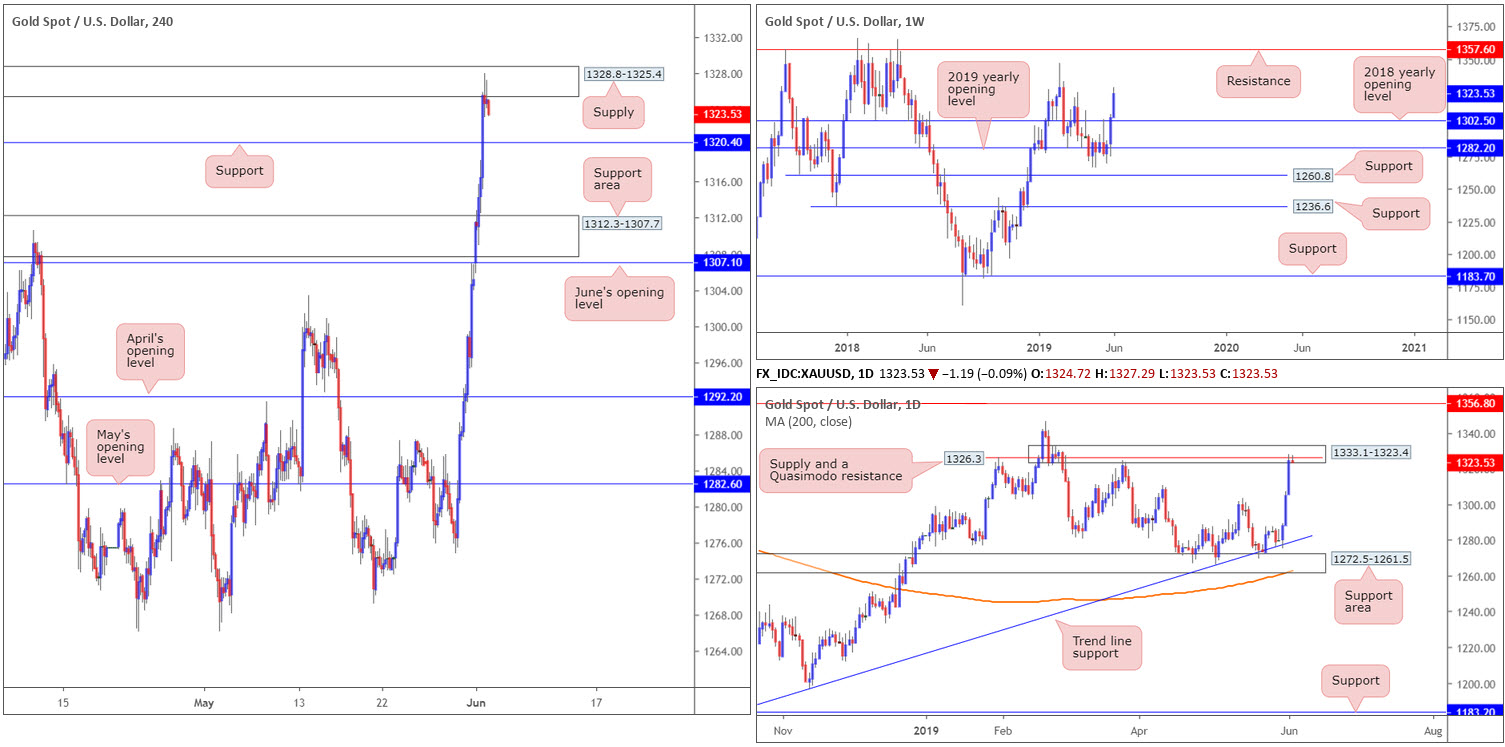
XAU/USD (GOLD):
In $ terms, the price of gold advanced strongly Monday as the precious metal continued to find demand as a safe-haven asset.
Kicking off with the weekly timeframe, we can see that aside from the possibility of shorts emerging from the 1346.7 February high, limited resistance is visible above 1302.5 (the 2018 yearly opening level) until reaching 1357.6. In contrast to weekly direction, though, daily price recently crossed paths with supply at 1333.1-1323.4, which happens to align with a Quasimodo resistance at 1326.3.
Across on the H4 timeframe, we also see supply entering the fold around 1328.8-1325.4, with the next downside target emerging from 1320.4. Beyond here, the next port of call can be seen around a support area coming in at 1312.3-1307.7.
Areas of consideration:
Having seen a daily supply enter the fight at 1333.1-1323.4, along with a daily Quasimodo resistance at 1326.3, the H4 supply is likely to hold price action lower from the current H4 supply at 1328.8-1325.4. As highlighted above, the first downside target can be seen around H4 support at 1320.4, followed then by a H4 support area at 1312.3-1307.7.
Shorting at current price does somewhat skew risk/reward, though still offers around a 1:1 ratio to 1320.4. That is assuming traders position protective stop-loss orders above the aforementioned H4 supply.
The accuracy, completeness and timeliness of the information contained on this site cannot be guaranteed. IC Markets does not warranty, guarantee or make any representations, or assume any liability with regard to financial results based on the use of the information in the site.
News, views, opinions, recommendations and other information obtained from sources outside of www.icmarkets.com.au, used in this site are believed to be reliable, but we cannot guarantee their accuracy or completeness. All such information is subject to change at any time without notice. IC Markets assumes no responsibility for the content of any linked site. The fact that such links may exist does not indicate approval or endorsement of any material contained on any linked site.
IC Markets is not liable for any harm caused by the transmission, through accessing the services or information on this site, of a computer virus, or other computer code or programming device that might be used to access, delete, damage, disable, disrupt or otherwise impede in any manner, the operation of the site or of any user’s software, hardware, data or property.


