
Waiting for lower timeframe confirmation is our main tool to confirm strength within higher timeframe zones, and has really been the key to our trading success. It takes a little time to understand the subtle nuances, however, as each trade is never the same, but once you master the rhythm so to speak, you will be saved from countless unnecessary losing trades. The following is a list of what we look for:
- A break/retest of supply or demand dependent on which way you’re trading.
- A trendline break/retest.
- Buying/selling tails/wicks – essentially we look for a cluster of very obvious spikes off of lower timeframe support and resistance levels within the higher timeframe zone.
- Candlestick patterns. We tend to stick with pin bars and engulfing bars as these have proven to be the most effective.
We typically search for lower-timeframe confirmation between the M15 and H1 timeframes, since most of our higher-timeframe areas begin with the H4. Stops are usually placed 1-3 pips beyond confirming structures.
EUR/USD:
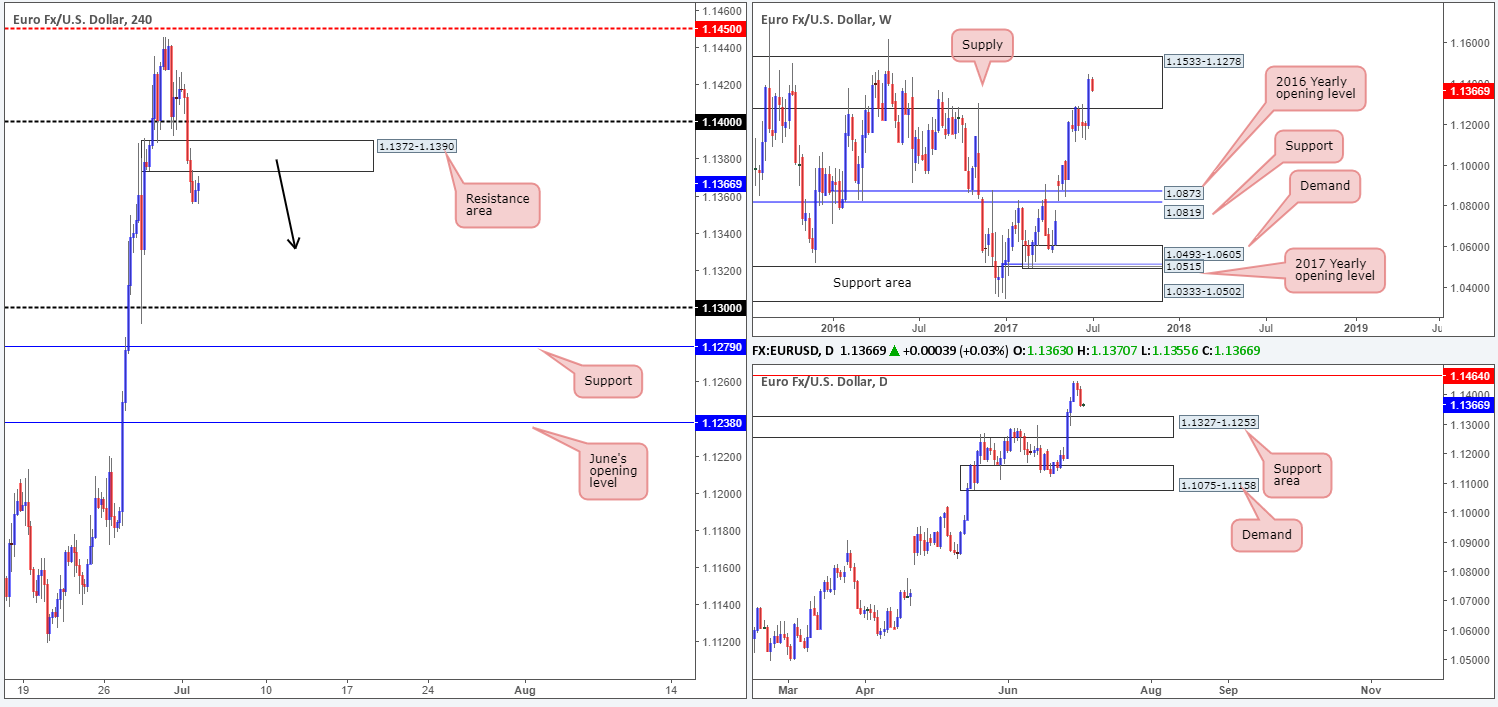
Across the board the US dollar advanced for a second consecutive day on Monday, consequently forcing the EUR southbound. Both the 1.14 handle and a H4 demand base at 1.1372-1.1390 were taken out, leaving H4 price free to finish the day around the 1.1360 mark.
Seeing the H4 candles now trading only inches away from retesting the underside of the recently broken demand zone, would we consider this to be a stable enough platform to sell today? Yes. The reasons behind our decision can be seen on the bigger picture. Weekly price remains loitering within the walls of a major supply zone drawn from 1.1533-1.1278. On the daily chart, there’s space for the candles to continue moving south at least until the pair connects with the support area fixed at 1.1327-1.1253.
Our suggestions: Granted, we do seem to have a higher-timeframe connection regarding the H4 resistance area, but we would still require additional confirmation in the form of a H4 bearish candle reversal, before pulling the trigger. This is largely to help avoid any fakeout up to the 1.14 neighborhood. Should a trade come to fruition from 1.1372-1.1390, we’d be looking to ride the train south until we reach 1.1327, followed closely by the 1.13 handle.
Data points to consider: No high-impacting events on the docket today. US banks closed in observance of Independence Day.
Levels to watch/live orders:
- Buys: Flat (stop loss: N/A).
- Sells: 1.1372-1.1390 ([waiting for a reasonably sized H4 bear candle – preferably a full-bodied candle – to form before pulling the trigger is advised] stop loss: ideally beyond the candle’s wick).
GBP/USD:
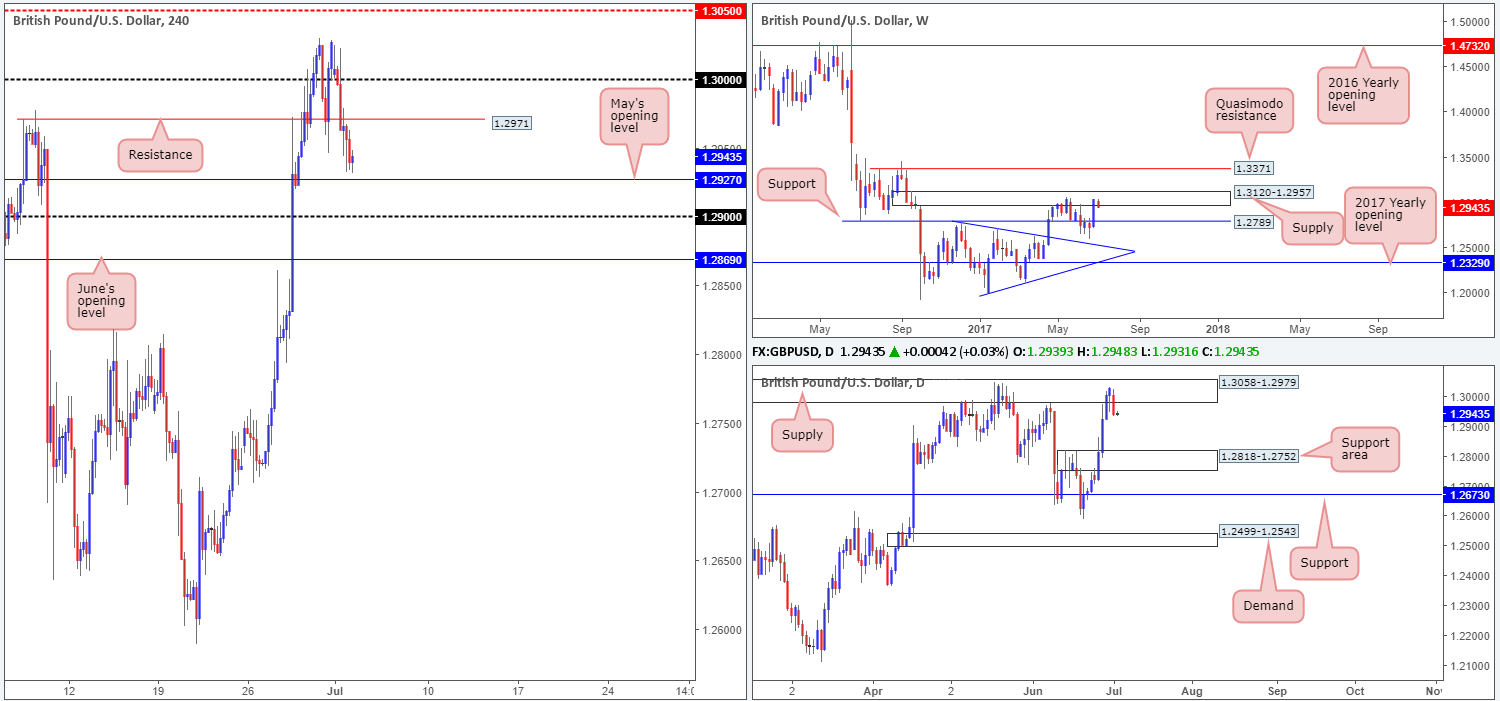
Kicking this morning’s report off with a quick look at the weekly timeframe shows that the bears are beginning to make an appearance from the supply zone marked at 1.3120-1.2957. Providing that the bears can hold firm here, the next line in the firing range will be the support level pegged at 1.2789. Turning our attention to the daily timeframe, the pair is also seen interacting with a supply zone at 1.3058-1.2979, which is essentially a partner supply to the aforementioned weekly area. Should this bearish momentum continue to be seen here on the daily chart, it is likely that we’ll see price shake hands with a support area coming in at 1.2818-1.2752, which happens to house the weekly support level mentioned above at 1.2789.
Over on the H4 candles, the unit is seen lurking just ahead of May’s opening level at 1.2927, shadowed closely by the 1.29 handle. Given this, neither a long nor short seems attractive at the moment. Both the weekly and daily timeframes suggest selling to be the preferred approach, while H4 structure shows multiple supports hovering below current price. The path would, as far as we can see, only be clear once June’s opening level at 1.2869 is cleared, and even then we’re not left with much wiggle room until we reach the top edge of the aforementioned daily support area at 1.2818.
Our suggestions: Based on current structure, our team has decided to humbly step aside today.
Data points to consider: UK Construction PMI at 9.30am GMT+1. US banks closed in observance of Independence Day.
Levels to watch/live orders:
- Buys: Flat (stop loss: N/A).
- Sells: Flat (stop loss: N/A).
AUD/USD:
During the course of Monday’s segment, the H4 candles breached support at 0.7676 and headed for the mid-level support at 0.7650. This number, as you can see, managed to stabilize price into the closing bell. According to the weekly timeframe, where recently a trendline resistance extended from the high 0.7835 was brought into view, we could see price action slip lower and eventually touch gloves with a support area formed at 0.7610-0.7543. On the other side of the spectrum, however, daily price is seen located within a support area coming in at 0.7679-0.7640. While it is not wise to overlook this zone, things do not look too promising at the moment. The next area of interest beyond here can be seen at 0.7556-0.7523: another support area that’s positioned within the noted weekly support zone.
Our suggestions: In a similar fashion to Monday’s report, this remains a somewhat difficult market to trade at the moment. Although the weekly timeframe suggests that selling could be the way forward, both the H4 and daily charts suggest otherwise! Therefore, we believe opting to stand on the sidelines may be the better position to take today.
Data points to consider: Australian Retail sales figures at 2.30am, RBA Rate statement at 5.30am GMT+1. US banks closed in observance of Independence Day.

Levels to watch/live orders:
- Buys: Flat (stop loss: N/A).
- Sells: Flat (stop loss: N/A).
USD/JPY:
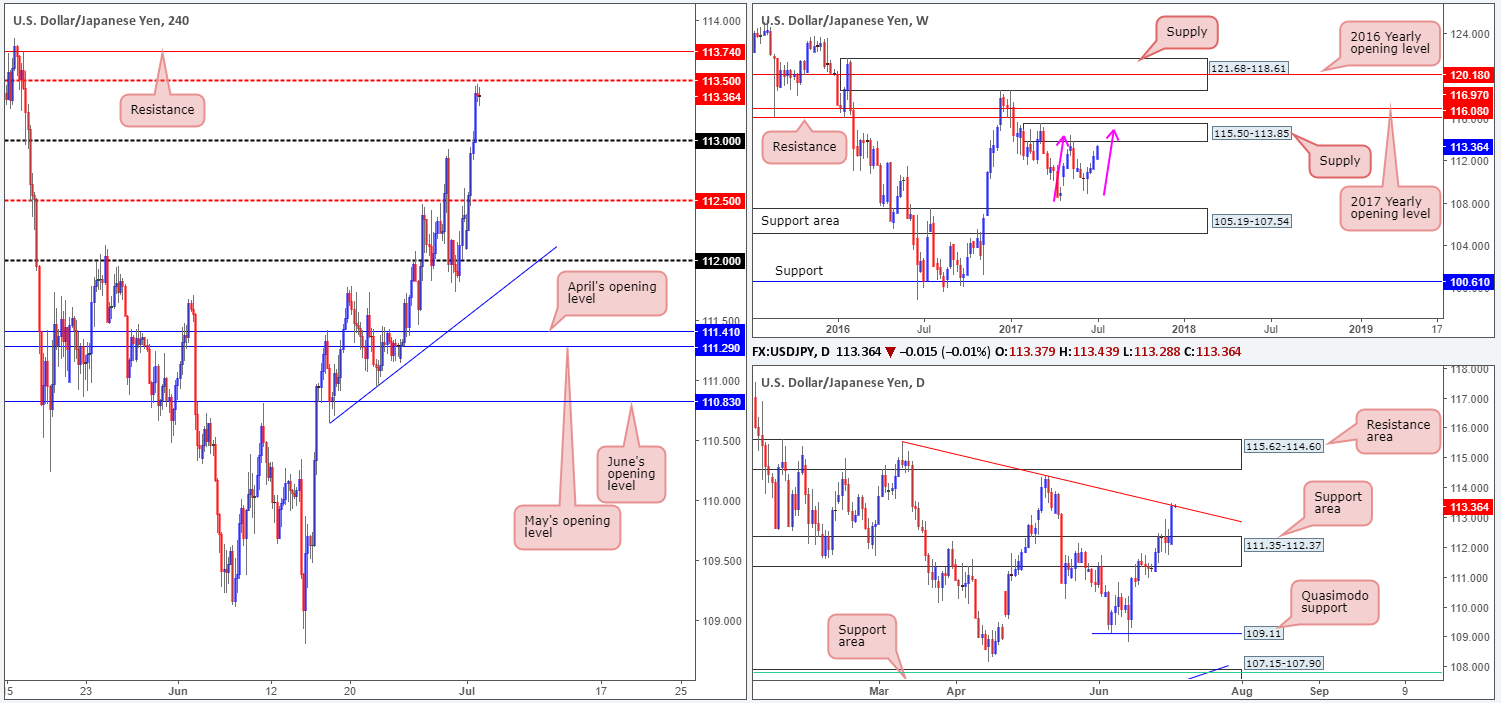
The buyers managed to find their feet early on in the day yesterday. Multiple H4 tech resistances were wiped out, with price only showing signs of stabilization as the unit approached the H4 mid-level resistance at 113.50. Bolstering this number, there’s a daily trendline resistance taken from the high 115.50. But is this enough to halt further buying today? The reason for asking this is due to weekly price showing room to advance up to supply coming in at 115.50-113.85 in the shape of a potential AB=CD correction (see pink arrows).
Our suggestions: While a sell from 113.50 looks appealing, we would not feel comfortable trading against potential weekly flow. With that being the case, we will not be selling from 113.50, or the H4 resistance seen planted above it at 113.74. Instead will be looking for price to extend its gains today and hopefully connect with the aforementioned weekly supply zone, before considering a sell.
Data points to consider: No high-impacting events on the docket today. US banks closed in observance of Independence Day.
Levels to watch/live orders:
- Buys: Flat (stop loss: N/A).
- Sells: Flat (stop loss: N/A).
USD/CAD:
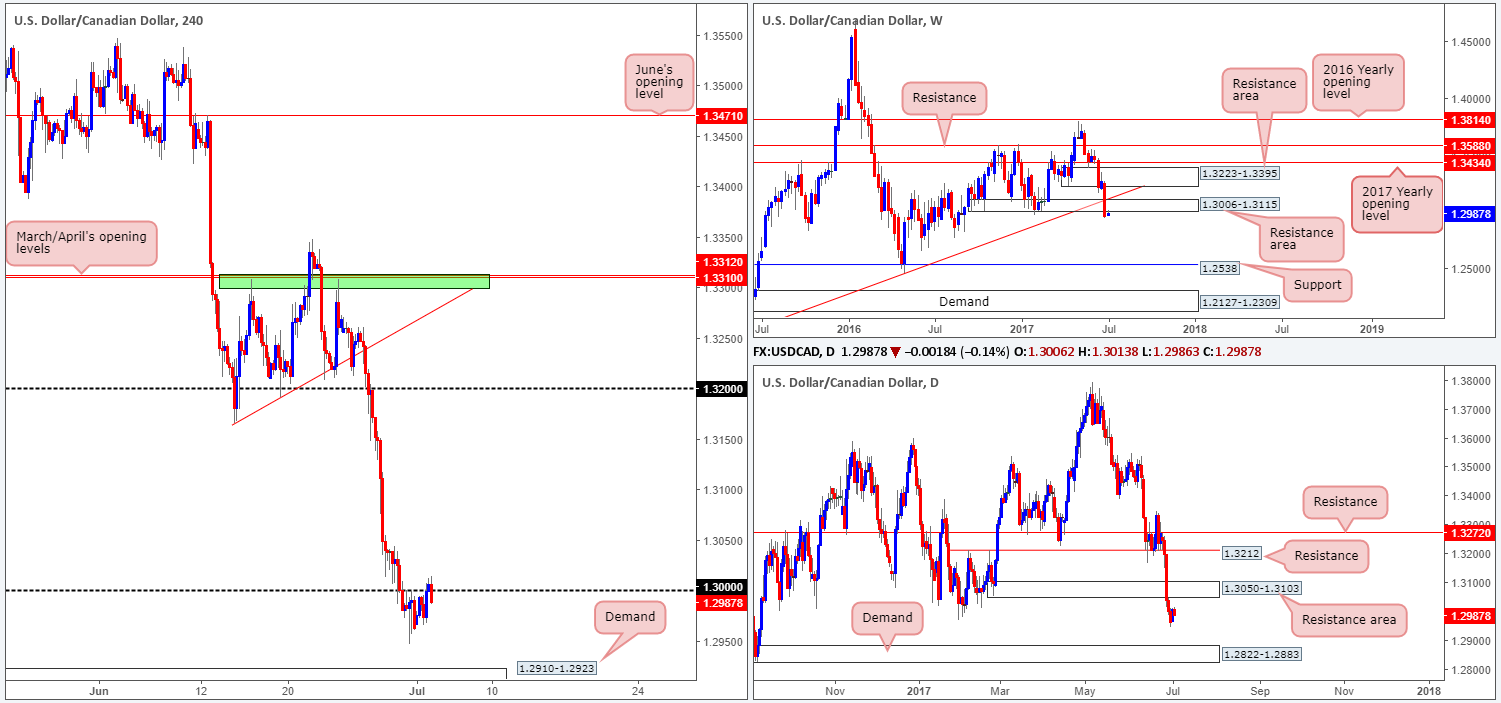
Trade update: The short position taken from 1.2972 was recently stopped out at 1.3005.
In recent trading, we’ve seen the H4 candles punch back above the 1.30 region and tap a high of 1.3013. This move has very likely triggered a truckload of stop-loss orders, including ours! However, all may not be lost here! The current H4 candle is looking incredibly bearish right now. Should this candle close at, or very near, its lows, this would be a strong signal to indicate a selloff may be on the horizon. Why we feel so strongly regarding shorting this market comes down to seeing both the weekly and daily charts showing room for the loonie to continue pressing lower, at least until we reach daily demand based at 1.2822-1.2883.
Our suggestions: With stops taken from above 1.30, and the higher-timeframe picture showing space to move lower as well as a possible H4 full-bodied bearish candle that closes below 1.30, this is something we would look to sell. The first take-profit target would be a H4 demand base seen at 1.2910-1.2923. A break beyond here, however, would push us to look at the top edge of the daily demand at 1.2883.
Data points to consider: No high-impacting events on the docket today. US banks closed in observance of Independence Day.
Levels to watch/live orders:
- Buys: Flat (Stop loss: N/A).
- Sells: Should the current H4 candle close bearishly, then a short from here is valid (stop loss: 1.3015).
USD/CHF:
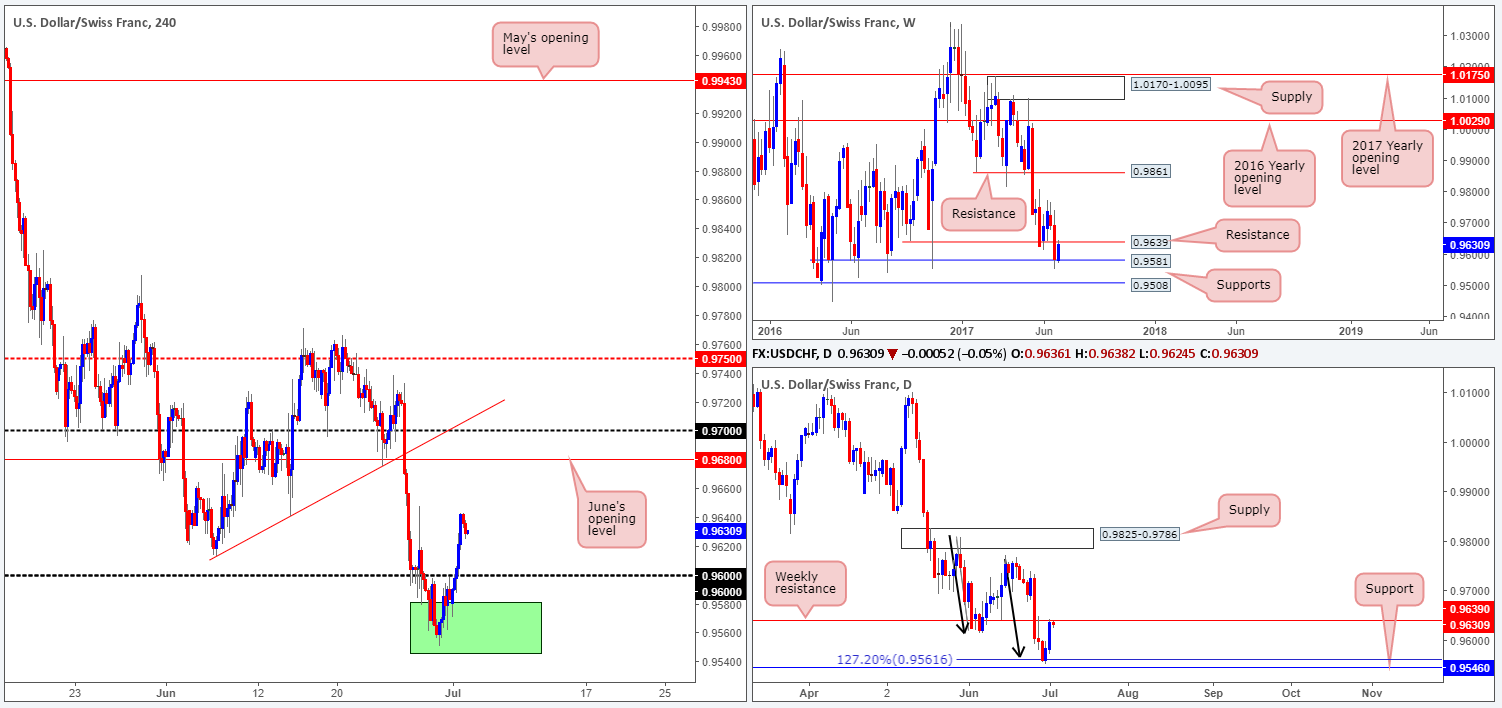
For those who have been following recent reports you may recall that our team is long from 0.9567. Our reasoning behind the position came down to the higher-timeframe picture. The green area shown on the H4 chart is comprised of a weekly support level at 0.9581 and a daily support level pegged at 0.9546. Initially, we had our stop beneath the green zone at 0.9544, but seeing as how the Swissy took off north yesterday, our stop is now resting at breakeven. In addition to this, we have also removed 70% of the position off the able once price struck weekly resistance at 0.9639. We’re going to hold the remaining 30% in the market since if the weekly resistance level is taken out; we feel June’s opening level at 0.9680 will be next in the firing range.
Our suggestions: Apart from our current trade, we do not see a lot to hang our hat on. Yes, one could look to sell from the current weekly resistance level, since the underlying trend in this market is pointing south. For us personally, we will hold fire and see if the bulls have any drive left after coming into contact with the weekly level.
Data points to consider: No high-impacting events on the docket today. US banks closed in observance of Independence Day.
Levels to watch/live orders:
- Buys: 0.9567 ([live] stop loss: breakeven).
- Sells: Flat (stop loss: N/A).
DOW 30:
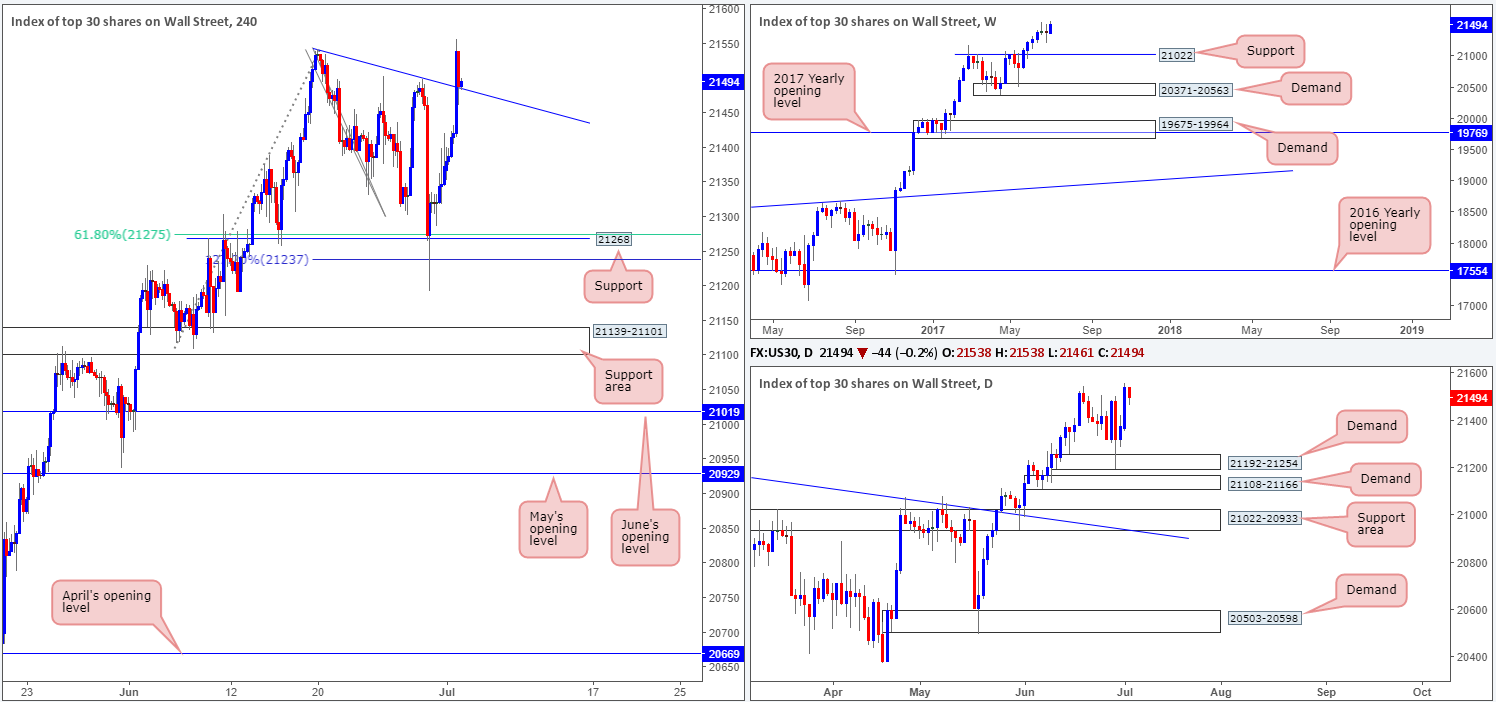
US equities, as you can see, continued to climb higher on Monday, eventually challenging and taking out a H4 trendline resistance extended from the high 21541. In Friday’s report, we mentioned that our desk took a long trade at 21323, following the large H4 bull candle that formed off the H4 support level marked at 21268. What attracted us to this point was that the H4 level converged with a H4 61.8% Fib support level at 21275 taken from the low 21108 as well as a H4 127.2% Fib ext. point 21237 drawn from the high 21541 and also because of the daily demand at 21192-21254.
Our stop-loss order has now been moved to breakeven and 50% of our position was taken off the table once price connected with the said H4 trendline resistance. We have left the remaining 50% in the market to run as we believe that this index has the potential to punch much higher yet!
Our suggestions: Given our current long position, our desk is watching for the H4 trendline to now hold as support. This could, given that the weekly, daily and H4 charts show absolutely no overhead resistance, also be a reasonable level to look for possible long opportunities. Personally, we’re happy as we are. Should price break into fresh highs today, however, we’ve noted that we are going to move our stop-loss order up to the 21400 neighborhood.
Data points to consider: No high-impacting events on the docket today. US banks closed in observance of Independence Day.
Levels to watch/live orders
- Buys: 21323 ([live] stop loss: breakeven).
- Sells: Flat (stop loss: N/A).
GOLD:
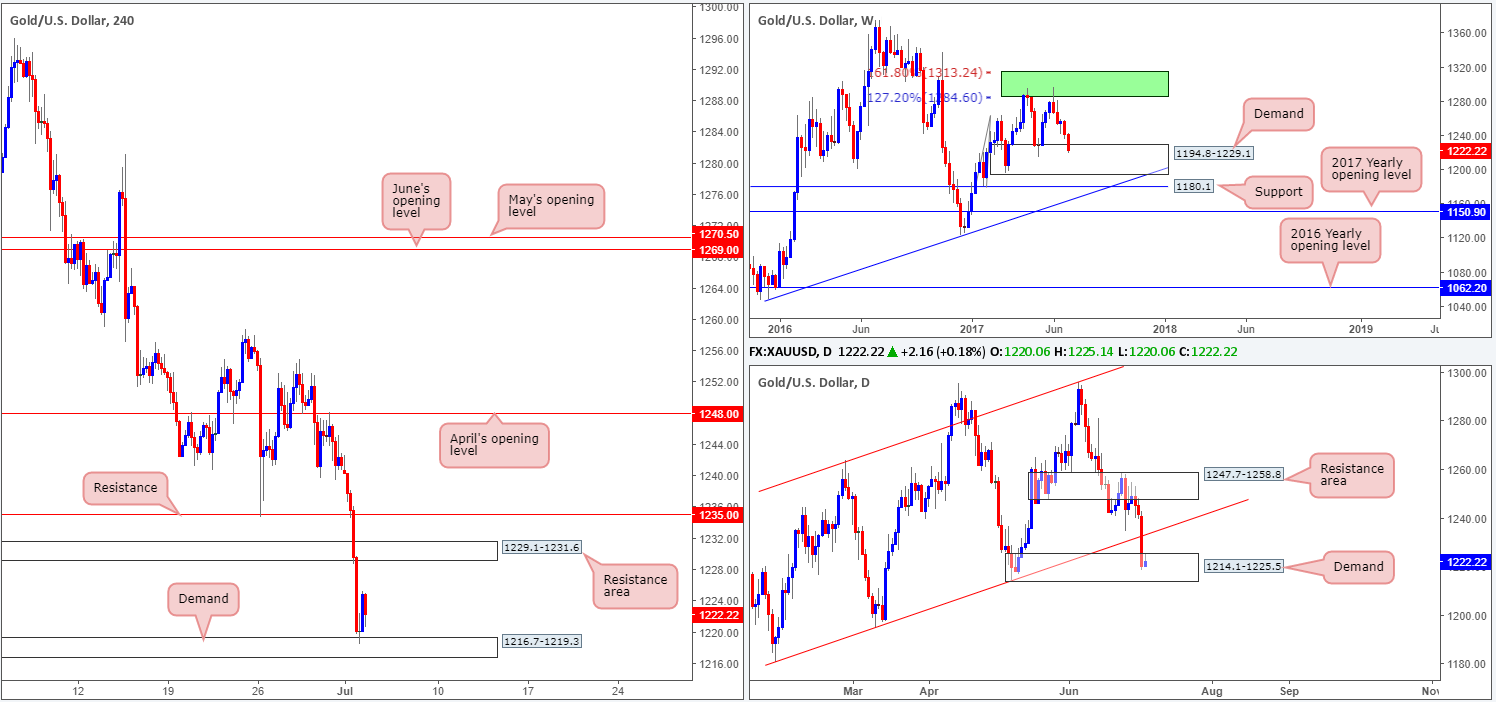
With the US dollar recently seen advancing higher, it was no surprise to see the price of the yellow metal decline in value. On the weekly timeframe, this has brought the unit down into the jaws of a demand base coming in at 1194.8-1229.1. Looking down to the daily timeframe, the recent move south enabled this market to break through the channel support taken from the low 1180.4, and trade deep into a demand area formed at 1214.1-1225.5.
Over on the H4 timeframe, we can also see that the price of gold stabilized around a demand area seen at 1216.7-1219.3. This area is positioned within both the weekly and daily demands mentioned above, and therefore could hold prices higher today and eventually send the metal north to retest 1229.1-1231.6 as resistance.
Our suggestions: While we are interested in buying this market, we would be hesitant at current prices. Ideally, should we see H4 price retest the said H4 demand zone today and print a reasonably sized H4 bull candle, preferably a full-bodied candle, we would have no hesitation in buying this market and targeting 1229.1-1231.6 as an initial take-profit zone.
Levels to watch/live orders:
- Buys: 1216.7-1219.3 ([waiting for a reasonably sized H4 bull candle – preferably a full-bodied candle – to form before pulling the trigger is advised if you want to help avoid a potential fakeout] stop loss: ideally beyond the candle’s tail).
- Sells: Flat (stop loss: N/A).


