
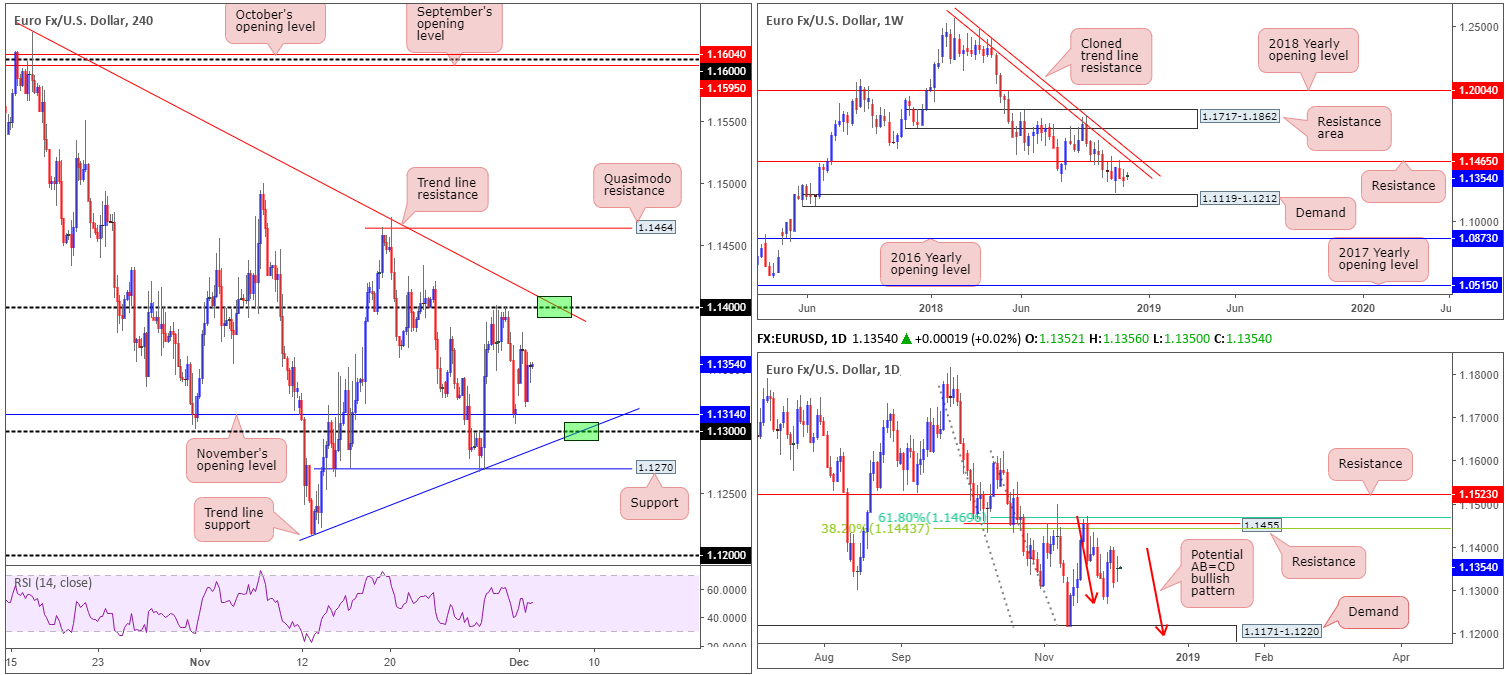
EUR/USD:
The single currency started the week on a strong footing, gapping over 30 pips north amid risk appetite. Weekend news witnessed US President Trump and Chinese President Xi announce a truce at the G20 where the US agreed to delay hiking tariffs on USD 200bln of Chinese goods to 25% for 90 days, paving the way for more trade discussions.
After clocking highs of 1.1379 in early European hours, however, upward momentum diminished. Price turned lower and filled the weekend gap in early US and settled around 1.1352 – 2 pips higher than the day’s opening number. According to H4 structure, there are two points of interest this morning (green). The first is the 114 handle, which, as you can see, intersects with a trend line resistance (extended from the high 1.1621). The second zone of interest falls in around 1.13. Not only does this level also have a supporting trend line (taken from the low 1.1215), it also has nearby support stationed just above at 1.1314 in the shape of November’s opening level.
Weekly flow, on the other hand, remains fixed on resistance priced in at 1.1465 (brings with it a nearby cloned trend line resistance [extended from the high 1.2413]), and demand coming in at 1.1119-1.1212. Closer attention to daily structure adds the possibility of an AB=CD bullish pattern (red arrows) developing this week, terminating within the upper limits of a demand drawn from 1.1171-1.1220 (glued to the top edge of the aforementioned weekly demand). If it follows the pair turns northbound prior to completing the harmonic formation, however, traders are urged to pencil in resistance at 1.1455 that merges closely with two Fibonacci resistances: a 61.8% and a 38.2% at 1.1469 and 1.1443, respectively.
Areas of consideration:
With 1.13 and 1.14 (on the H4) housing limited higher-timeframe convergence, we may only see a bounce from these zones. Conservative traders may opt to wait for additional confirmation by way of a candlestick signal. That way, traders will be able to observe buyer/seller intent and also have defined levels for entry and stop-loss orders. As for take-profit targets, ultimately, we would be looking for a bounce off 1.13 to reach 1.14ish and vice versa.
Today’s data points: FOMC Member Williams Speaks.
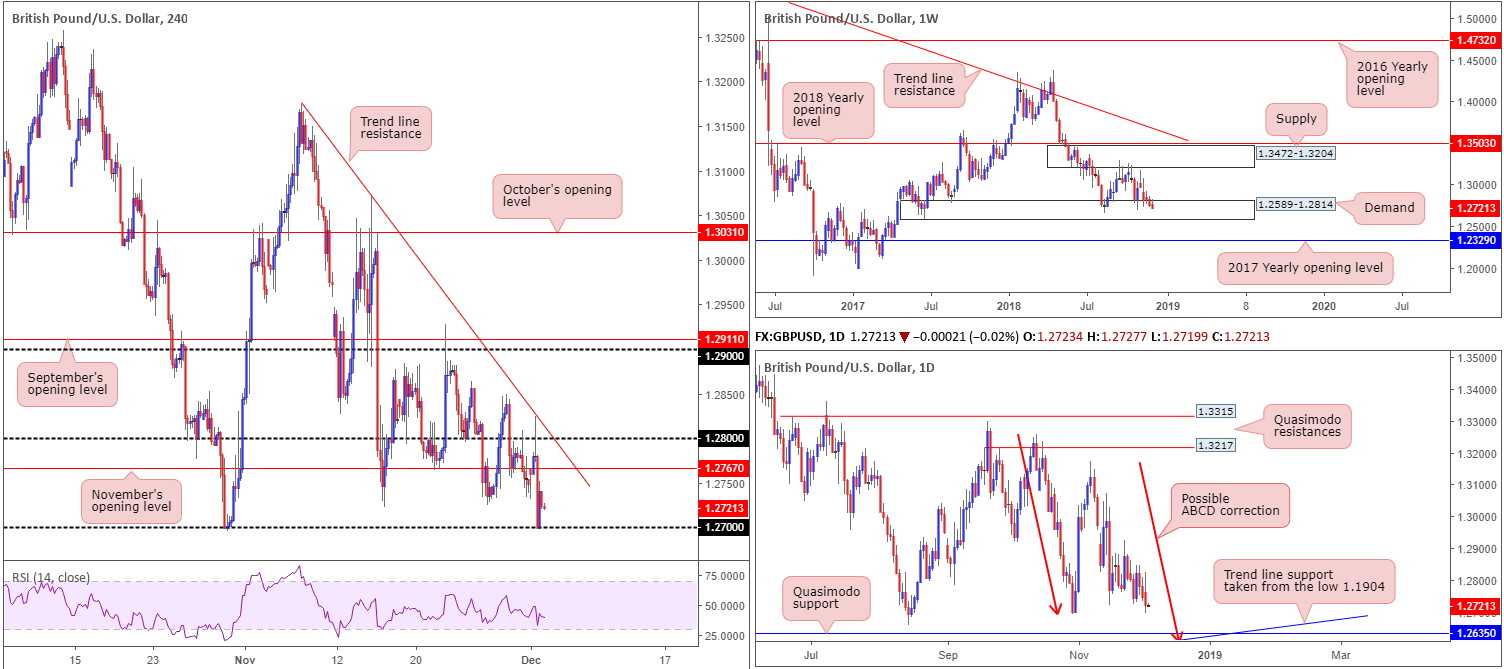
GBP/USD:
In similar fashion to the EUR/USD, the GBP/USD opened the week strongly. Asia/early Europe lifted cable through 1.28 to a high of 1.2824 – just missing the underside of the H4 trend line resistance (taken from the high 1.3174). Political headlines out of the UK hinting at the possibility of Parliament voting down PM May’s Brexit deal, however, weighed on market sentiment, consequently reclaiming recent gains and testing the 1.27 handle.
The story on the higher timeframes show weekly price remains within the walls of demand at 1.2589-1.2814. As of late, price action has failed to produce anything meaningful to the upside from the demand, consequently reflecting a bearish tone. Outside of the demand base, the 2017 yearly opening level at 1.2329 is seen as the next downside support target. In conjunction with weekly movement, daily flow suggests the pair might want to explore lower ground within the walls of the said weekly demand area. The candles, as you can see, are hovering north of the 1.2695 Oct 30 low. While a response from this neighbourhood is certainly possible, the Quasimodo support seen at 1.2635 remains a far more appealing level and may, therefore, drag the pair lower. Aside from 1.2635 fusing with trend line support (taken from the low 1.1904), the approach, should we push for lower levels, will form by way of an ABCD bullish pattern (red arrows) terminating just south at 1.2614.
Areas of consideration:
Ultimately, we feel 1.27 will be consumed, eventually leading to a move south towards the daily Quasimodo support mentioned above at 1.2635. A retest to the underside of 1.27 in the shape of a bearish candlestick configuration (entry/stop parameters can be defined according to this pattern) would, according to the overall technical picture, likely be enough to justify a sell.
Today’s data points: BoE Gov Carney Speaks; UK Construction PMI; MPC Member Vlieghe Speaks; FOMC Member Williams Speaks.
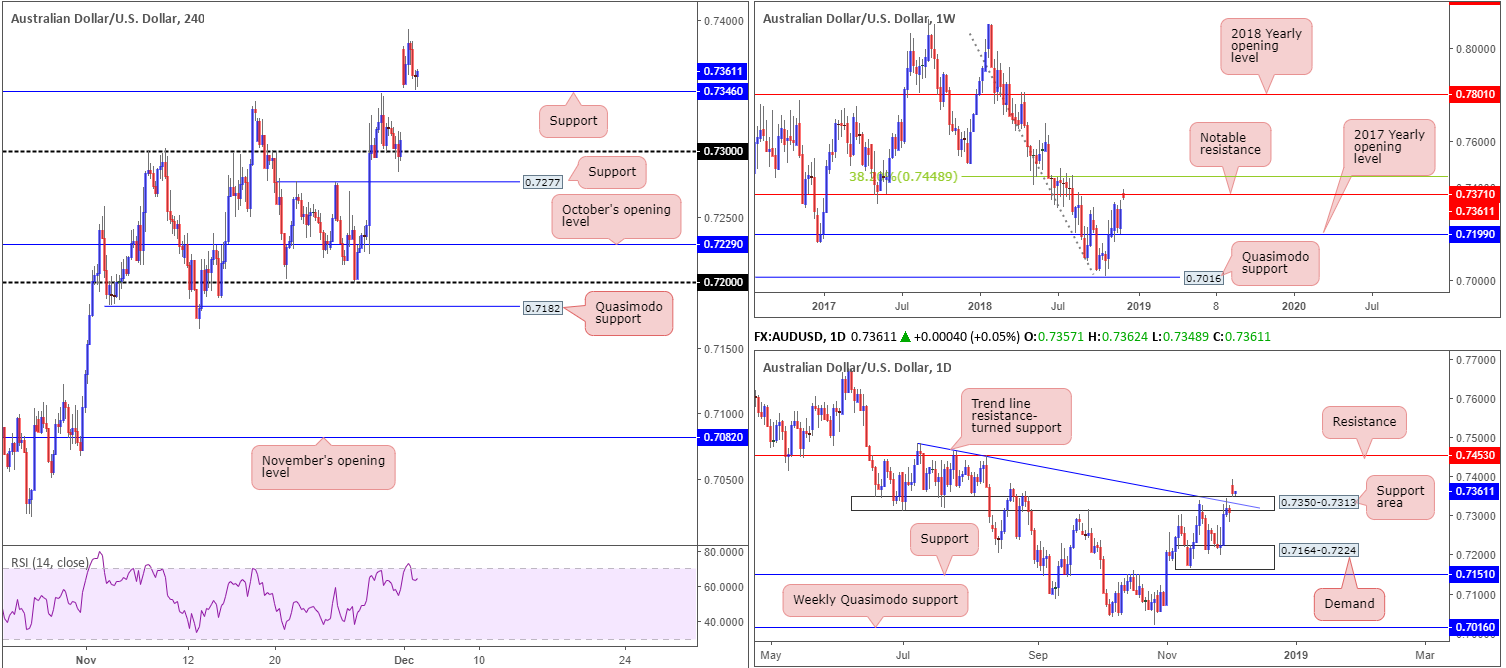
AUD/USD:
In wake of the accord between the US and China to hold off from further reciprocal import taxes for 3 months, the Australian dollar opened the week with a 70-pip bullish gap.
This, as can be seen on the weekly timeframe, transported the pair towards a notable resistance level at 0.7371. Positioned just south of a 38.2% Fibonacci resistance value at 0.7448, this level has served as a critical barrier in this market for a number of years, and, therefore, commands attention.
While weekly players may be looking for a selloff to occur, daily flow is seen testing the top edge of a support area coming in at 0.7350-0.7313, which happens to merge closely with a trend line resistance-turned support (extended from the high 0.7483). This, by and of itself, could be enough to hinder downside today/this week.
Across on the H4 timeframe, price action is seen hovering just north of support at 0.7346 (prior Quasimodo resistance). As you can probably see, this level is sited within the upper limit of the noted daily support area. Combined, there’s a healthy chance the unit could respond here and attempt to record fresh highs.
Areas of consideration:
Having seen weekly price fading a particularly significant resistance level at 0.7371, traders will need to tread carefully on a buy off the current H4 support level at 0.7346, despite it being located within a daily support area at 0.7350-0.7313.
To help overcome the threat of a selloff from weekly resistance, traders are urged to consider waiting and seeing if H4 price can chalk up a bullish candlestick configuration off 0.7346 prior to pulling the trigger. What this will do is inform traders there is likely bullish intent present here. It will also provide traders defined levels of entry and risk.
Today’s data points: RBA Rate Statement and AUD Cash Rate; FOMC Member Williams Speaks.
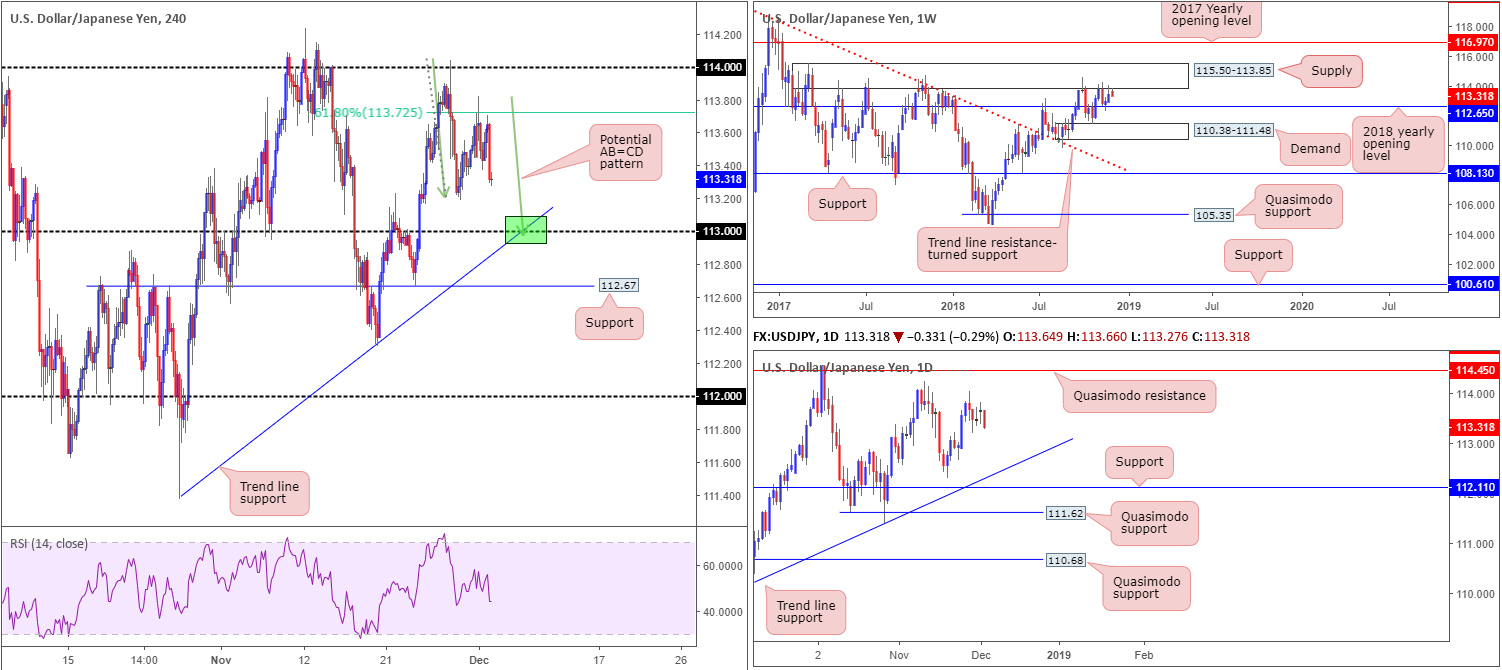
USD/JPY:
Price action employed a subdued approach Monday, concluding the day unchanged. In light of this, much of the following piece will echo thoughts put forward in yesterday’s briefing…
According to our technical reading on the H4 timeframe this morning, the candles draw attention to price fading a 61.8% Fibonacci resistance value at 113.72. Thanks to this, the research team has noted a potential AB=CD (green arrows) bullish pattern that completes at around the 113 handle and trend line support (extended from the low 111.37 – green). Should the H4 candle test the point at where the aforementioned three structures merge (green), this, by and of itself, is a high-probability area for a bounce higher.
Why only a bounce simply comes down to weekly price showing room to press as far south as its 2018 yearly opening level mentioned above at 112.65, which, as you can see, on the H4 timeframe merges closely with support at 112.67 and a 161.8% Fibonacci support. Further adding to this, daily structure displays room for the unit to stretch as far south as trend line support (extended from the low 109.77), which joins closely with support drawn from 112.11.
Areas of consideration:
If the H4 candles continue pressing for lower ground and completes the aforementioned AB=CD bullish pattern, a bounce higher is likely on the cards to at least 113.20ish. Longs from this level, therefore, remain of interest. Ideal entry comes in the form of a bullish candlestick signal, as this not only provides buyer intent, it also serves as a way of defining entry/stop parameters.
Today’s data points: FOMC Member Williams Speaks.
The use of the site is agreement that the site is for informational and educational purposes only and does not constitute advice in any form in the furtherance of any trade or trading decisions.
The accuracy, completeness and timeliness of the information contained on this site cannot be guaranteed. IC Markets does not warranty, guarantee or make any representations, or assume any liability with regard to financial results based on the use of the information in the site.
News, views, opinions, recommendations and other information obtained from sources outside of www.icmarkets.com.au, used in this site are believed to be reliable, but we cannot guarantee their accuracy or completeness. All such information is subject to change at any time without notice. IC Markets assumes no responsibility for the content of any linked site. The fact that such links may exist does not indicate approval or endorsement of any material contained on any linked site.
IC Markets is not liable for any harm caused by the transmission, through accessing the services or information on this site, of a computer virus, or other computer code or programming device that might be used to access, delete, damage, disable, disrupt or otherwise impede in any manner, the operation of the site or of any user’s software, hardware, data or property.


