
A note on lower timeframe confirming price action…
Waiting for lower timeframe confirmation is our main tool to confirm strength within higher timeframe zones, and has really been the key to our trading success. It takes a little time to understand the subtle nuances, however, as each trade is never the same, but once you master the rhythm so to speak, you will be saved from countless unnecessary losing trades. The following is a list of what we look for:
- A break/retest of supply or demand dependent on which way you’re trading.
- A trendline break/retest.
- Buying/selling tails/wicks – essentially we look for a cluster of very obvious spikes off of lower timeframe support and resistance levels within the higher timeframe zone.
- Candlestick patterns. We tend to only stick with pin bars and engulfing bars as these have proven to be the most effective.
For us, lower timeframe confirmation starts on the M15 and finishes up on the H1, since most of our higher timeframe areas begin with the H4. Stops usually placed 5-10 pips beyond your confirming structures.
EUR/USD:
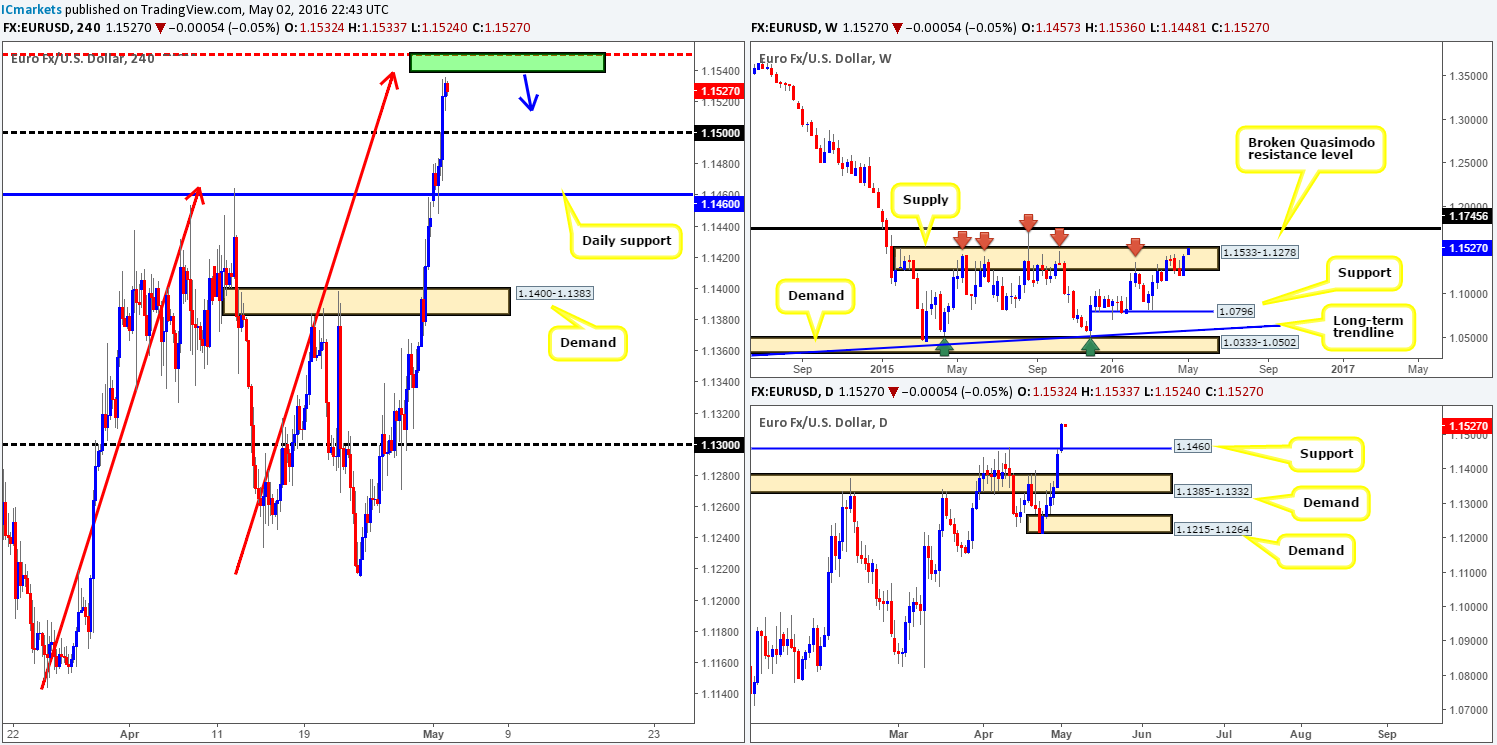
Following the open 1.1457 the single currency closed above and retested the daily resistance line at 1.1460 as support. From that point price advanced north, taking out psychological resistance 1.1500 and reaching highs of 1.1536 on the day.
Over on the weekly chart, this recent round of buying pushed the pair slightly beyond supply coming in at 1.1533-1.1278. In the event that the bulls continue to dominate, the next target above this zone falls in at a broken Quasimodo resistance line drawn from 1.1745. The daily chart on the other hand is a difficult one, due to price now seen loitering between resistance at 1.1645 and the recently broken resistance (now acting support) at 1.1460.
So where does one go from here? Well, with weekly action nibbling at the extremes of a major area of weekly supply at the moment (see above), we still favor lower prices from here. This – coupled with the H4 printing an AB=CD bearish pattern that completes around the 1.1540 mark, may be enough to consider looking to short today. The reason we use the word ‘may’ here simply comes down to the AB=CD pattern, although valid, is not as symmetrical as we would like it to be. Furthermore, let’s not forget that there’s little direction seen on the daily chart right now (see above).
Given the above points, our approach to this market today will be centered on the 1.1540/1550 region (green box) on the H4 for shorts. We would advise only selling here, however, should one manage to pin down a lower timeframe setup (for confirmation techniques, please see the top of this report) beforehand.
Levels to watch/live orders:
- Buys: Flat (Stop loss: N/A).
- Sells: 1.1550/1.1540 region [Tentative – confirmation required] (Stop loss: dependent on where one confirms this area).
GBP/USD:
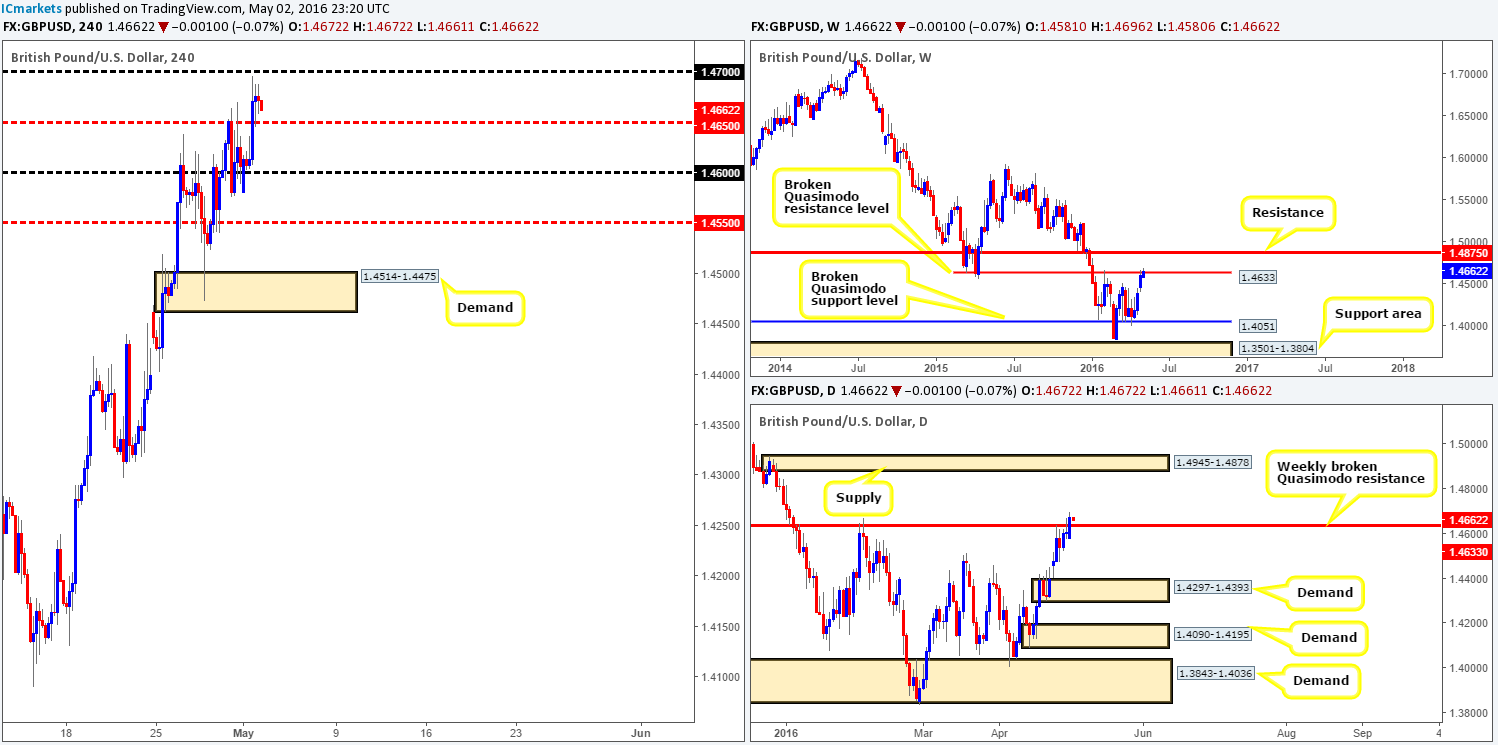
Similar to the EUR/USD, GBP/USD bulls also went on the offensive yesterday, bringing this market to highs of 1.4696, just below the psychological resistance barrier 1.4700. As we can see from the H4 chart, there is currently some indecision being seen between 1.4700 and the H4 mid-way support below at 1.4650. Since the overall trend on this timeframe is north, one would expect price to push higher. Nevertheless, let’s take a look to see how things stand on the higher-timeframe picture.
Up on the weekly chart, Cable is now seen trading above a weekly broken Quasimodo resistance level (BQRL) at 1.4633. Assuming that this break is legit, it is possible we may see a continuation move north towards weekly resistance coming in at 1.4875. Down on the daily chart, price has actually registered a close above the aforementioned weekly (BQRL), potentially opening up the path to daily supply drawn from 1.4945-1.4878 (sits just above the weekly resistance level mentioned above at 1.4875).
The best, and in our opinion, most logical path to take here would be to let the buyers prove their selves! What we mean by this is to wait and see if price can close above the 1.4700 handle on the H4 chart, as this would likely achieve two things:
- Confirm bullish strength on the break of the above said weekly (BQRL).
- Allow traders to take advantage of any (confirmed) retest seen at the 1.4700 line, as from this angle, the runway looks clear until 1.4800 (for confirmation techniques, please see the top of this report).
Levels to watch/live orders:
- Buys: Watch for price to close above 1.4700 and then look to trade any retest seen thereafter (lower timeframe confirmation required).
- Sells: Flat (Stop loss: N/A).
AUD/USD:
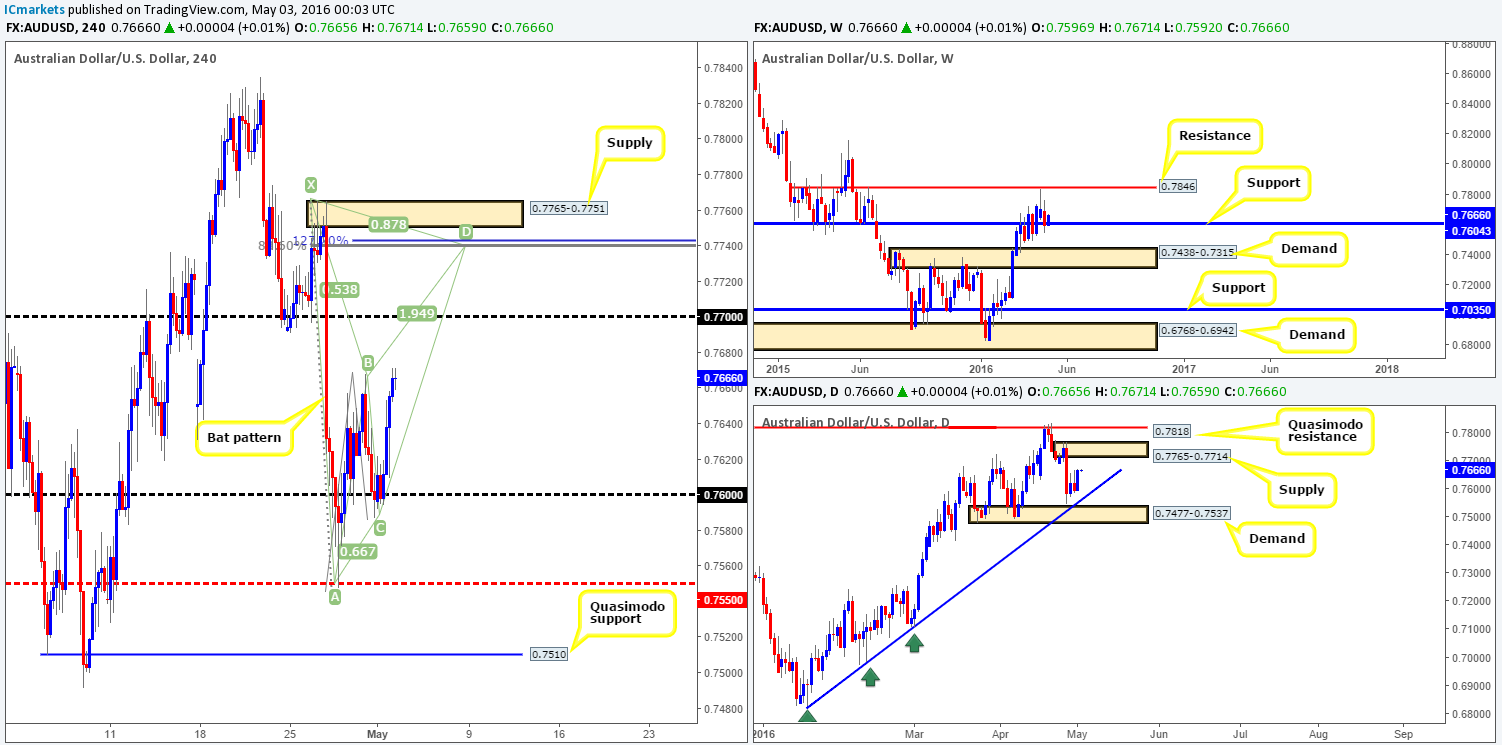
After price shook hands with the 0.7600 handle late last week a strong wave of bids came into this market yesterday, pushing price to highs of 0.7671 by the day’s end. What this also did was begin to form the D-leg of a potential H4 bearish Bat pattern which completes just below H4 supply (0.7765-0.7751) at around the 0.7740 mark. Technically, this H4 pattern also tops out deep within the confines of a daily supply zone coming in at 0.7765-0.7714, thus adding weight to this area. In view of the weekly chart, nonetheless, support at 0.7604 looks to be holding firm for now, which if this continues, could force this market up to as far as weekly resistance drawn from 0.7846.
So, with the technical picture in mind and an upcoming policy decision from the RBA just around the corner, what’s likely in store for this market today? Quite simply, one could, if patient enough to wait for the lower timeframe confirmation, look to short from the H4 Bat sell zone we discussed above. Irrespective if one waits for confirmation here or not, we would advise placing your stops above the current H4 supply at 0.7770. The reason we require confirmation here, however, should be clear. By selling from this region, one is effectively going against weekly flow (see above). In regards to confirmation, this could be in the form of an engulf of demand and subsequent retest as supply, a break/retest of a trendline or simply a collection of selling wicks around a lower-timeframe resistance.
Levels to watch/live orders:
- Buys: Flat (Stop loss: N/A).
- Sells: 0.7740 region [Tentative – confirmation required] (Stop loss: dependent on where one confirms this area).
USD/JPY:
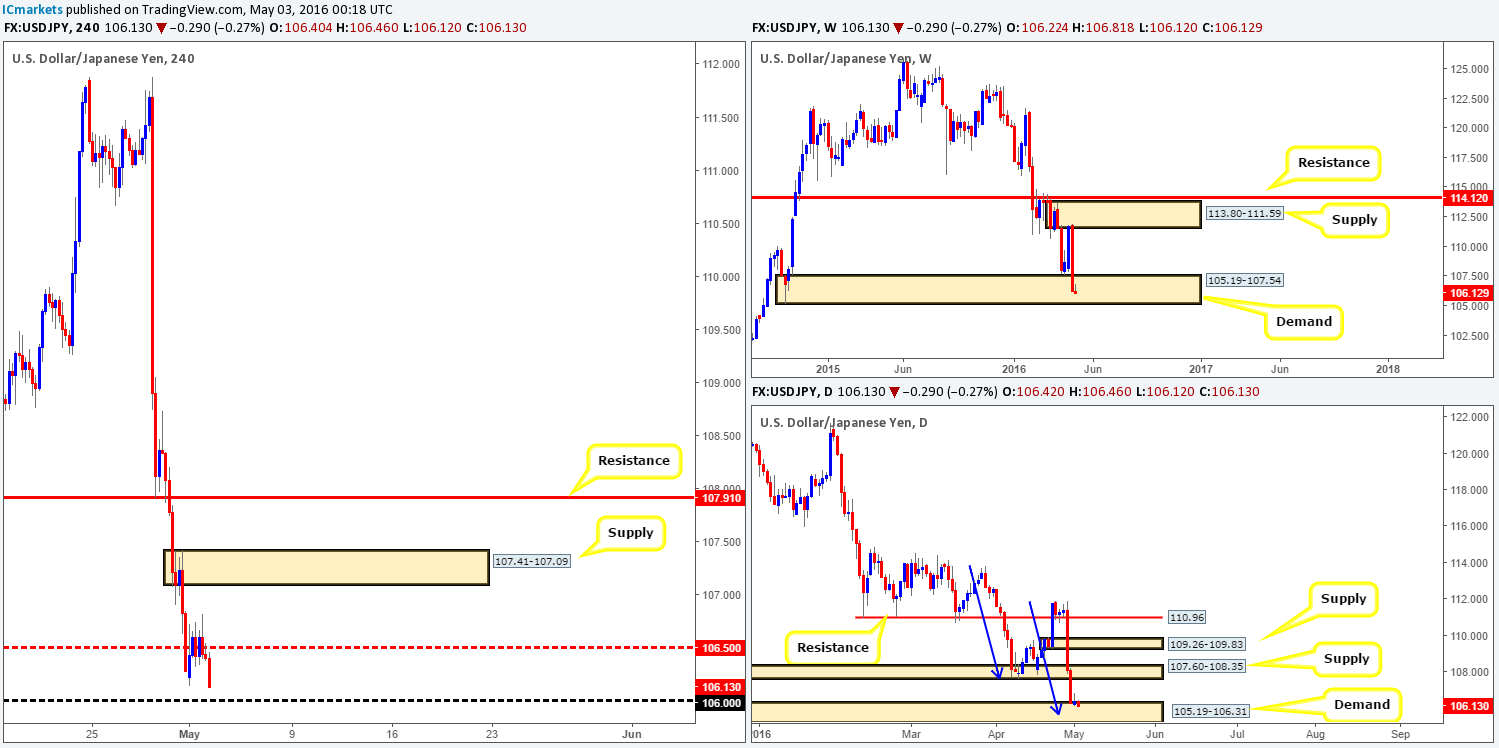
Despite the USD/JPY pair reaching highs of 106.81 going into yesterday’s American session, the day ended relatively unchanged. Consequent to this, much of the following report will echo similar thinking to Monday’s analysis…
From the weekly chart price is, thanks to last week’s 550-pip descent, now trading within the confines of a major weekly demand zone given at 105.19-107.54. In-line with the weekly timeframe, daily flow is also seen teasing the top-side of daily demand coming in at 105.19-106.31 (sits within the extremes of the aforementioned weekly demand). What is more, notice that the recent sell-off has potentially formed the D-leg of an AB=CD bullish approach completing around the 105.60 mark (see blue arrows), thus possibly adding more weight to a reversal being seen from here.
To our way of seeing things right now, our analysis is relatively straight forward. With both the weekly and daily charts seen trading around demand zones (see above), and the 106.00 handle lurking just below current price on the H4 with ‘trade me’ written all over it, we’re going to be looking to buy from this number today. One could, if they so wished simply place a pending buy order at this level and a stop below the higher-timeframe demands. However, this would equate to a hefty 80-pip stop and when buying could potentially halt around the H4 mid-way resistance 106.50 seen above, the risk/reward would not exactly be favorable. Our plan, therefore, is to simply watch the lower timeframe action around 106.00 today – if we manage to pin down a lower timeframe buy setup (for confirmation techniques, please see the top of this report), we’ll enter long, targeting 106.50 first and foremost, followed by H4 supply at 107.41-107.09 and then perhaps H4 resistance seen at 107.91 (sits within daily supply at 107.60-108.35).
Levels to watch/live orders:
- Buys: 106.00 region [Tentative – confirmation required] (Stop loss: dependent on where one confirms this area).
- Sells: Flat (Stop loss: N/A).
USD/CAD:
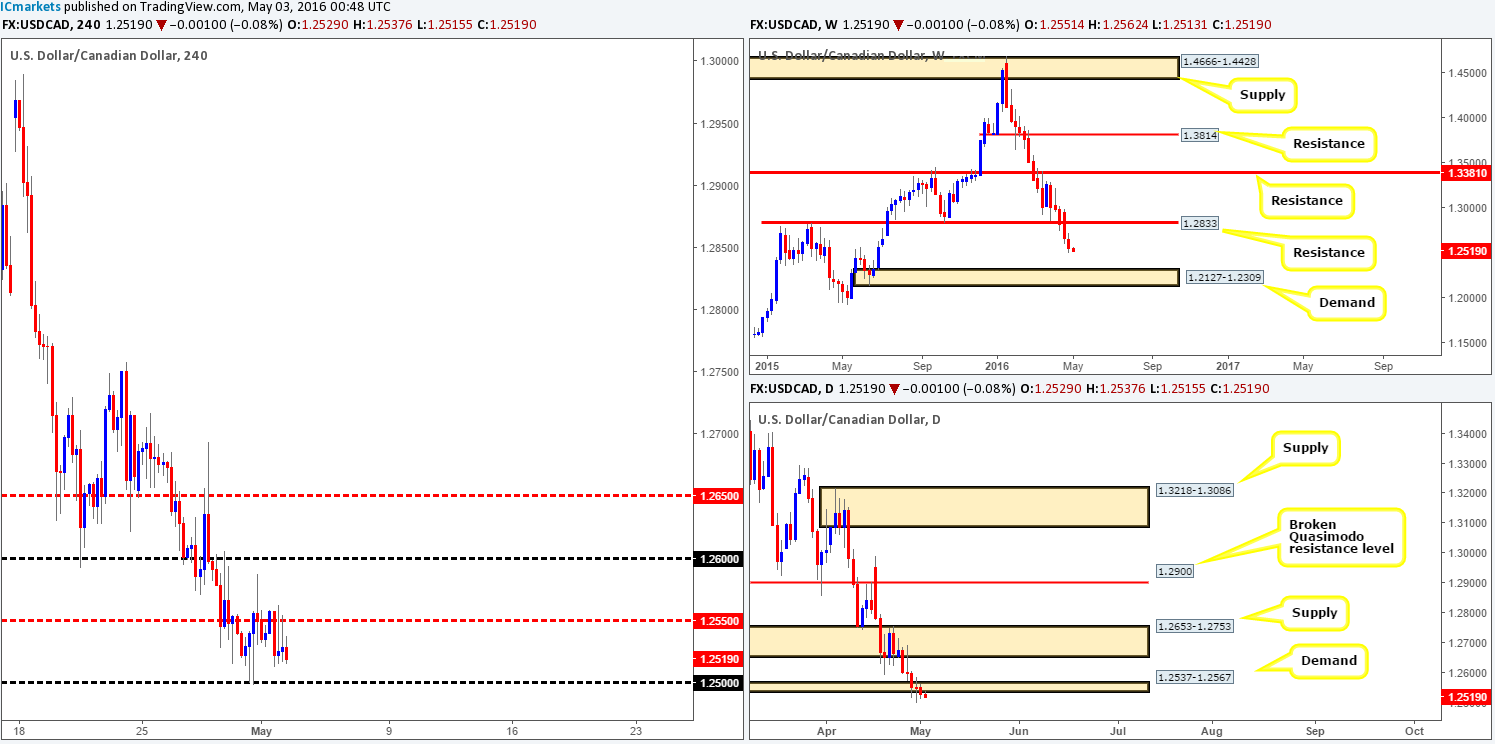
Trade was relatively quiet yesterday with price ranging just under fifty pips on the day. Because of this, much of the following analysis will be similar to Monday’s report…
Last week’s action posted its fifth consecutive loss erasing around 120 pips by the close. As is shown on the weekly chart, there’s still room seen for a possible continuation move south down towards demand at 1.2537-1.2567 which could potentially come into view this week! In-line with this expectation, daily demand at 1.2537-1.2567 looks to be well and truly consumed now. The two daily spikes seen through this zone as well as yesterday’s bearish close lower has likely cleared the road south (consumed stops below) to demand seen at 1.2309-1.2397, which sits on top of the aforementioned weekly demand.
Owing to both the weekly and daily charts suggesting that we may see the CAD continue to gain this week (see above), we have absolutely no interest in buying from the 1.2500 line on the H4. Instead, what we’re interested in is a break below this number! That way, traders can position themselves to take advantage of any (confirmed) retest that may be seen to the underside of this line (for confirmation techniques, please see the top of this report), targeting the 1.2400 level which, as you can probably see, sits three pips above the daily demand area at 1.2309-1.2397.
Levels to watch/live orders:
- Buys: Flat (Stop loss: N/A).
- Sells: Watch for price to close below the 1.2600 and look to trade any retest seen thereafter (lower timeframe confirmation required).
USD/CHF:
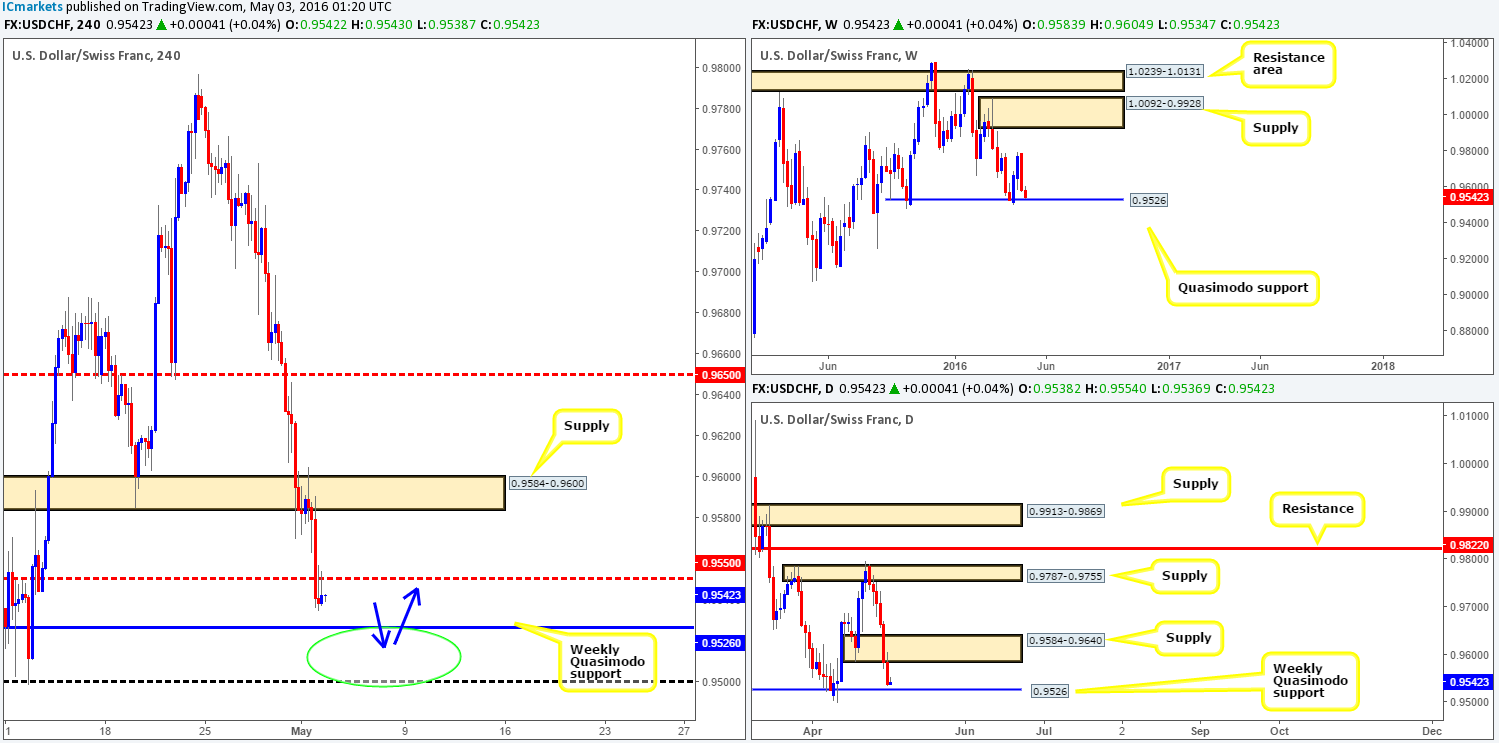
For those who read our previous report on the Swissy (see link below) you may recall us mentioning to watch for selling opportunities around H4 supply chalked up at 0.9584-0.9600. As you can see from the chart, the unit sold-off beautifully from this region! Well done to any of our readers who managed to board this train before it departed!
At the time of writing, however, the H4 is seen retesting the underside of the mid-way number 0.9550 as resistance, which will likely force the pair to connect with the weekly Quasimodo support line lurking just below at 0.9526. In light of this very clear structure, we feel this market is headed north.
However, the currency market, as most are already aware, is not an exact science! Fixed levels such as our weekly line above may not respond to-the-pip. Of course it is possible, but unlikely. Therefore, we have expanded our buy zone from the aforementioned weekly level to include the psychological support line 0.9500 (green circle). This will give traders far more room to decide if buying this market from here is the best choice (for confirmation techniques, please see the top of this report), rather than simply placing a pending buy order at the weekly level and hoping for the best!
In the event that our analysis above is correct, we’ll be looking to cash in partial profits around 0.9550 and reducing some risk, possibly to breakeven depending on the response from 0.9550.
Levels to watch/live orders:
- Buys: 0.9500/0.9526 [Tentative – confirmation required] (Stop loss: dependent on where one confirms this area).
- Sells: Flat (Stop loss: N/A).
DOW 30:
(Structure has been slightly revised)
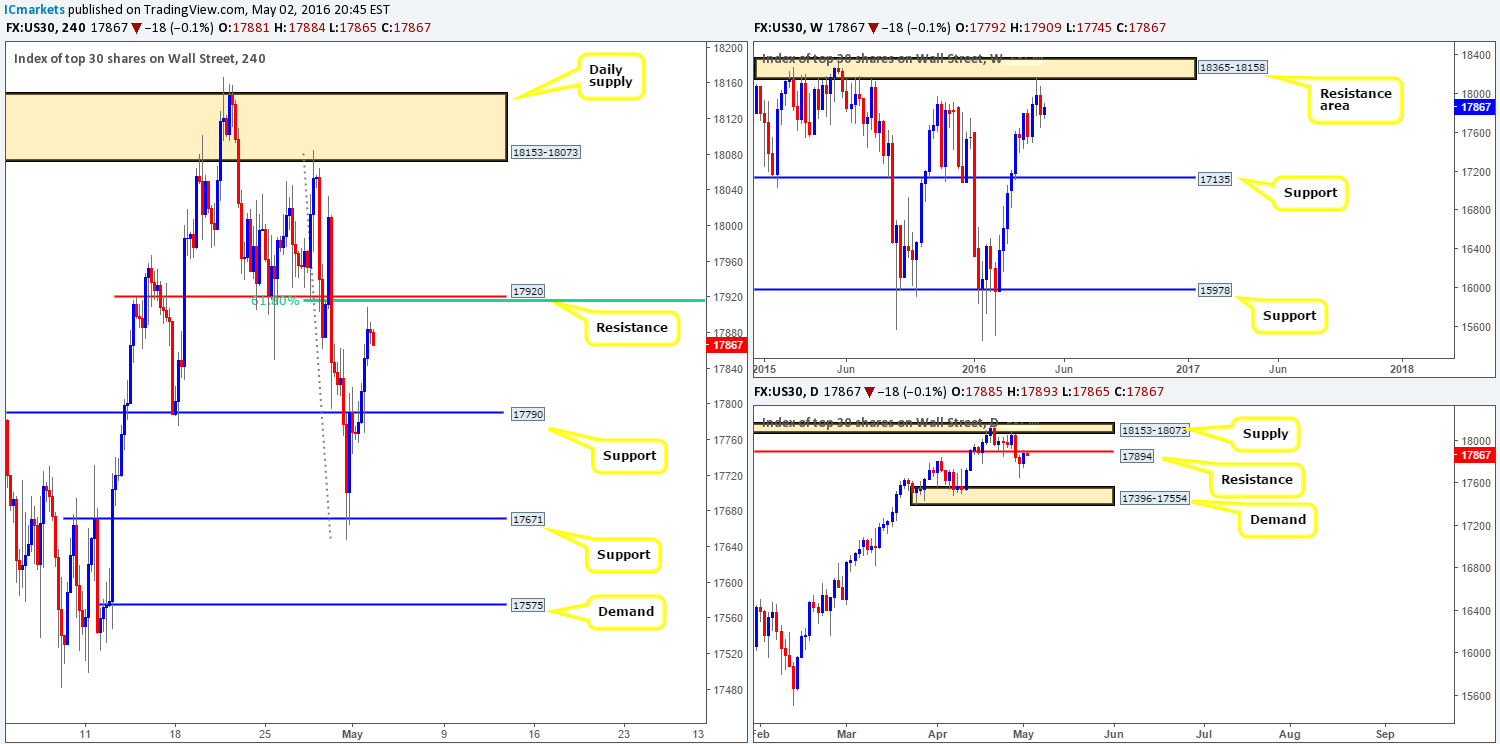
Starting from the top this morning, we can see that the DOW continues to trade from the underside of a weekly resistance area at 18365-18158. From weekly chart, the next obvious downside target comes in at 17135 – a clear support line. Climbing down to the daily chart, however, price is now seen tackling resistance drawn from 17894, which if holds firm, could potentially force price to test daily demand coming in at 17396-17554.
Stepping across to the H4 chart, price is trading just below H4 resistance coming in at 17920 which also, as you can see, boasts a 61.8% Fibonacci level at 17916. Given where price is positioned on the higher-timeframe picture (see above), the most logical place, as far as we can see, to look for a trade is around the 17920 region. Waiting for lower timeframe confirmation from here is advisable if you want to avoid any fakeout that may be seen (for confirmation techniques, please see the top of this report). The first take-profit line, for us at least, would be the H4 support at 17790.
Levels to watch/live orders:
- Buys: Flat (Stop loss: N/A).
- Sells: 17920 region [Tentative – confirmation required] (Stop loss: dependent on where one confirms this area).
GOLD:
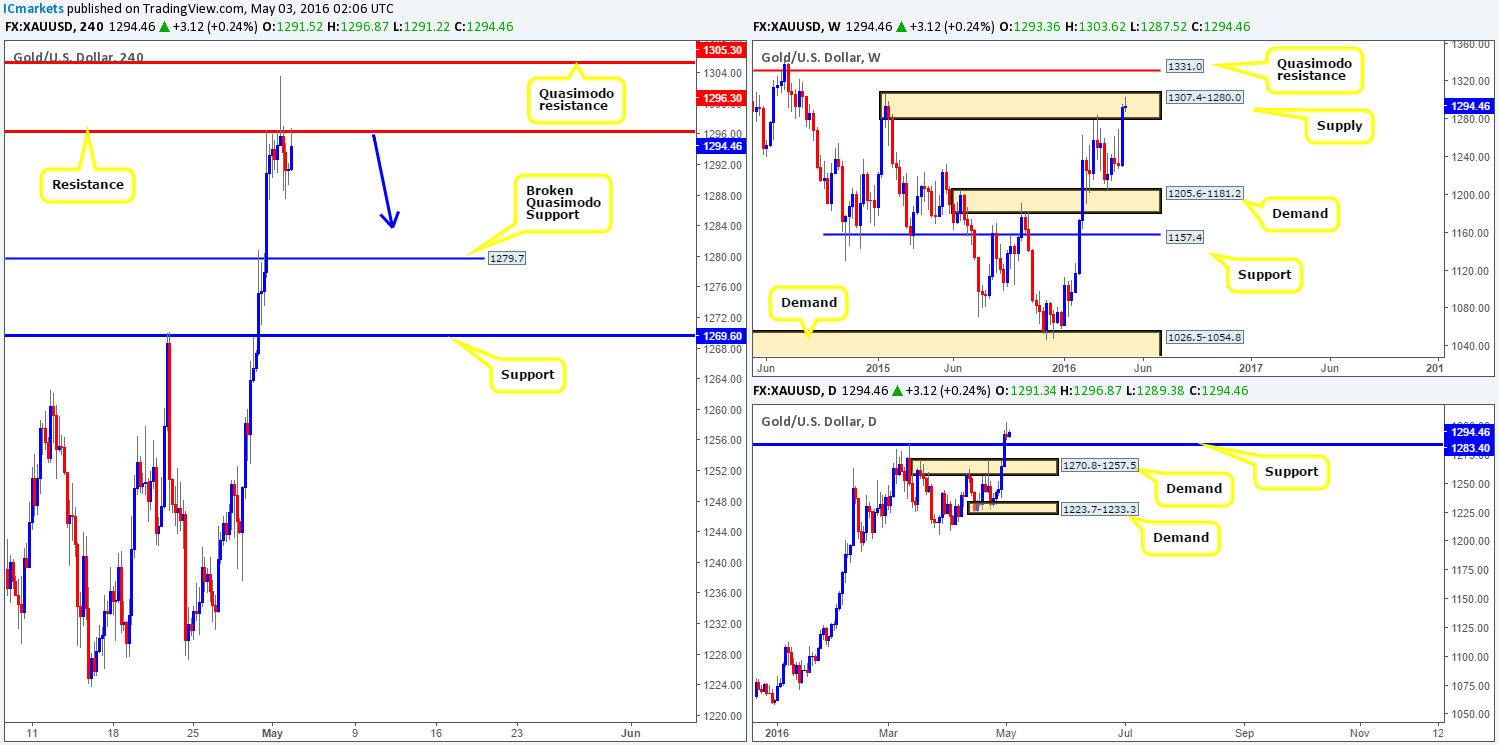
During the course of yesterday’s sessions, the yellow metal remained suppressed by the H4 resistance barrier at 1296.3. This did not stop the buyers from attempting to advance though! Going into the London session we saw a heavy round of bids enter the market, consequently pushing price above the current H4 resistance up to highs of 1303.6, before collapsing lower.
Considering price remains lodged beneath a H4 resistance line, where does our team stand in the bigger picture? Well, over on the weekly chart, it’s clear to see that Gold is housed within a weekly supply zone coming in at 1307.4-1280.0, with plenty of room seen below for price to move! This – coupled with the H4 picture is enough, in our opinion, to consider looking for a confirmed short trade (for confirmation techniques, please see the top of this report). However, with the next downside target on the H4 seen at 1279.7 – a broken Quasimodo support, price could potentially halt before this line. The reason for why simply comes down to support being seen on the daily chart at 1283.4! So be prepared to close out any short positions around this area as price could potentially reverse tracks! In the event that the precious metal continues to decline from here, the next take-profit target will be H4 support at 1269.0 which sits just within daily demand at 1270.8-1257.5 (seen below daily support at 1283.4).
Levels to watch/live orders:
- Buys: Flat (Stop loss: N/A).
- Sells: 1296.3 region [Tentative – confirmation required] (Stop loss: dependent on where one confirms this area).


