
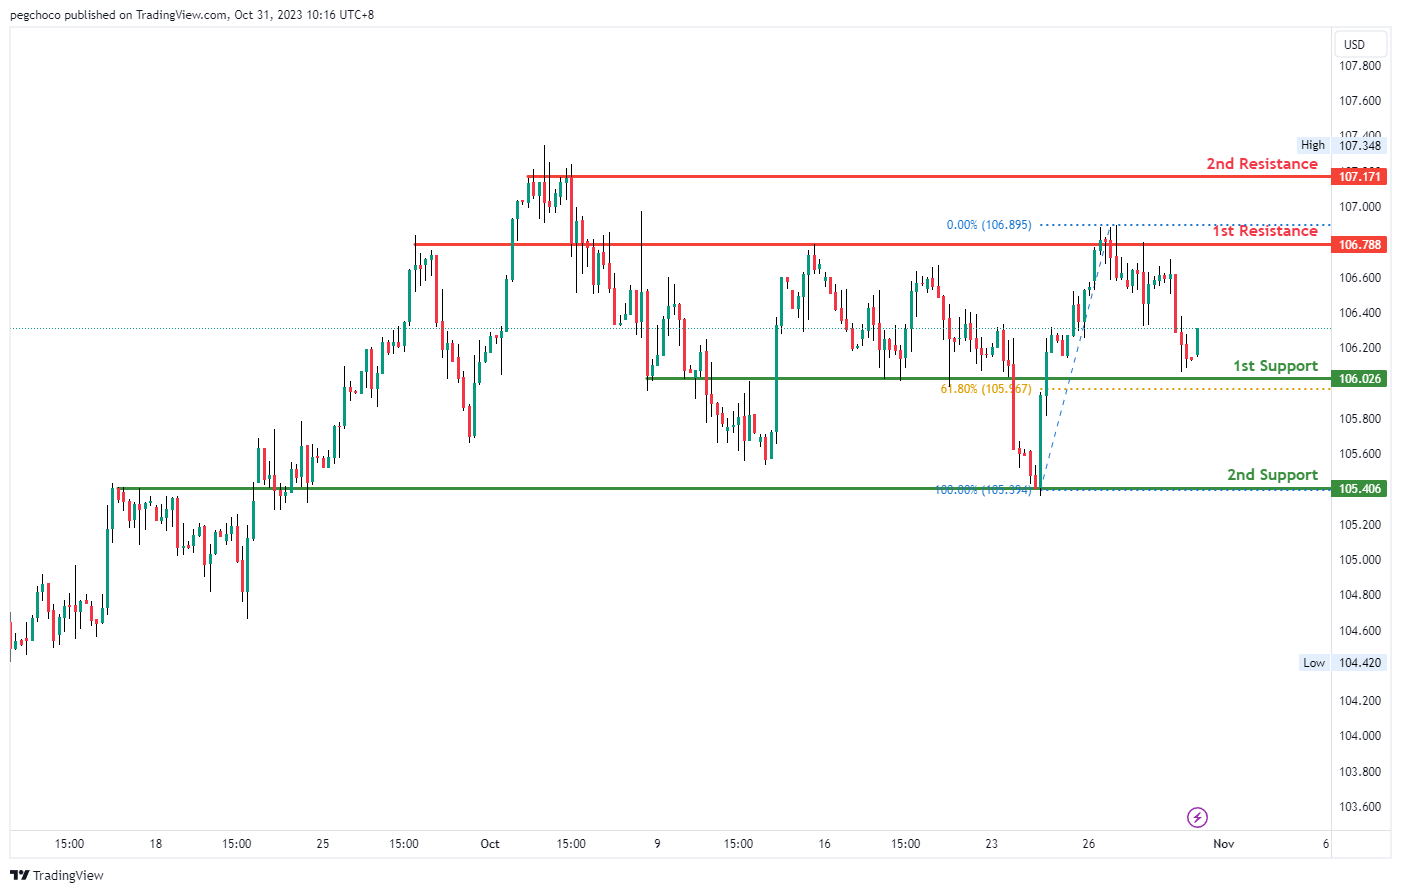
DXY:
The DXY chart currently indicates a bullish momentum, suggesting the potential for a bullish continuation towards the 1st resistance.
The 1st support at 106.02 is considered significant as it aligns with an overlap support and coincides with the 61.80% Fibonacci Retracement level, indicating its potential to act as a strong support level. Additionally, the 2nd support at 105.40 is identified as another overlap support, reinforcing the potential support zone.
On the resistance side, the 1st resistance at 106.78 is characterized as an overlap resistance, making it a potential barrier to further upward price movements. The 2nd resistance at 107.17 is noted as a multi-swing high resistance, further adding to its significance as a potential area of resistance.
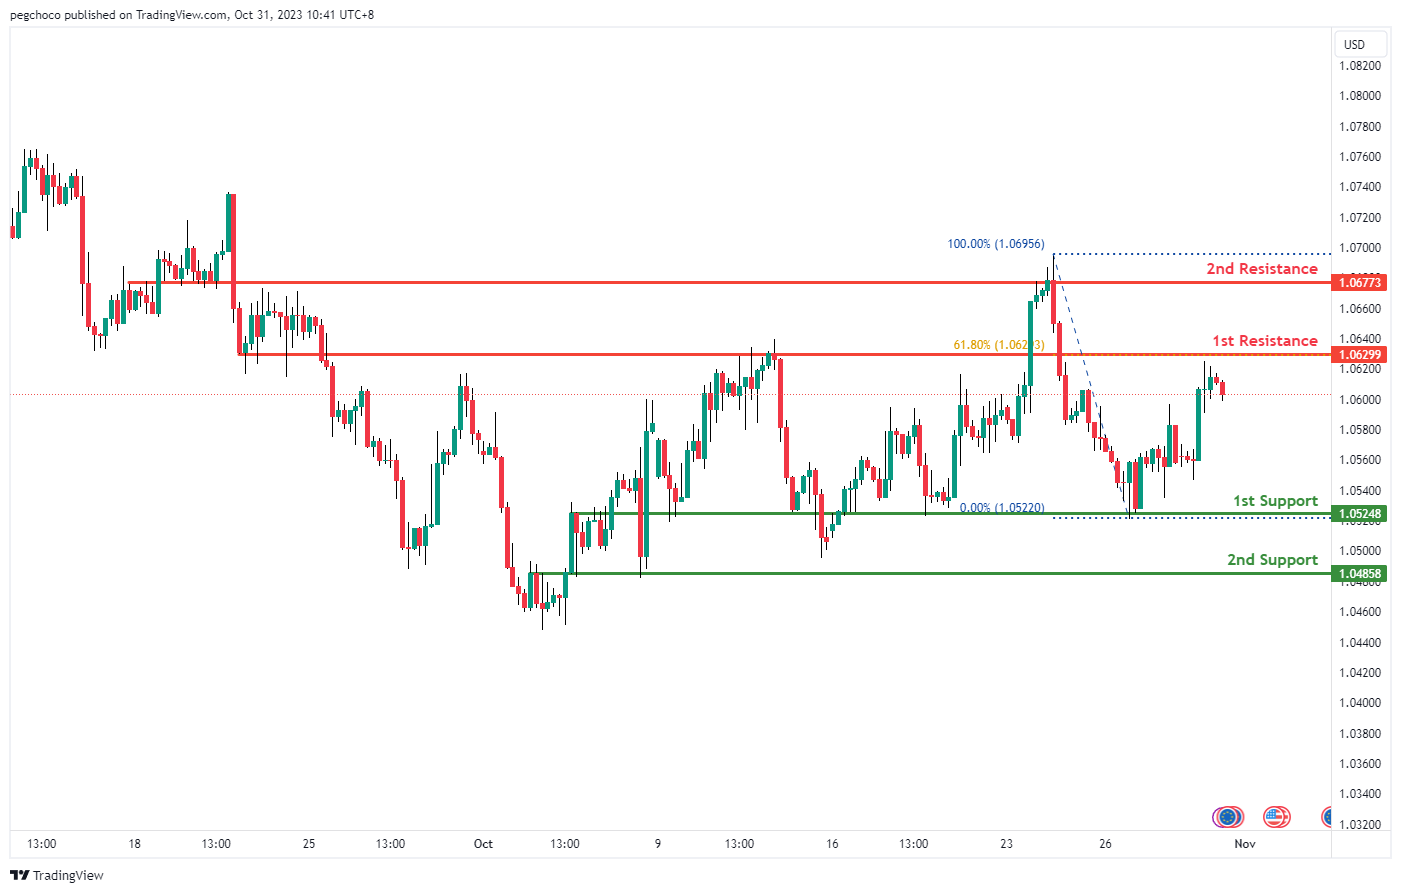
EUR/USD:
The EUR/USD chart currently demonstrates a bearish momentum, suggesting the potential for a bearish continuation towards the 1st support.
The 1st support at 1.0524 is considered significant as it aligns with an overlap support, indicating its potential to act as a strong support level. Additionally, the 2nd support at 1.0485 is identified as another overlap support, reinforcing the potential support zone.
On the resistance side, the 1st resistance at 1.0629 is characterized as an overlap resistance and coincides with the 61.8% Fibonacci Retracement level, making it a strong potential barrier to any notable upward price movement. The 2nd resistance at 1.0677 is also noted as an overlap resistance, adding to its significance as a potential area where selling pressure may emerge.
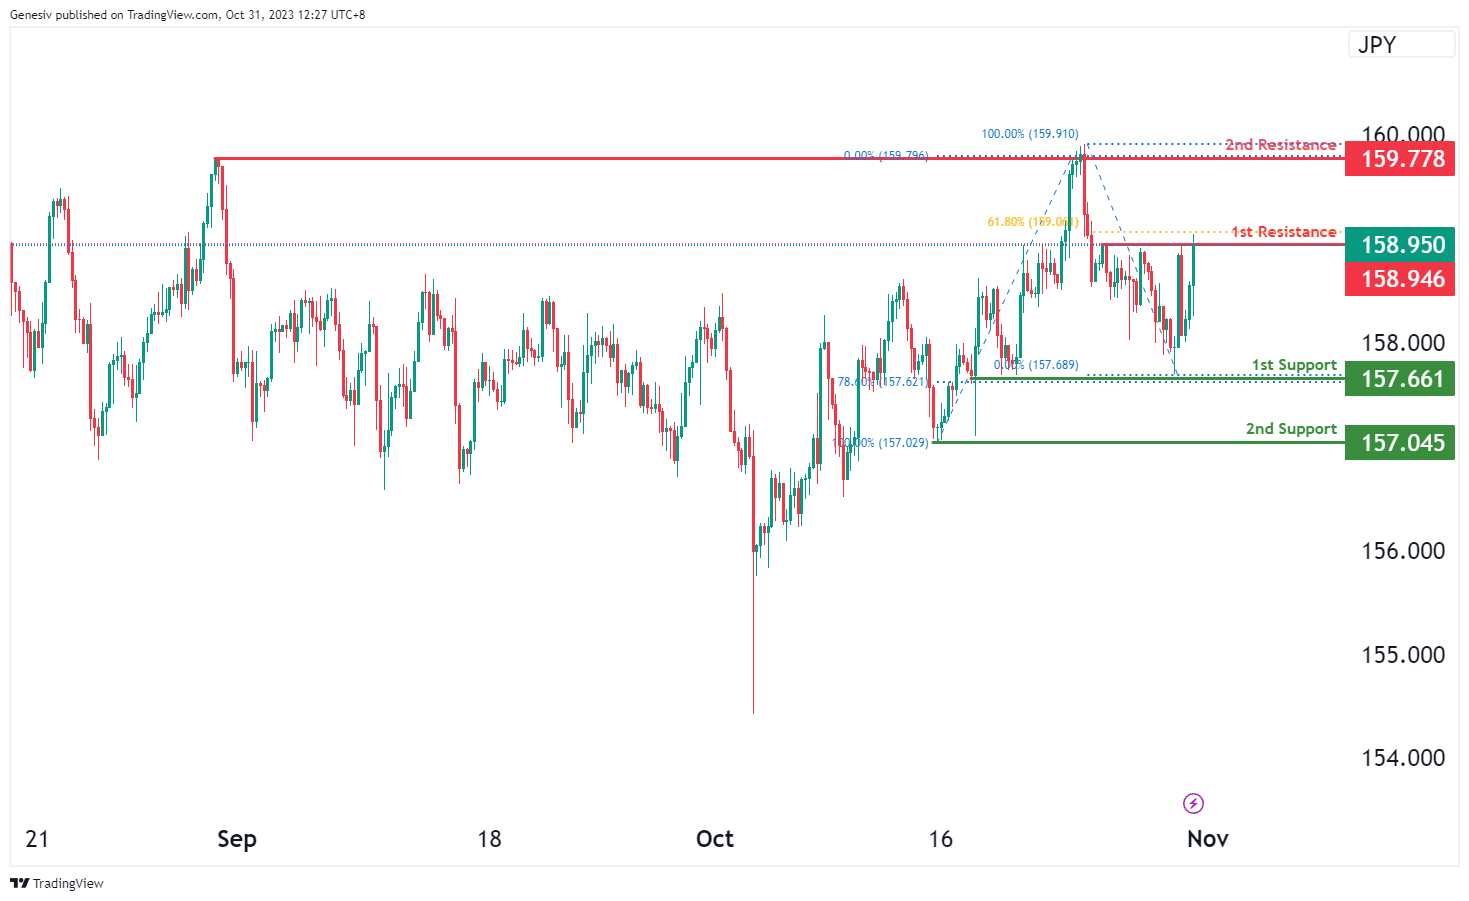
EUR/JPY:
For EUR/JPY, the current chart reflects a bearish overall momentum, indicating the potential for a bearish reaction off the first resistance at 158.94, possibly leading to a drop towards the first support at 157.66.
The first support at 157.66 is considered a robust level due to its multi-swing low support characteristics and the presence of the 78.60% Fibonacci Retracement, establishing a notable level of potential support.
The second support at 157.04 is also significant, featuring swing low support, potentially providing an additional layer of support.
On the resistance side, the first resistance at 158.94 is marked by its multi-swing high resistance characteristics and is associated with the 61.80% Fibonacci Retracement, indicating a significant level of resistance. The second resistance at 159.77 is noteworthy for its multi-swing high resistance attributes, presenting another important level of resistance.
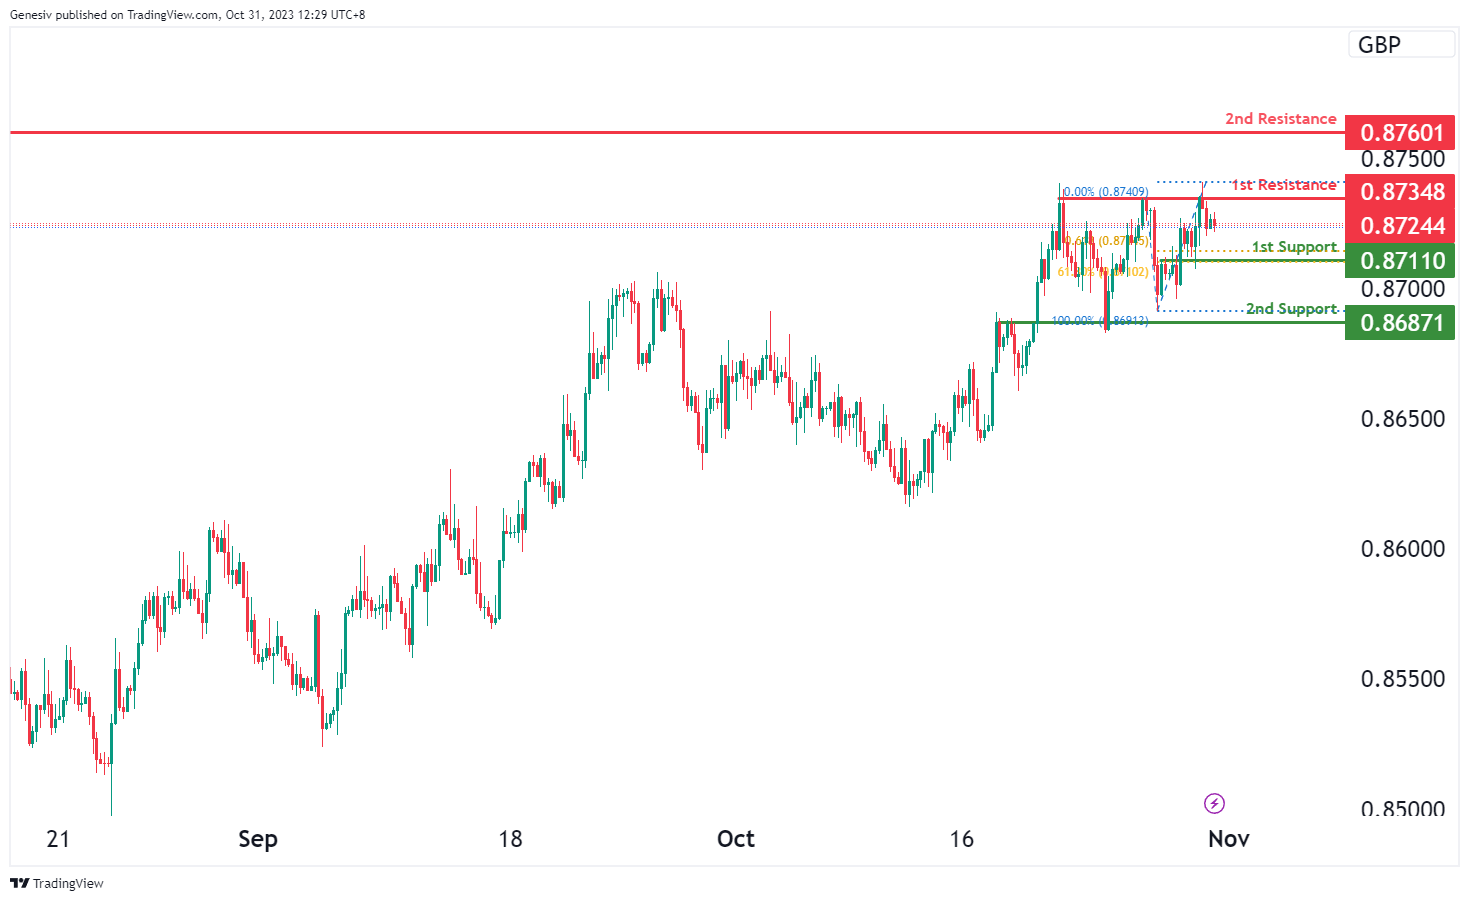
EUR/GBP:
For EUR/GBP, the chart indicates a bearish overall momentum, suggesting a potential bearish continuation towards the first support at 0.8711.
The first support at 0.8711 is deemed strong due to its overlap support characteristics and the presence of the 61.80% Fibonacci Retracement, combined with the 61.80% Fibonacci Projection, indicating Fibonacci confluence. This convergence reinforces its significance as a level of potential support.
The second support at 0.8687 is also an overlap support, providing an additional layer of potential support for the price.
On the resistance side, the first resistance at 0.8734 is marked by multi-swing high resistance characteristics, representing a notable level of resistance.
The second resistance at 0.8760 is noteworthy for its overlap resistance attributes, presenting another important level of resistance for price movements.
.
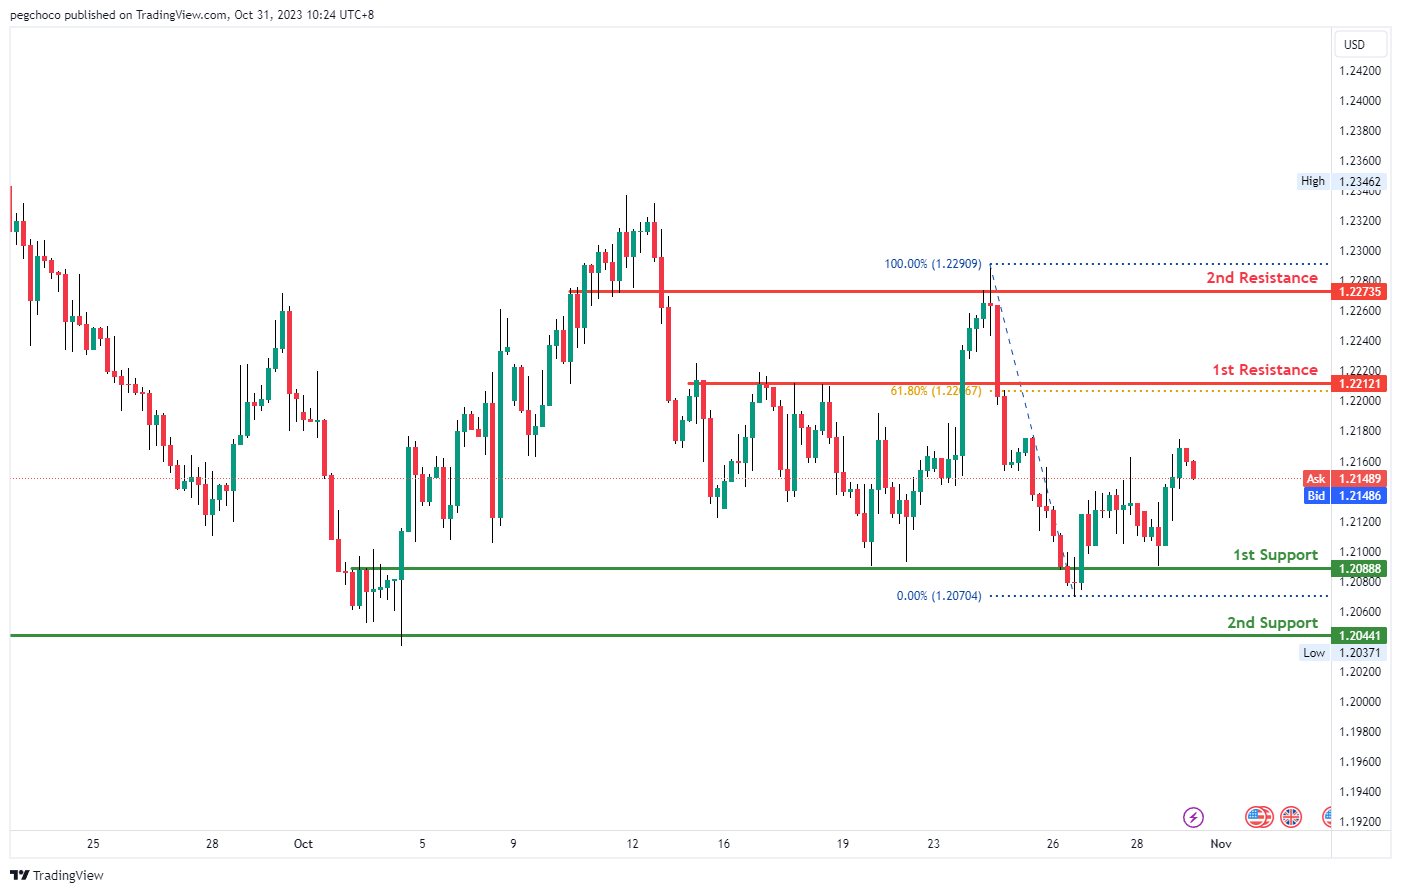
GBP/USD:
The GBP/USD chart currently exhibits a bullish momentum, indicating the potential for a bullish continuation towards the 1st resistance level at 1.2212.
The 1st support at 1.2088 is considered significant as it aligns with an overlap support, indicating its potential to act as a strong support level. Additionally, the 2nd support at 1.2044 is also identified as an overlap support, reinforcing the potential support zone.
On the resistance side, the 1st resistance at 1.2212 is characterized as a pullback resistance and coincides with the 61.80% Fibonacci Retracement level, making it a strong potential barrier to upward price movement. The 2nd resistance at 1.2273 is also noted as an overlap resistance, adding to its significance as a potential area where selling pressure may emerge. Given the overall bullish momentum, there’s a likelihood of price continuing its upward trajectory towards these resistance levels.
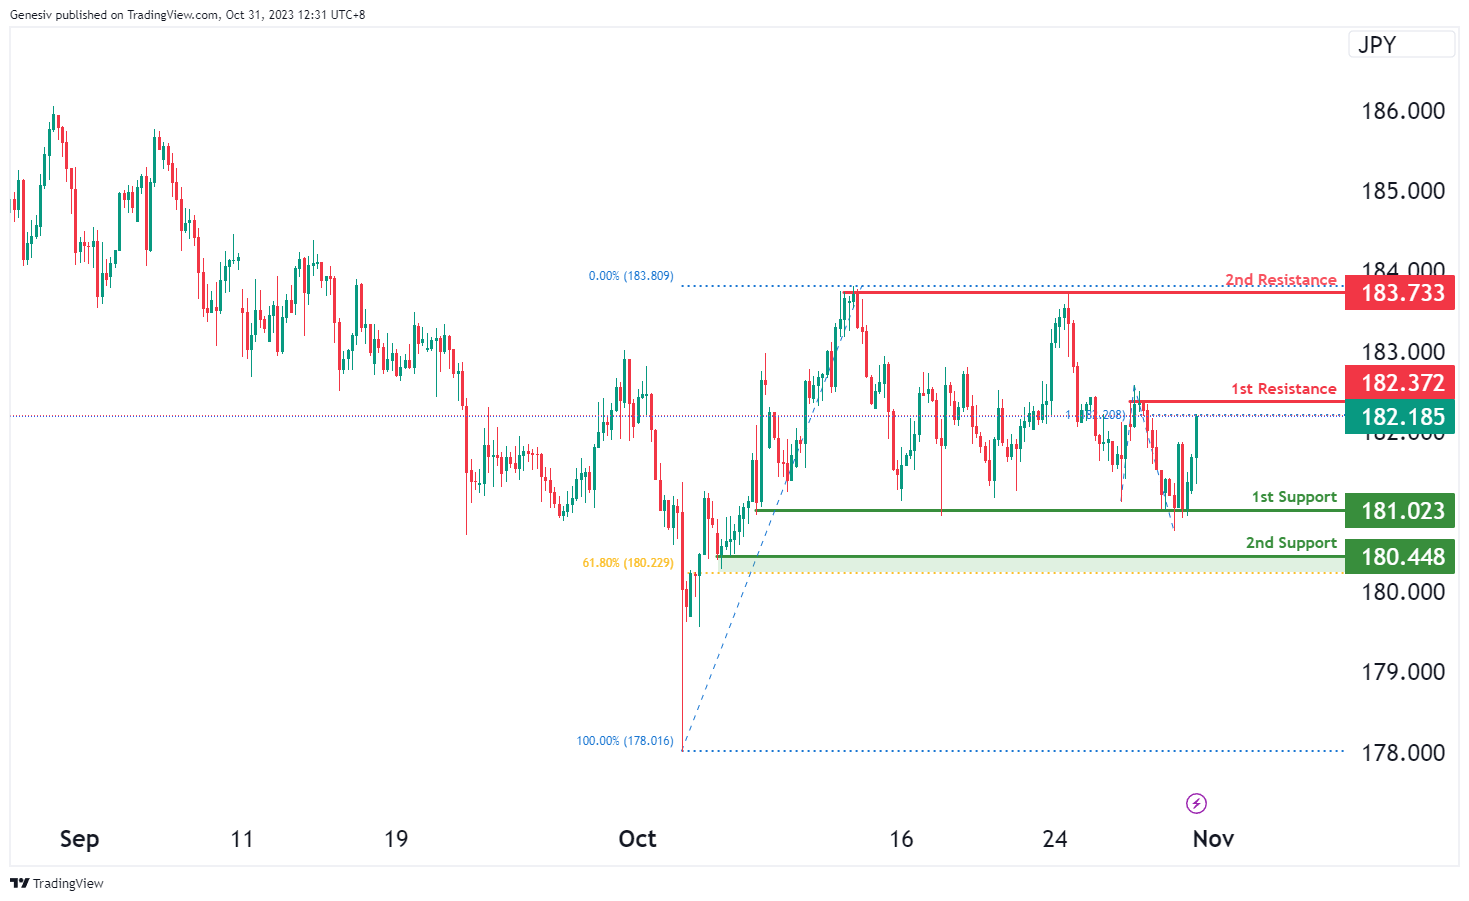
GBP/JPY:
For GBP/JPY, the chart reflects a bearish overall momentum, indicating the potential for a rise towards the first resistance at 182.37 in the short term before reversing off it and dropping towards the first support at 181.02.
The first support at 181.02 is considered a significant level due to its multi-swing low support characteristics, potentially offering strong support for the price.
The second support at 180.44 is also notable as it represents swing low support and is associated with the 61.80% Fibonacci Retracement, adding further strength to its support level.
On the resistance side, the first resistance at 182.37 is marked by swing high resistance and is linked with the 61.80% Fibonacci Retracement, indicating a notable level of resistance.
The second resistance at 186.47 represents swing high resistance and is associated with the 100% Fibonacci Projection, indicating another critical level of resistance in the chart.
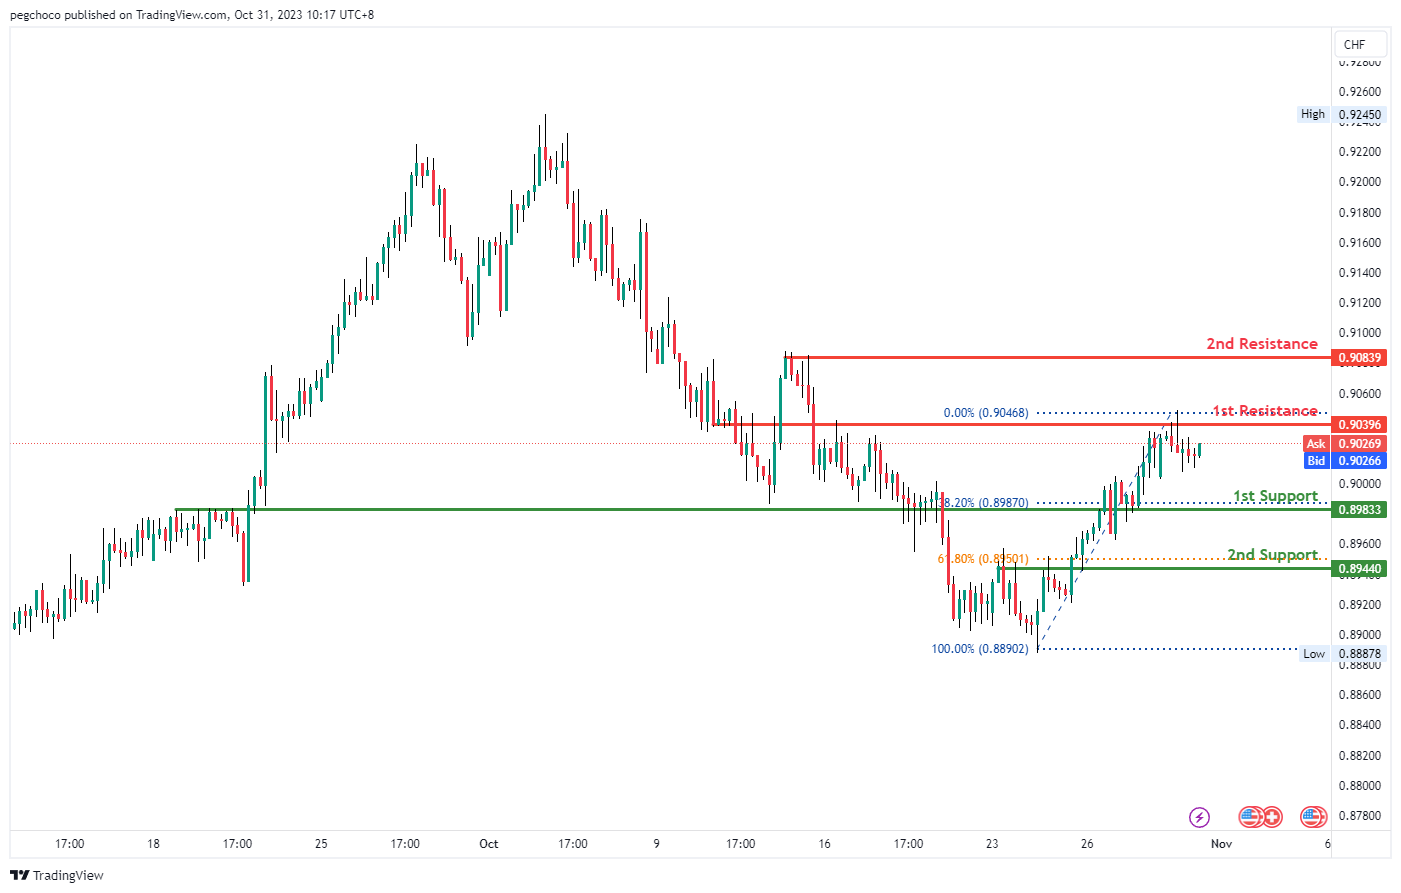
USD/CHF:
The USD/CHF chart currently shows a bearish momentum, suggesting the potential for a bearish reaction off the 1st resistance level at 0.9039, followed by a drop towards the 1st support level at 0.8983.
The 1st support at 0.8983 is considered significant as it aligns with a pullback support and coincides with the 38.20% Fibonacci Retracement level, indicating its potential to act as a strong support level. Additionally, the 2nd support at 0.8944 is identified as an overlap support and aligns with the 61.80% Fibonacci Retracement, further reinforcing the potential support zone.
On the resistance side, the 1st resistance at 0.9039 is characterized as an overlap resistance, making it a strong potential barrier to upward price movement. The 2nd resistance at 0.9083 is also noted as a multi-swing high resistance, adding to its significance as a potential level where selling pressure may emerge. Given the overall bearish momentum, there’s a likelihood of price reacting to these resistance levels and heading towards the support levels mentioned.
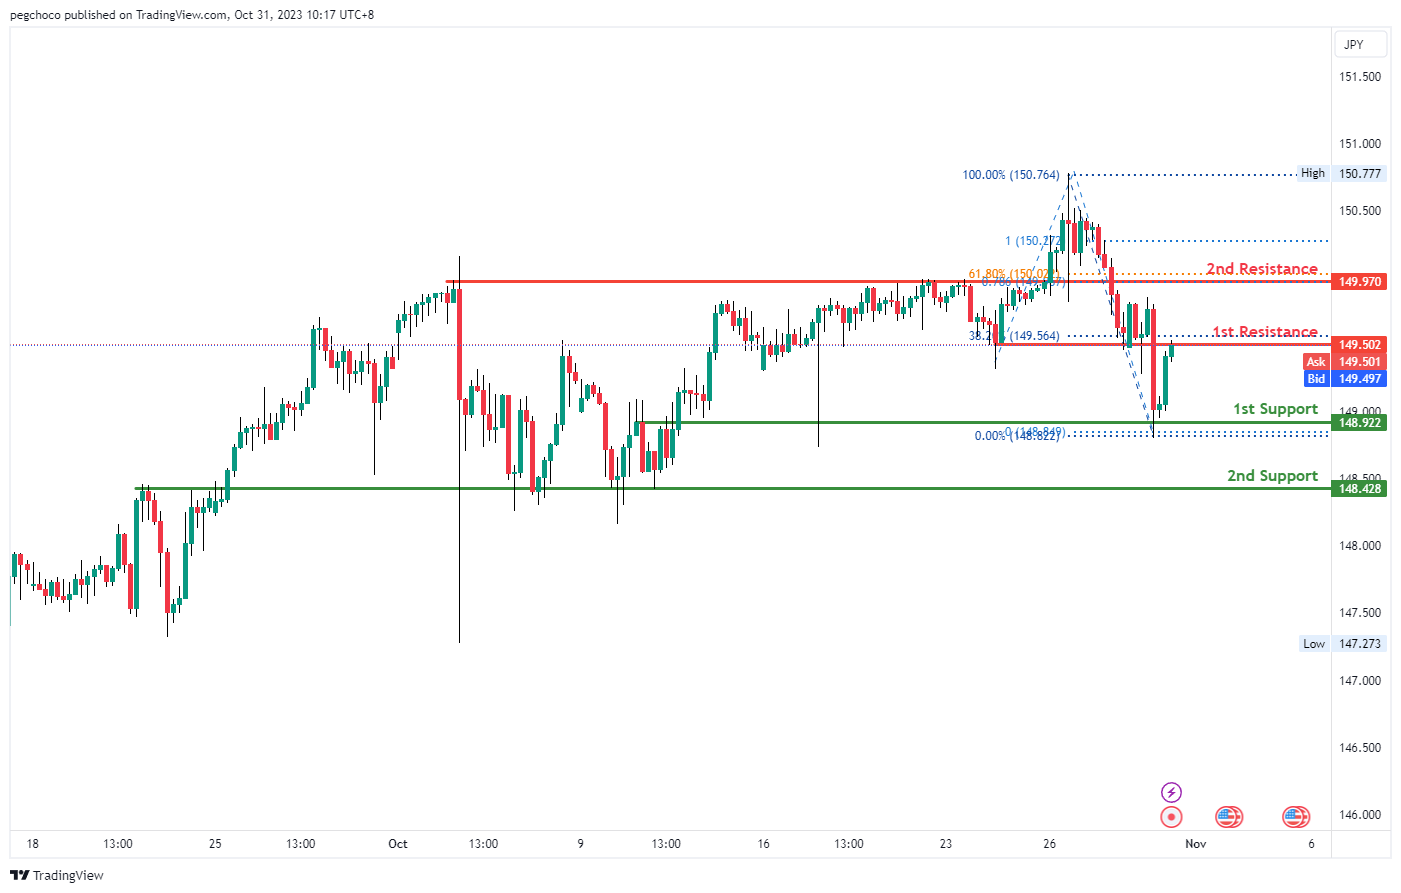
USD/JPY:
The USD/JPY chart currently exhibits a bearish momentum, suggesting the potential for a bearish reaction off the 1st resistance level at 149.50, followed by a drop towards the 1st support level at 148.92.
The 1st support at 148.92 is considered significant as it aligns with an overlap support, indicating its potential to act as a strong support level. Additionally, the 2nd support at 148.42 is also identified as an overlap support, reinforcing the potential support zone.
On the resistance side, the 1st resistance at 149.50 is characterized as an overlap resistance and coincides with the 38.20% Fibonacci Retracement level, making it a strong potential barrier to upward price movement. The 2nd resistance at 149.97 is noteworthy as it aligns with an overlap resistance, the 78.60% Fibonacci Projection, and the 61.80% Fibonacci Retracement, indicating a significant level of Fibonacci confluence
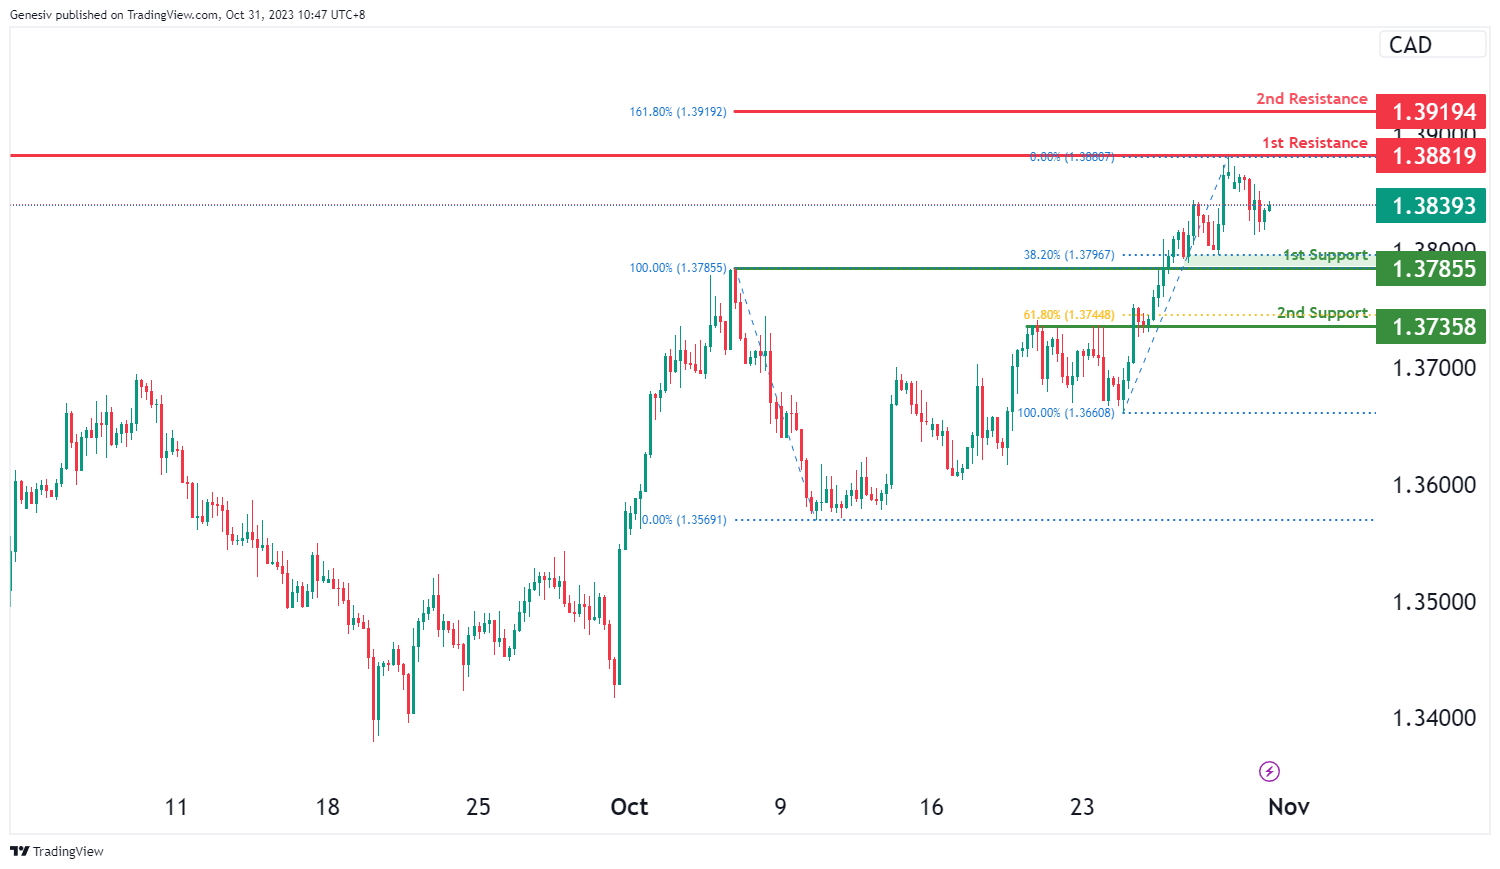
USD/CAD:
The USD/CAD chart currently demonstrates an overall bullish momentum. There is a potential scenario for price to make a bullish continuation towards the 1st resistance.
The 1st resistance level at 1.3882 is identified as a pullback resistance. Beyond that, the 2nd resistance level at 1.3919 is marked as a resistance that aligns with the 161.80% Fibonacci extension level, further reinforcing the potential for resistance in that region.
To the downside, the 1st support level at 1.3786 is identified as an overlap support that aligns with the 38.20% Fibonacci retracement level. Further below, the 2nd support level at 1.3736 is also noted as an overlap support that aligns with the 61.80% Fibonacci retracement level, indicating a potential area of price support.
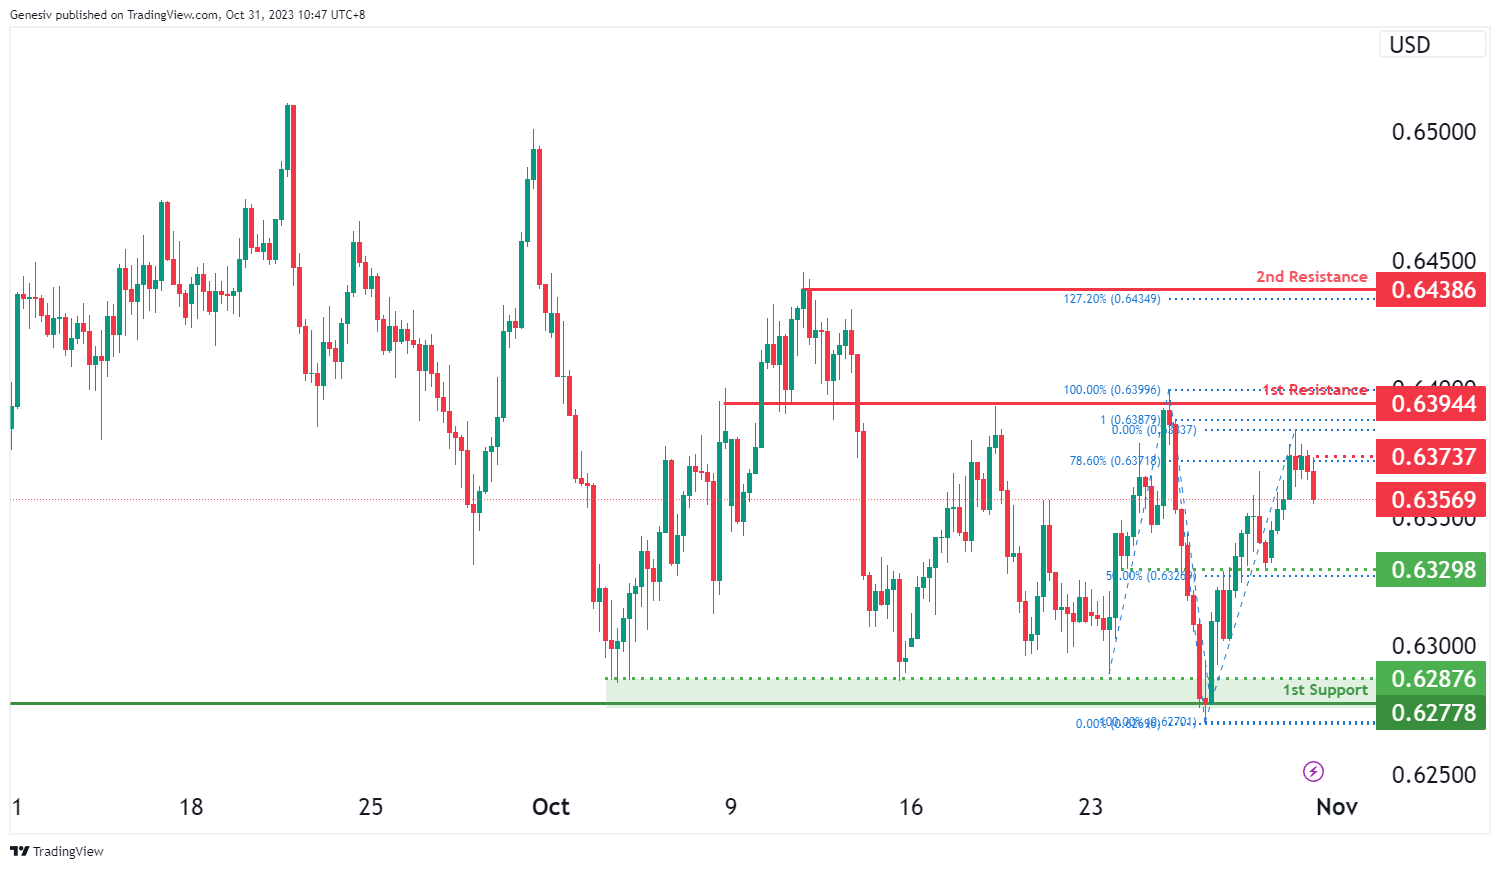
AUD/USD:
The AUD/USD chart currently exhibits an overall bearish momentum. There is a potential scenario for price to break below the intermediate support and make a bearish continuation towards the 1st support.
The intermediate support level at 0.6329 is identified as an overlap support that aligns with the 50.00% Fibonacci retracement level. The 1st support level at 0.6278 is marked as a multi-swing-low support, indicating its potential as a strong level of price support.
On the resistance side, the intermediate resistance level at 0.6374 is identified as an pullback resistance that aligns with the 78.60% Fibonacci retracement level while the 1st resistance level at 0.6394 is noted as an overlap resistance that aligns close to the 100.00% Fibonacci projection level. Higher up, the 2nd resistance level at 0.6439 is identified as a swing-high resistance that aligns with the 127.20% Fibonacci extension level.
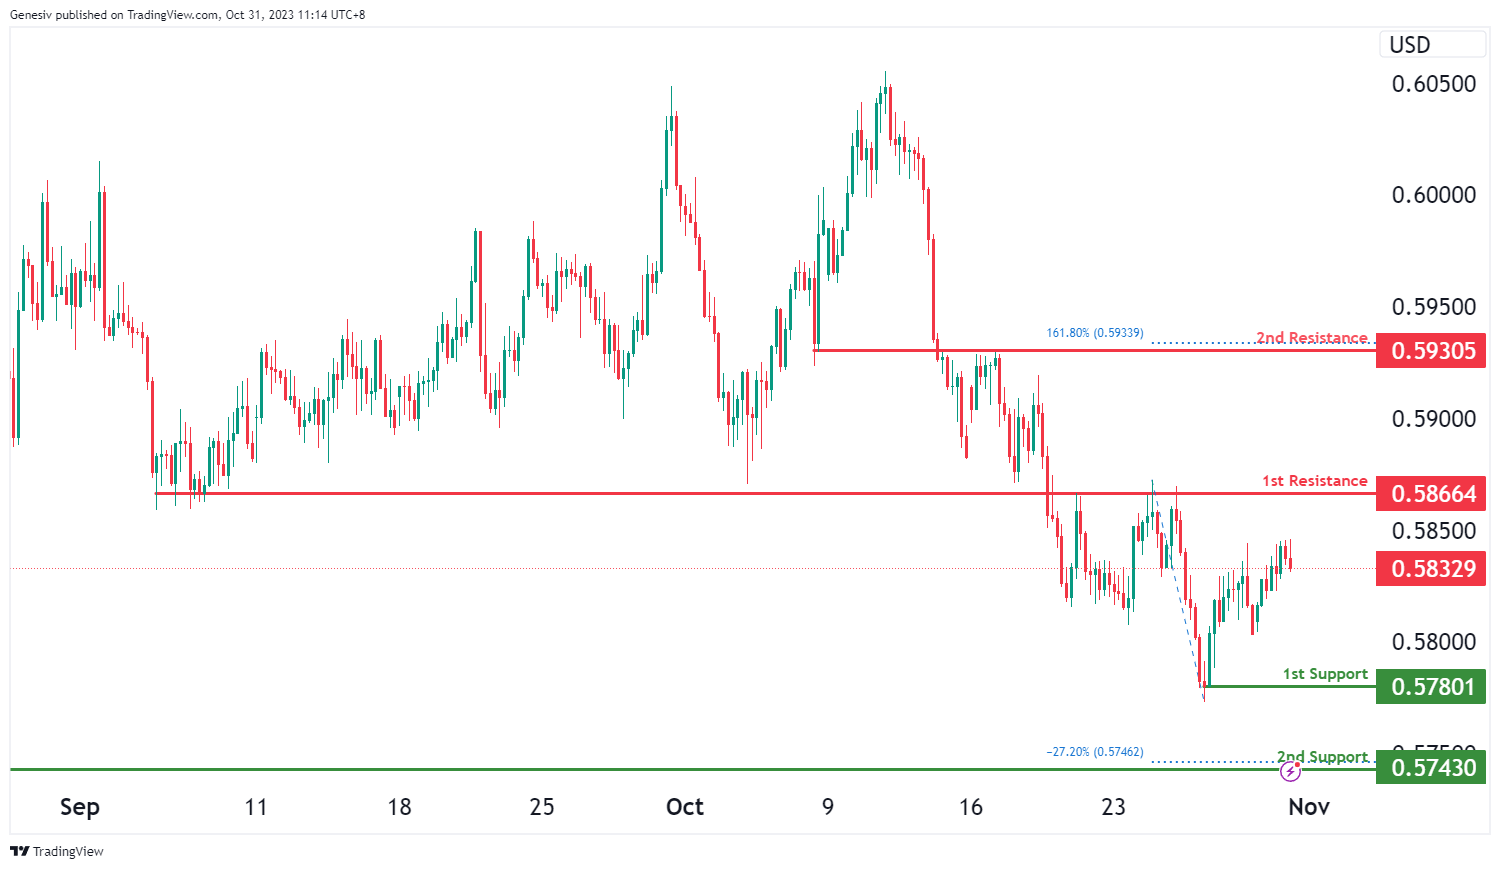
NZD/USD
The NZD/USD chart currently demonstrates an overall bearish momentum, suggesting a potential for a bearish continuation towards the 1st support. Price is also trading under the bearish Ichimoku cloud, which acts as an additional bearish factor.
The 1st support level at 0.5780 is identified as a pullback support. Additionally, the 2nd support level at 0.5743 is marked as a swing-low support that aligns with the -27.20% Fibonacci expansion level, which further reinforces the potential for a strong support zone.
On the resistance side, the 1st resistance level at 0.5866 is identified as an overlap resistance. Beyond this, the 2nd resistance level at 0.5931 is also noted as an overlap resistance that aligns with the 161.80% Fibonacci extension level, acting as a potential barrier to upward price movements.
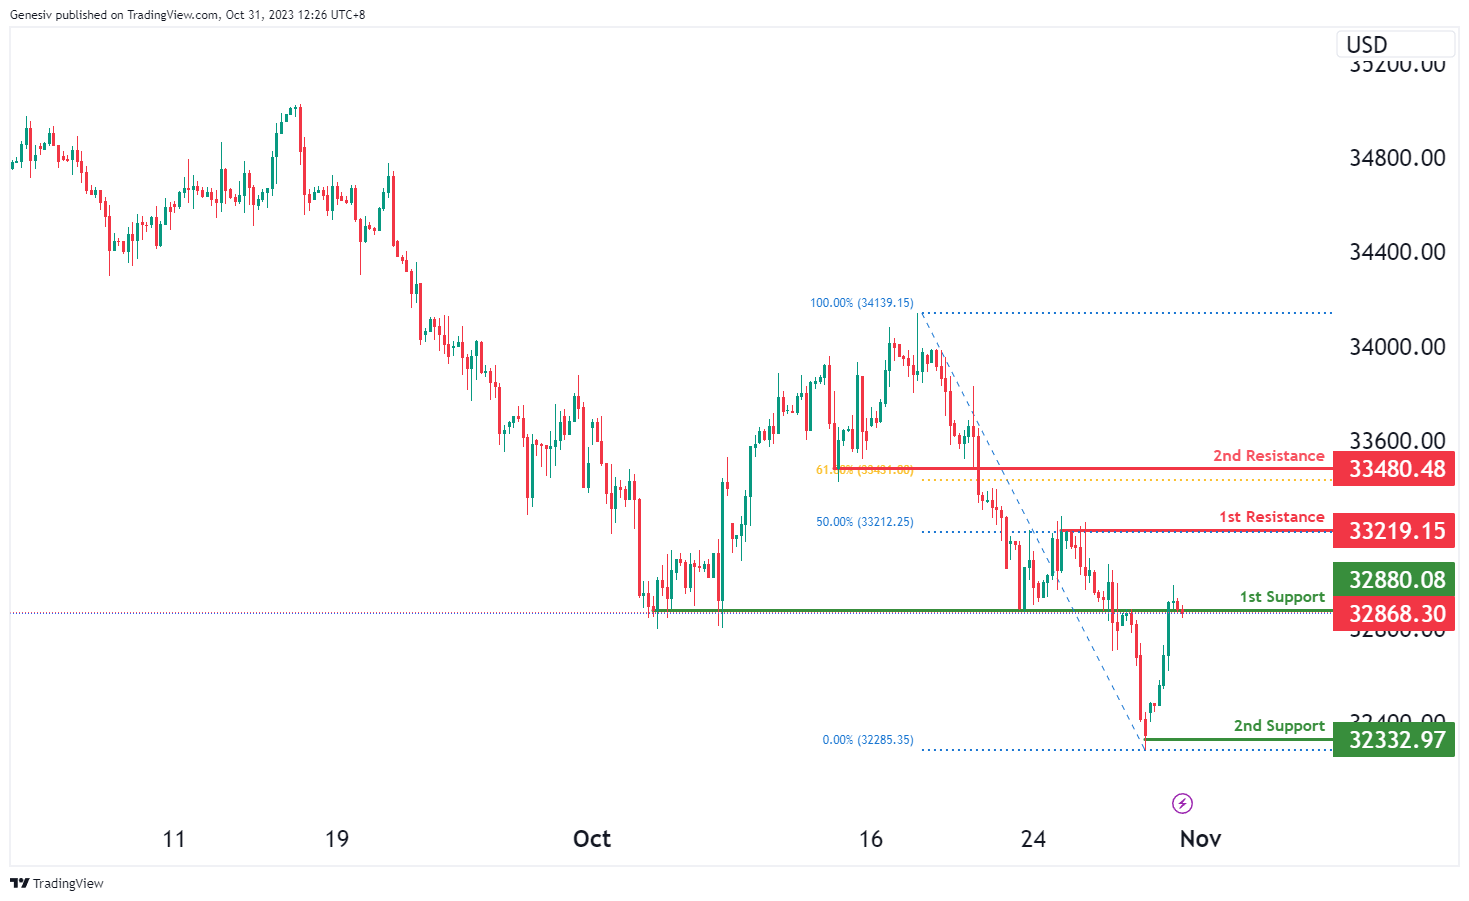
DJ30:
For DJ30, the chart currently indicates a bearish overall momentum, suggesting that the price could potentially witness a bearish break off the first support at 32874.86 and drop towards the second support at 32332.97.
The first support at 32874.86 is considered a strong level due to its overlap support characteristics, providing a notable potential support level.
The second support at 32332.97 is also significant as it features swing low support, marking another level of support for potential price movements.
On the resistance side, the first resistance at 33219.15 is marked by its multi-swing high resistance characteristics and is associated with the 50% Fibonacci Retracement, indicating a significant level of resistance. The second resistance at 33480.48 is noteworthy for its pullback resistance and is linked with the 61.80% Fibonacci Retracement, representing another important level of resistance.
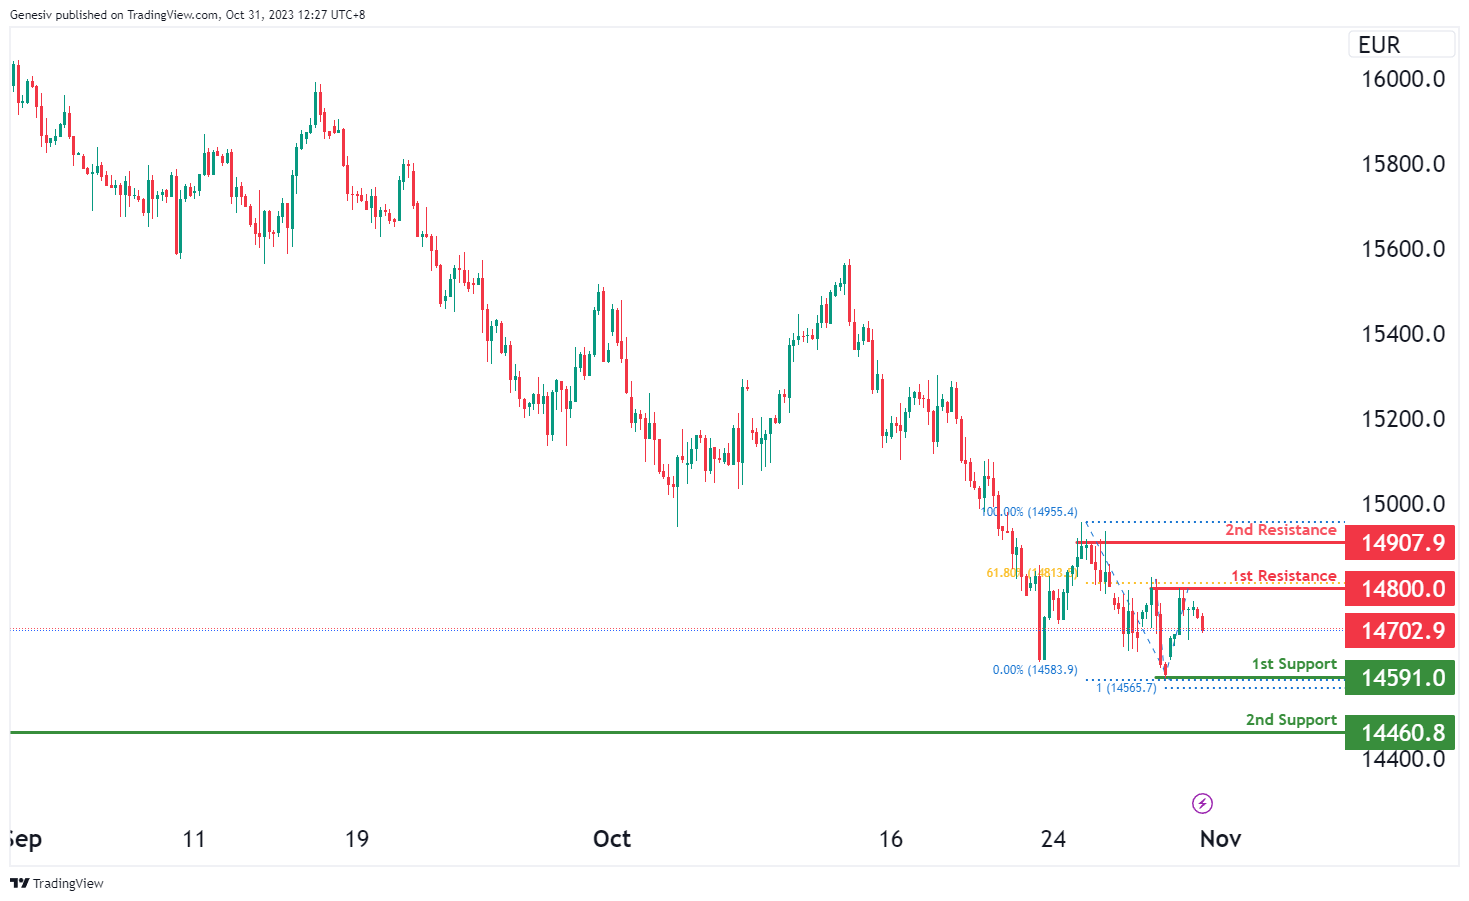
GER40:
For GER40, the chart currently indicates a bearish overall momentum, suggesting that the price could potentially continue in a bearish direction towards the first support at 14591.00.
The first support at 14591.00 is considered a strong level due to its swing low support characteristics and the presence of the 100% Fibonacci Projection, making it a notable potential support level.
The second support at 14460.80 is also significant as it features swing low support, providing another level of potential support for the price.
On the resistance side, the first resistance at 14800.00 is marked by multi-swing high resistance characteristics and is associated with the 61.80% Fibonacci Retracement, indicating a substantial level of resistance. The second resistance at 14907.90 is noteworthy for its multi-swing high resistance, presenting another important level of resistance.
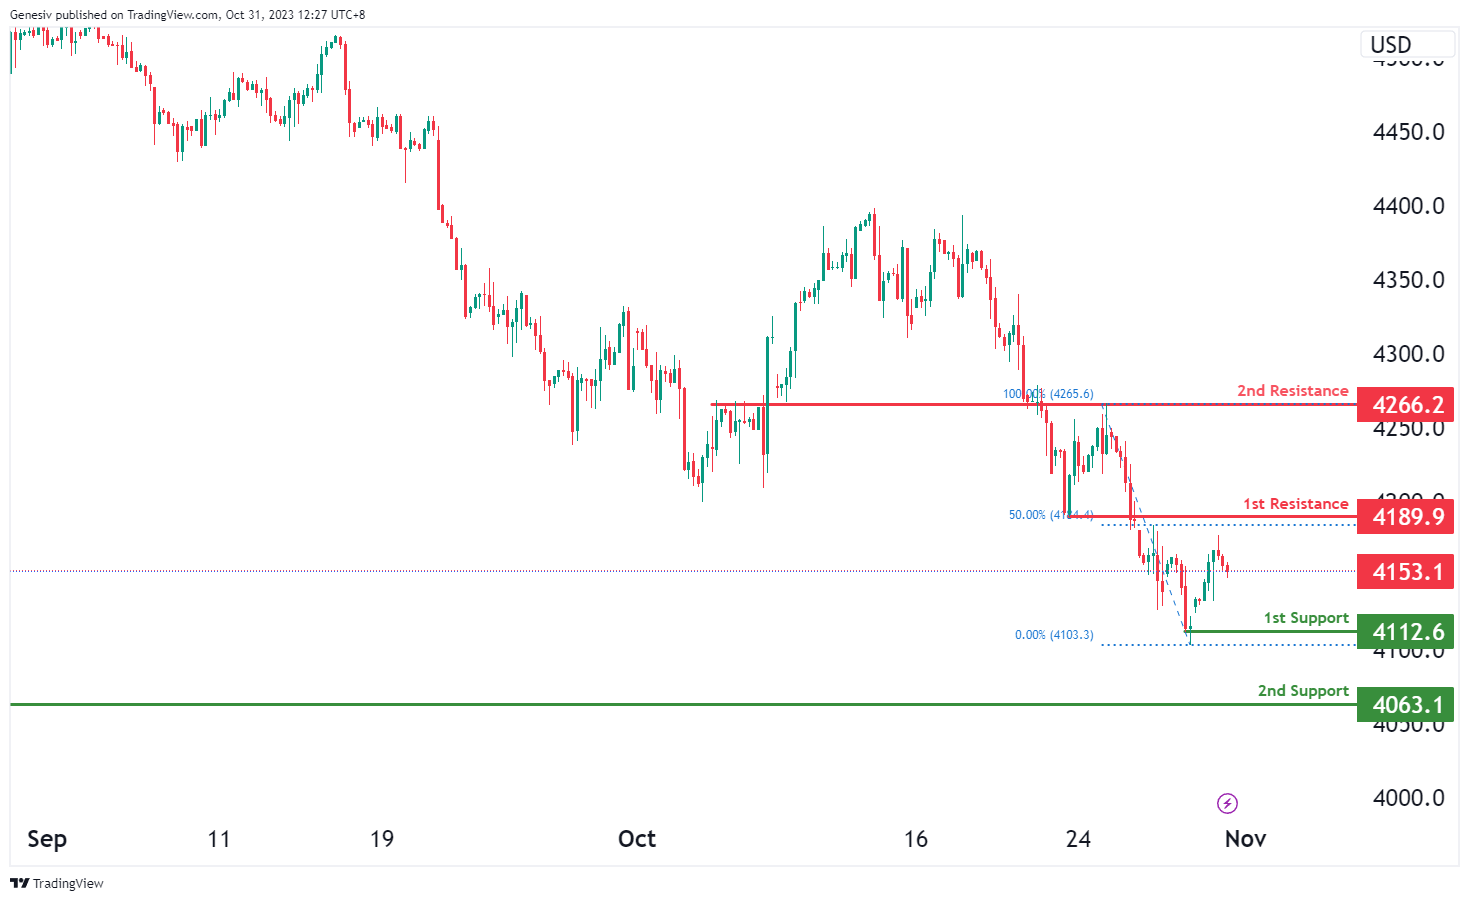
`US500
For US500, the chart currently displays a bearish overall momentum, suggesting a potential bearish continuation towards the first support at 4112.6.
The first support at 4112.6 is considered strong due to its swing low support characteristics, marking a significant level of potential support for the price.
The second support at 4063.1 is also notable, as it features overlap support, presenting an additional layer of potential support.
On the resistance side, the first resistance at 4189.9 is marked by pullback resistance, associated with the 50% Fibonacci Retracement, indicating a notable level of resistance. The second resistance at 4266.2 is significant due to its overlap resistance characteristics, presenting another important level of resistance.
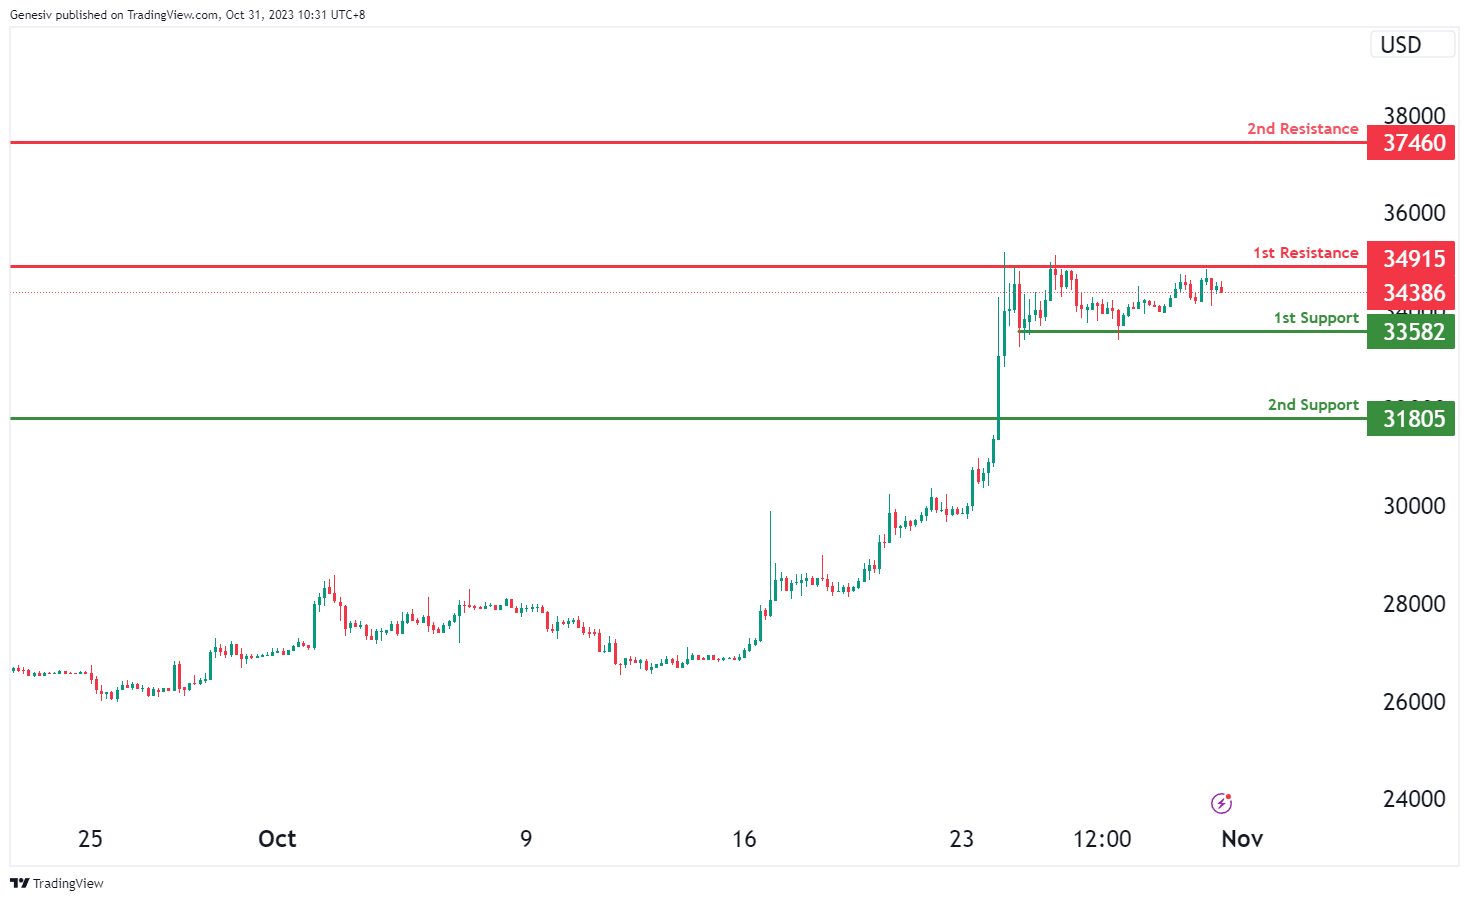
BTC/USD:
For BTC/USD, the chart currently suggests a neutral overall momentum, implying that the price could potentially fluctuate between the first resistance at 34915 and the first support at 33582.
The first support at 33582 is considered strong due to its multi-swing low support characteristics, offering a notable level of potential support.
The second support at 31805 is also significant as it provides pullback support, potentially adding another layer of support.
On the resistance side, the first resistance at 34915 is marked by its overlap resistance characteristics, indicating a substantial level of resistance. The second resistance at 37460 is noteworthy for its pullback resistance attributes, serving as another important level of resistance.
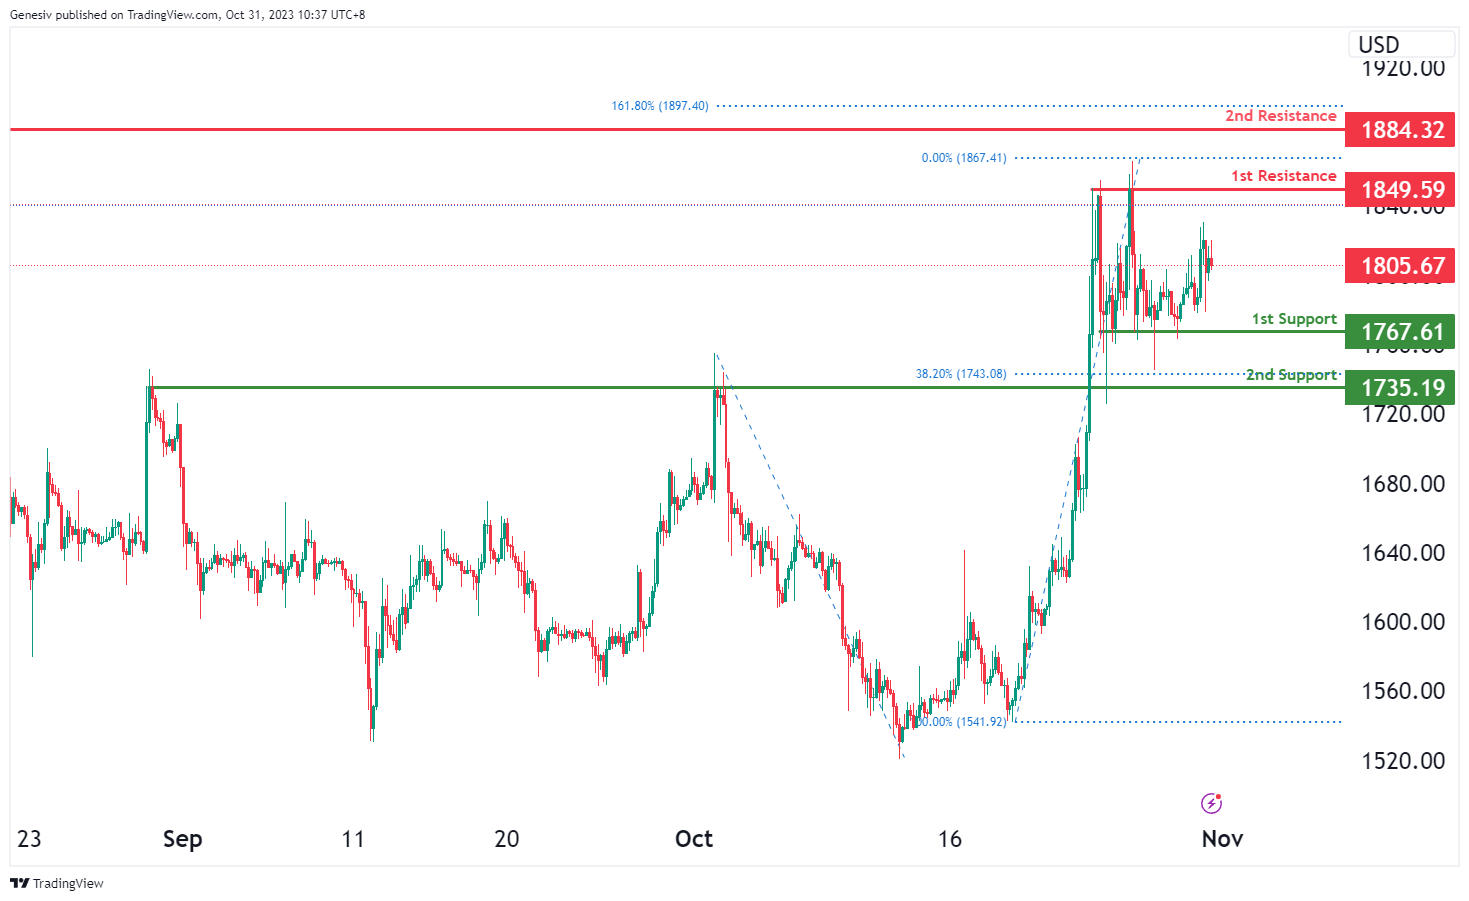
ETH/USD:
For ETH/USD, the chart currently indicates a neutral overall momentum, suggesting that the price could potentially fluctuate between the first resistance at 1849.59 and the first support at 1767.61.
The first support at 1767.61 is considered strong due to its multi-swing low support characteristics, presenting a significant potential support level.
The second support at 1735.19 is also notable as it offers pullback support and is associated with the 38.20% Fibonacci Retracement, adding further support characteristics.
On the resistance side, the first resistance at 1849.59 is marked by its multi-swing high resistance characteristics, suggesting a substantial level of resistance. The second resistance at 1884.32 is noteworthy for its multi-swing high resistance and is linked with the 161.80% Fibonacci Extension, representing another important level of resistance.
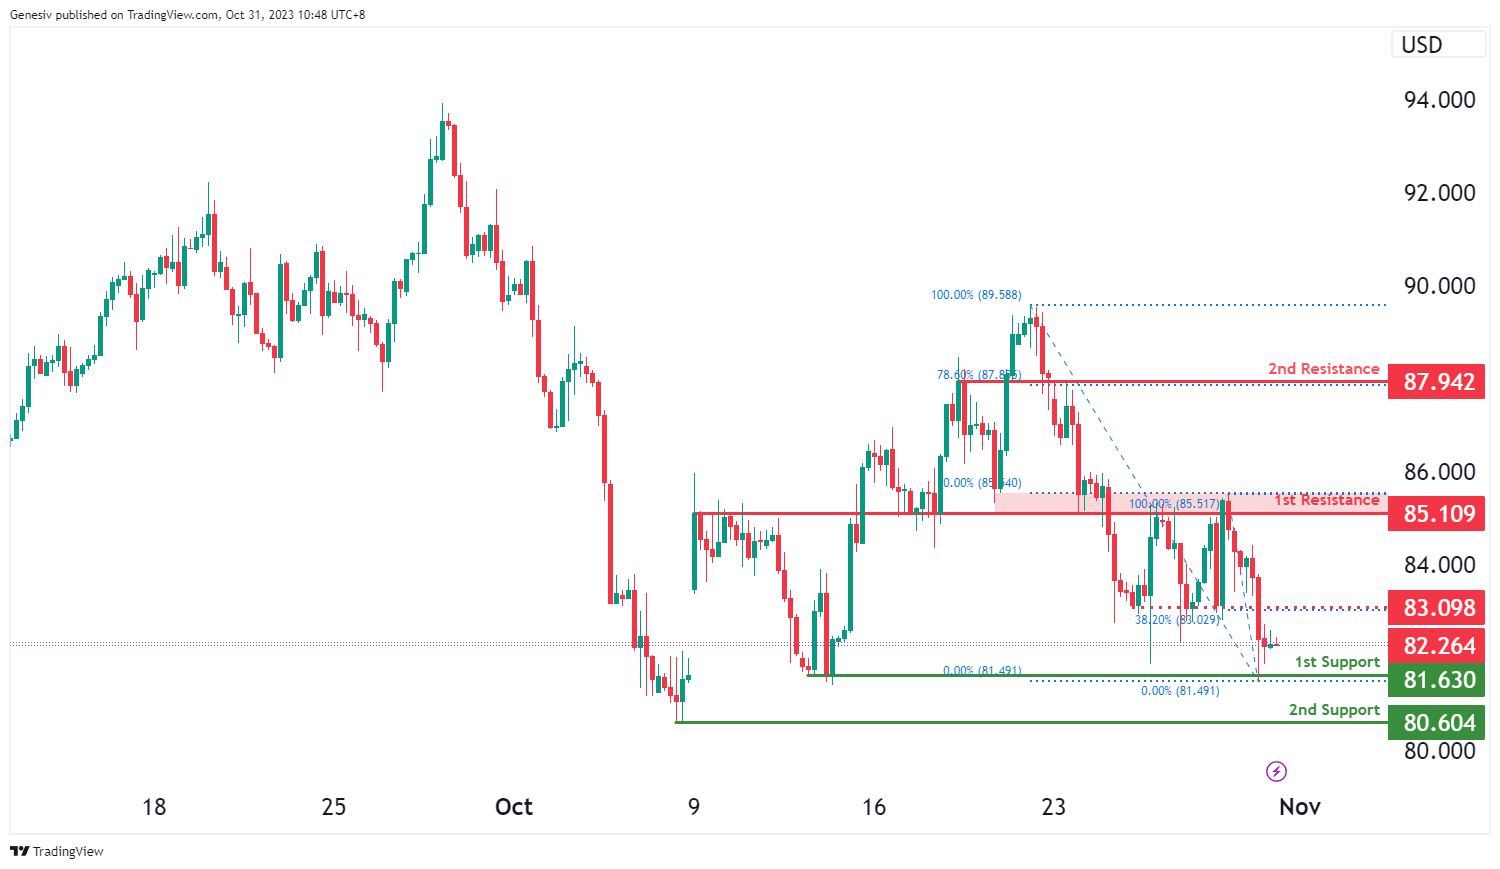
WTI/USD:
The WTI chart currently exhibits an overall bearish momentum, indicating the potential for price to make a bearish continuation towards the 1st support.
The 1st support level at 81.63 is identified as a pullback support. Additionally, the 2nd support level at 80.60 is marked as a swing-low support, reinforcing a potential support zone.
On the resistance side, the intermediate resistance level at 83.09 is identified as a pullback resistance that aligns with the 38.20% Fibonacci retracement level while the 1st resistance level at 85.11 is noted as an overlap resistance that aligns close to the 50.00% Fibonacci retracement level. Higher up, the 2nd resistance level at 87.94 is marked as a pullback resistance that aligns with the 78.60% Fibonacci retracement level, making it a strong potential barrier to upward price movement.
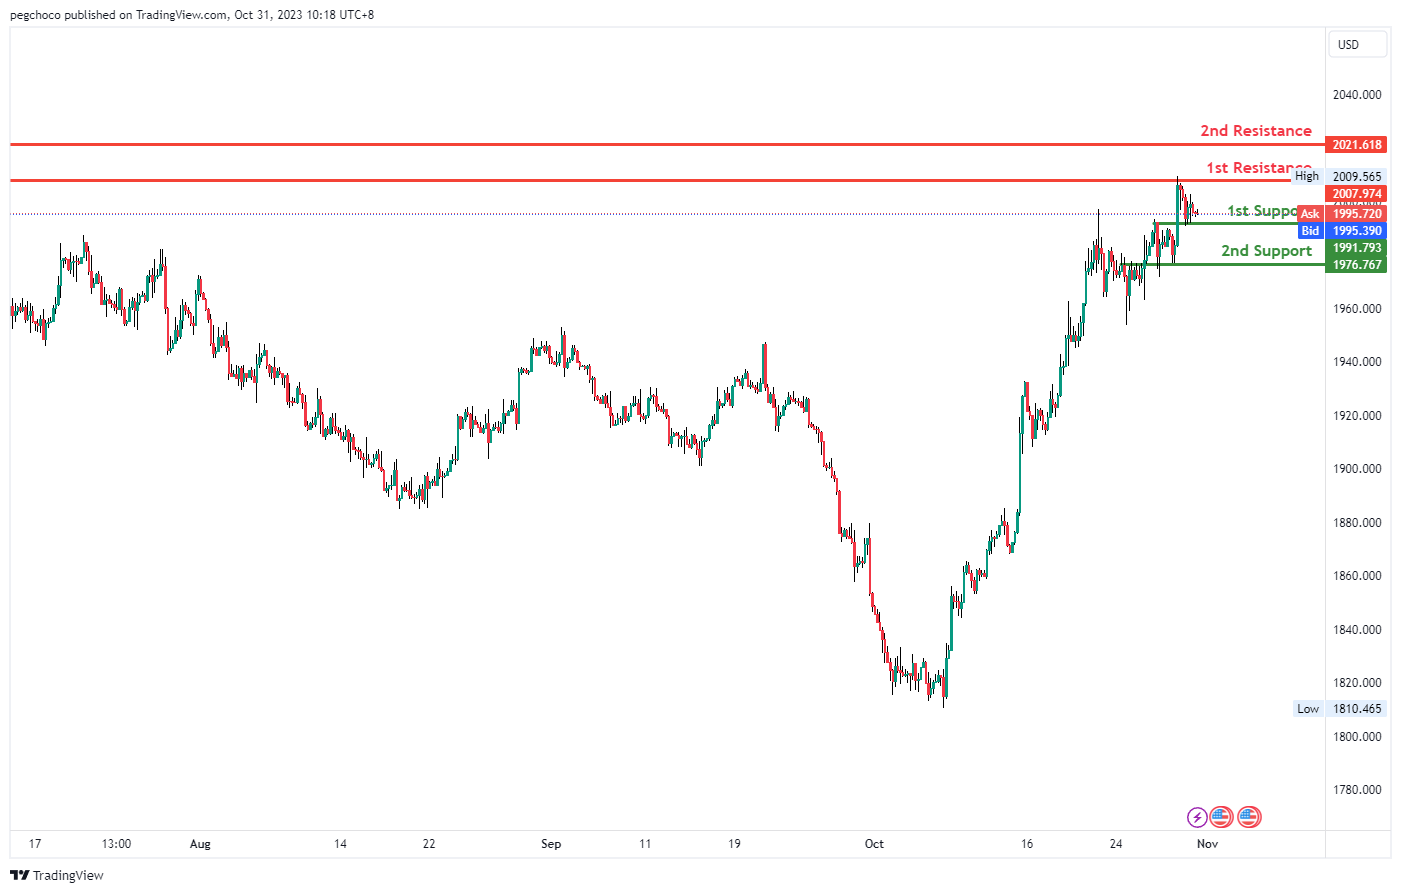
XAU/USD (GOLD):
The XAU/USD (Gold/US Dollar) chart currently displays bullish momentum, suggesting the potential for a bullish bounce off the 1st support level at 1991.79 and a subsequent move towards the 1st resistance level at 2009.97.
The 1st support at 1991.79 is considered significant as it aligns with an overlap support, indicating its potential to act as a strong support level. Similarly, the 2nd support level at 1976.76 is also identified as an overlap support, reinforcing the potential support zone.
On the resistance side, the 1st resistance at 2009.97 is characterized as an overlap resistance, implying that it could serve as a substantial barrier to any notable upward price movement in the bullish direction. Additionally, the 2nd resistance at 2021.61 is also noted as an overlap resistance, further reinforcing the significance of this potential area where price may face resistance.
The accuracy, completeness and timeliness of the information contained on this site cannot be guaranteed. IC Markets does not warranty, guarantee or make any representations, or assume any liability regarding financial results based on the use of the information in the site.
News, views, opinions, recommendations and other information obtained from sources outside of www.icmarkets.com, used in this site are believed to be reliable, but we cannot guarantee their accuracy or completeness. All such information is subject to change at any time without notice. IC Markets assumes no responsibility for the content of any linked site.
The fact that such links may exist does not indicate approval or endorsement of any material contained on any linked site. IC Markets is not liable for any harm caused by the transmission, through accessing the services or information on this site, of a computer virus, or other computer code or programming device that might be used to access, delete, damage, disable, disrupt or otherwise impede in any manner, the operation of the site or of any user’s software, hardware, data or property.


