
A note on lower timeframe confirming price action…
Waiting for lower timeframe confirmation is our main tool to confirm strength within higher timeframe zones, and has really been the key to our trading success. It takes a little time to understand the subtle nuances, however, as each trade is never the same, but once you master the rhythm so to speak, you will be saved from countless unnecessary losing trades. The following is a list of what we look for:
- A break/retest of supply or demand dependent on which way you’re trading.
- A trendline break/retest.
- Buying/selling tails/wicks – essentially we look for a cluster of very obvious spikes off of lower timeframe support and resistance levels within the higher timeframe zone.
- Candlestick patterns. We tend to only stick with pin bars and engulfing bars as these have proven to be the most effective.
We search for lower timeframe confirmation between the M15 the H1 timeframes, since most of our higher-timeframe areas begin with the H4. Stops are usually placed 5-10 pips beyond confirming structures.
EUR/USD:
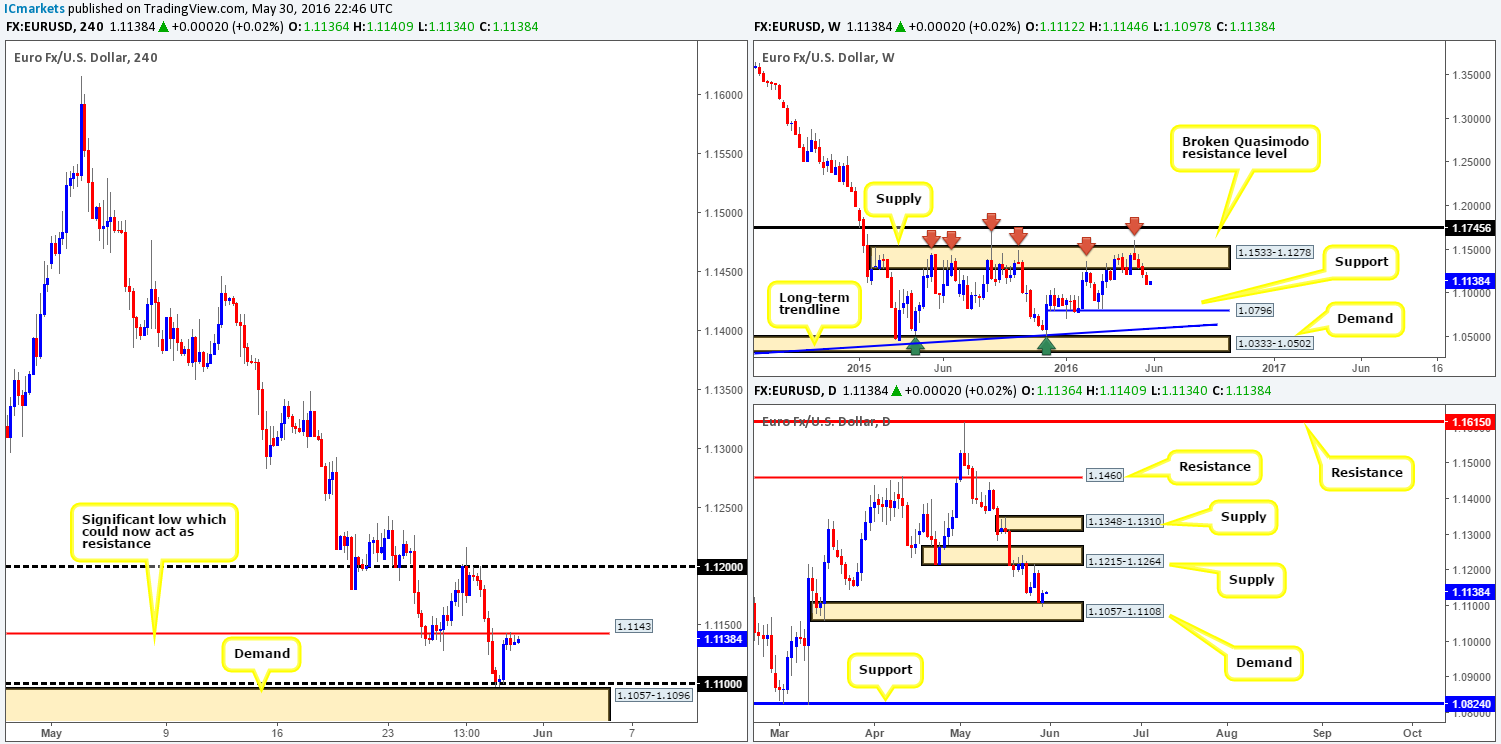
Going into the early hours of yesterday’s sessions, the shared currency was bid from the 1.11 handle (positioned just above a H4 demand area at 1.1057-1.1096) up to H4 resistance drawn from 1.1143. From here, as can be seen from the H4 chart, price entered into a tight consolidation due to both the UK and US on vacation.
With H4 price currently hugging resistance, let’s see how the land lies on the higher-timeframe picture. Over on the weekly chart, the EUR has been in a slump for four weeks since whipsawing through a major area of weekly supply at 1.1533-1.1278. Given that this weekly area has managed to cap upside in this market since May 2015, we feel further selling is possible down to support drawn from 1.0796. Moving down to the daily chart, however, demand seen at 1.1057-1.1108 held firm during yesterday’s thin trading conditions. Should the bulls continue to hold ground, it’s likely we may see a touch of daily supply drawn from 1.1215-1.1264.
Our suggestions: In light of the above points, we see the following:
- Taking a short from the current H4 resistance barrier, as far as we see, places you in direct conflict with daily buyers from demand at 1.1057-1.1108. Furthermore, considering H4 demand at 1.1057-1.1096 is sitting just below, selling this level is not really something our team would stamp high probability.
- In the event that the bulls break above the present H4 resistance level, the path, at least on the H4 chart, appears clear up to the 1.12 mark. Taking a long trade on the break/retest of the H4 resistance would place one in-line with daily flow from demand at 1.1057-1.1108, but of course, against the current weekly selling!
Personally, we’re just not sure here. And when that is the case, the best thing we’ve found is to take the safest position of them all – flat!
Levels to watch/live orders:
- Buys: Flat (Stop loss: N/A).
- Sells: Flat (Stop loss: N/A).
GBP/USD:
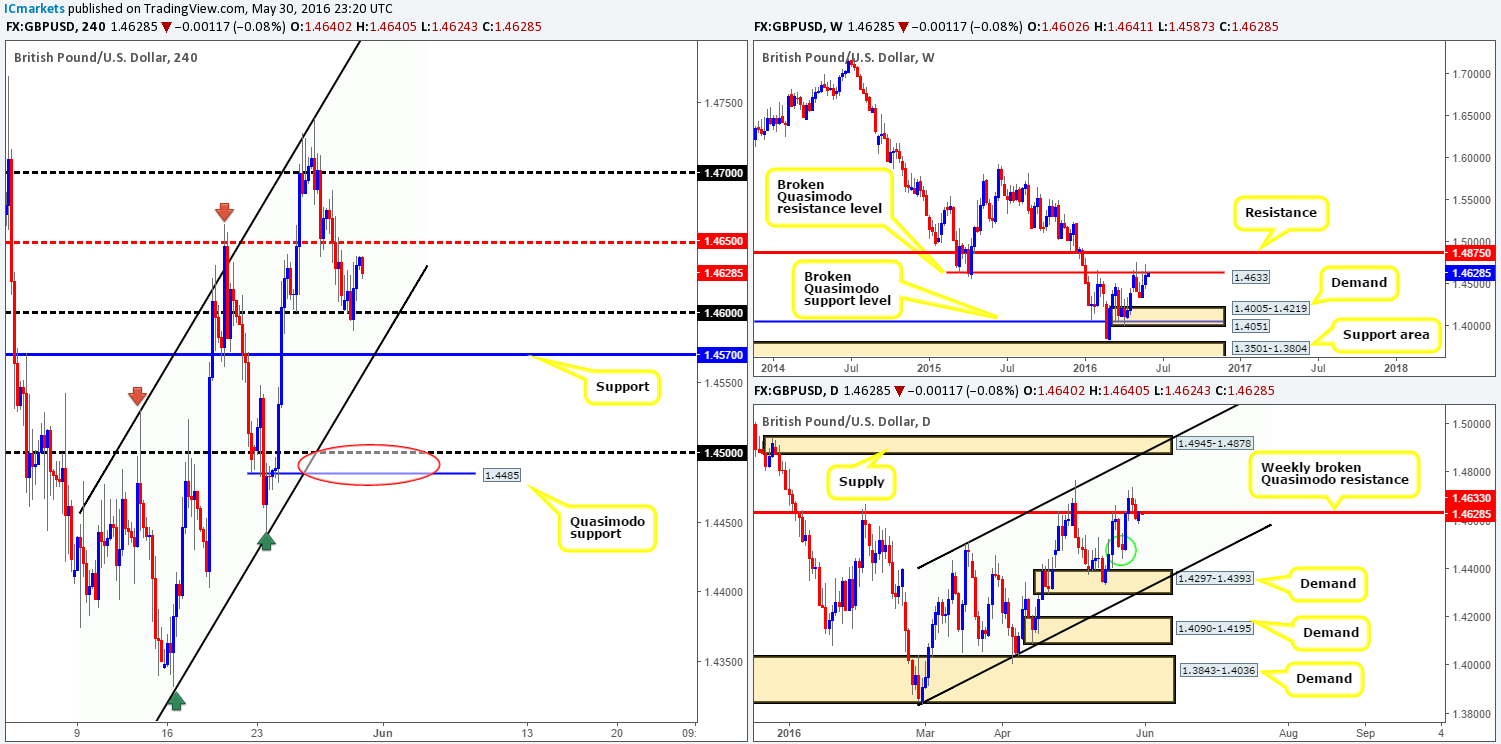
Although trading action was relatively thin yesterday due to the US and UK taking a break, price did manage to find a pocket of active bids around the 1.46 handle and rally the pound to highs of 1.4641 on the day.
Now, from the both the weekly and daily charts, we can see that price is trading around a weekly broken Quasimodo barrier (BQM) seen at 1.4633, which has capped upside since the beginning of February. Therefore, from a technical standpoint, we feel this pair may sell-off in the coming days. Unfortunately, we see very little on the H4 chart that has ‘sell me’ written on it. Not only is there the 1.46 support hurdle lurking just below, but there’s also H4 support at 1.4570 which fuses with H4 channel support extended from the low 1.4332.
Our suggestions: In light of the points made above in bold, our team will be looking to short the break and retest of the 1.4570 H4 support level (alongside lower timeframe confirmation – see the top of this report for confirming techniques), targeting the H4 Quasimodo support at 1.4485 (red circle). This H4 Quasimodo not only has a converging round number at 1.45, but also sits within daily demand at 1.4442-1.4503, thus making a nice area to take profits.
Levels to watch/live orders:
- Buys: Flat (Stop loss: N/A).
- Sells: Watch for price to consume 1.4570 and then look to trade any retest seen thereafter (lower timeframe confirmation required).
AUD/USD:
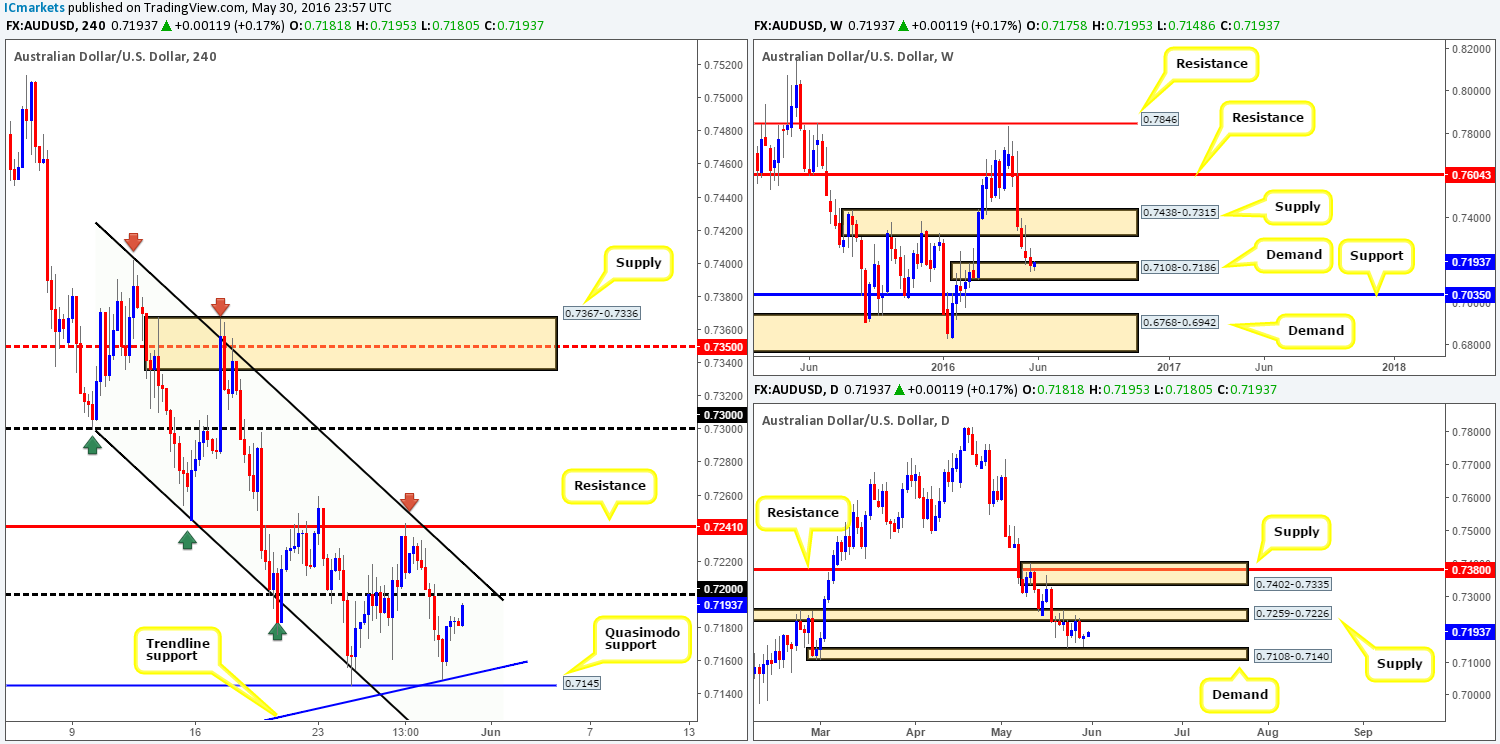
In our previous report (see link below) you may recall us mentioning that we placed a pending order to buy at 0.7146, due to a convergence of a nice-looking H4 Quasimodo support at 0.7145 and a H4 trendline support taken from the low 0.6827. As can be seen from the H4 chart, price came within two pips of filling our order before rallying north yesterday – very frustrating but this is trading! Well done to any of our readers who managed to buy from here and take advantage of the current move north.
With price now heading towards the 0.72 handle, where do we go from here? Well, as we already mentioned in past reports, weekly action remains trading within weekly demand carved from 0.7108-0.7186, and the daily chart recently printed a bullish pin bar which missed tagging daily demand at 0.7108-0.7140 by less than ten pips. However, buying right now would be risky. Other than the 0.72 handle and its converging H4 channel resistance taken from the high 0.7402, traders looking to buy have to take into consideration that the underside of daily supply is lurking just above 0.72 at 0.7226, followed closely by H4 resistance at 0.7241.
Our suggestions: We would not consider buying this pair until we see a sustained move above H4 resistance at 0.7241 is seen. In regards to selling, caution is advised as taking a short position when price is trading within weekly demand is not really something we would label high probability. Therefore, opting to stand on the side lines here may be the best path to take.
Levels to watch/live orders:
- Buys: Flat (Stop loss: N/A).
- Sells: Flat (Stop loss: N/A).
USD/JPY:
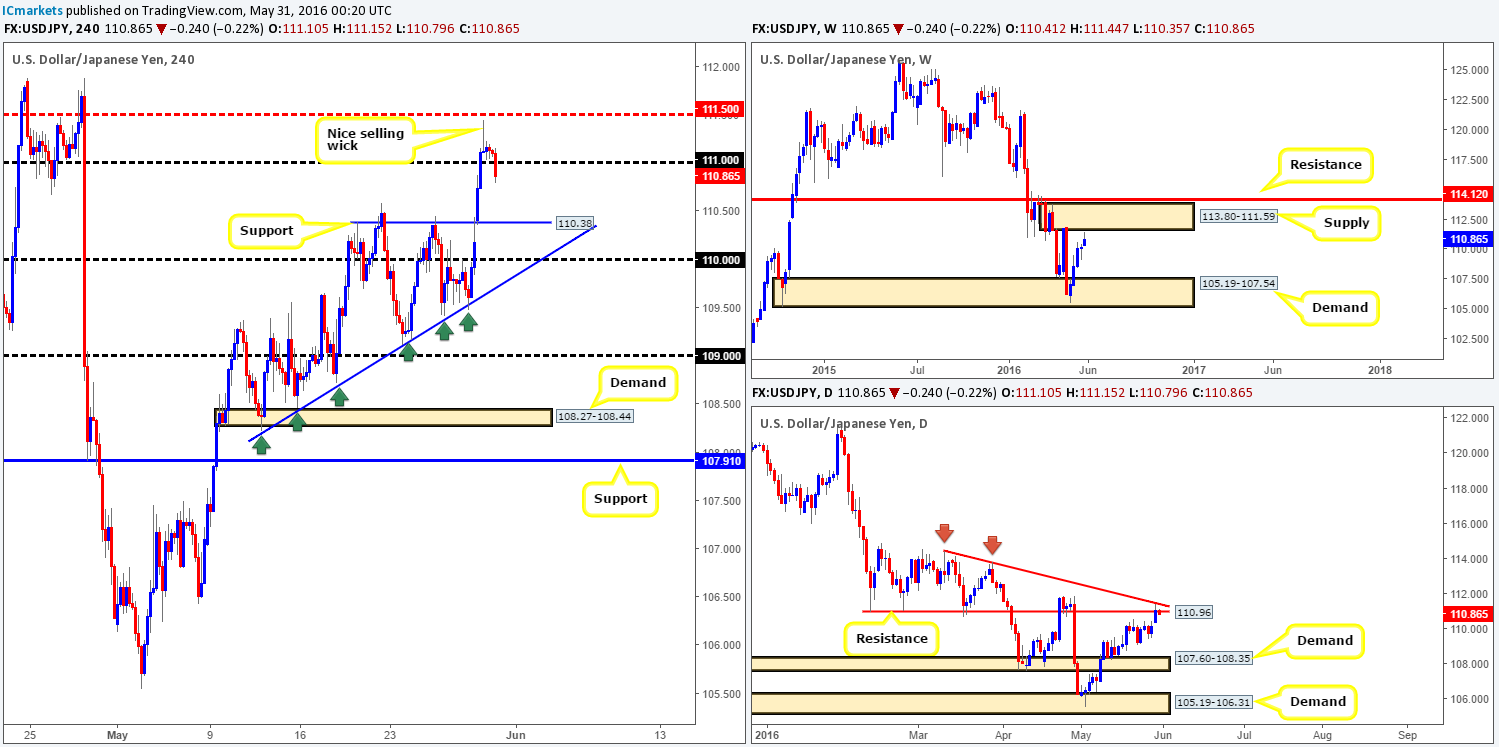
Starting from the top this morning, we can see that the USD/JPY came within fifteen pips of connecting with weekly supply at 113.80-111.59 in recent trading, which, as you can see, has certainly sparked a little selling interest. Along the same vein, daily price whipsawed through a daily resistance line at 110.96 and tagged in offers at a nearby daily trendline resistance taken from the high 114.44, before dropping lower.
Looking over to the H4 chart, price peaked at 111.44 going into London trading yesterday – forming a beautiful-looking H4 bearish pin bar that just missed the H4 mid-way resistance line 111.50. More recently, however, bids have been taken out from the 111.00 handle, which could, given the higher-timeframe picture (see above) encourage further selling today.
Our suggestions: Assuming H4 price closes below the 111.00 line, a short trade on the retest of this number is a high-probability sell, targeting H4 support chalked up at 110.38 as a first take-profit target.
Levels to watch/live orders:
- Buys: Flat (Stop loss: N/A).
- Sells: 111.00 region [Tentative – confirmation required] (Stop loss: dependent on where one confirms this area).
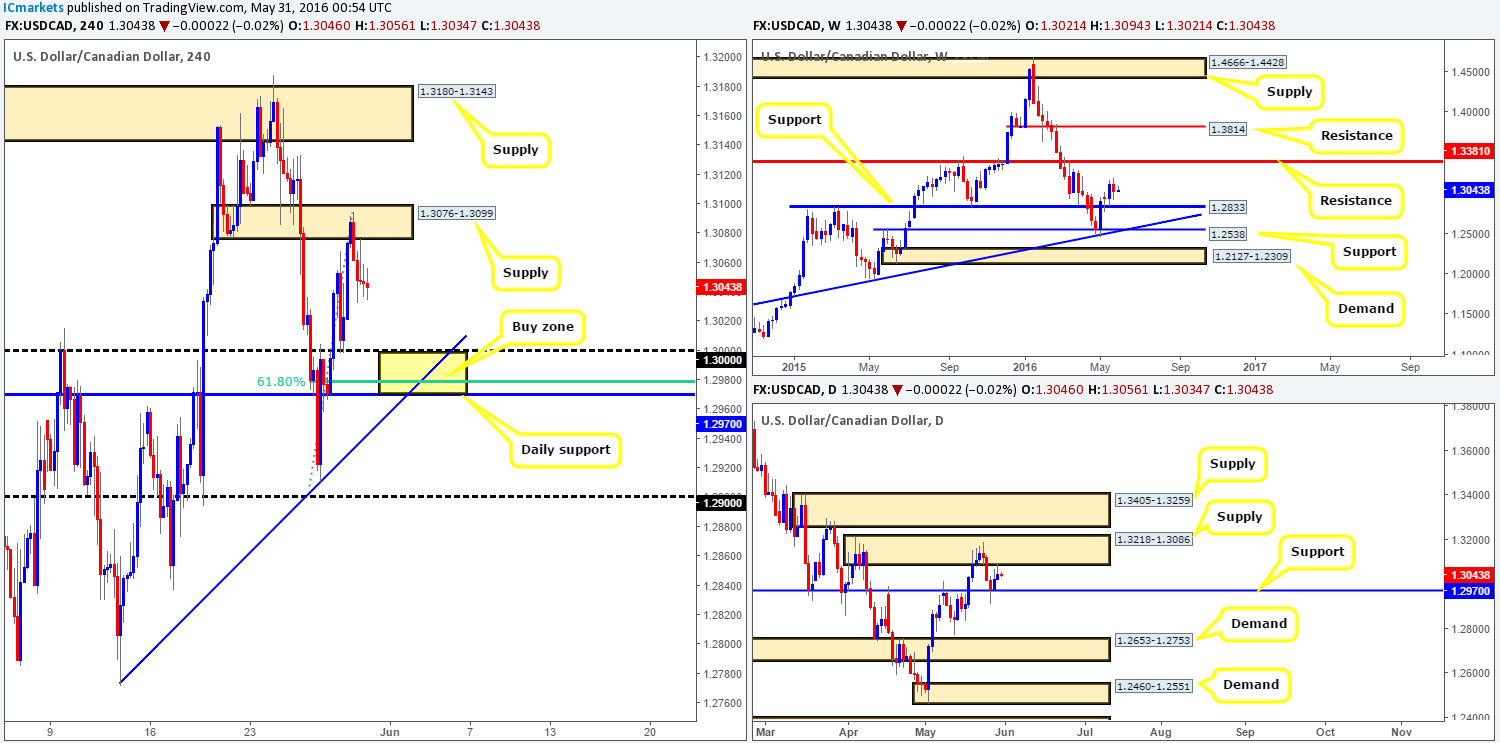
USD/CAD:
Although liquidity was expected to be light yesterday due to the UK and US Bank holidays, the Loonie sold-off nicely from H4 supply at 1.3076-1.3099 down to lows of 1.3032 on the day. Consequent to this, our attention is now drawn to the yellow H4 rectangle seen below. This area brings together a collection of noteworthy supports that include: daily support at 1.2970, the large psychological boundary 1.30, a H4 trendline support extended from the low 1.2771 and a H4 61.8% Fibonacci support at 1.2978.
Our suggestions: In view of the confluence seen around the 1.2970/1.3000 H4 yellow buy zone, our team is relatively confident a bounce will be seen from here. Waiting for lower timeframe confirmation to form prior to entering, however, is still the more preferred route to take, since weekly price could jab lower to connect with weekly support at 1.2833 and essentially ignore our buy zone. In regards to take-profits, this is a little difficult to judge right now without seeing how H4 price approaches the buy zone. For ideas on how to locate a confirming setup please see the top of this report.
Levels to watch/live orders:
- Buys: 1.2970-1.3000 [Tentative – confirmation required] (Stop loss: dependent on where one confirms this area).
- Sells: Flat (Stop loss: N/A).
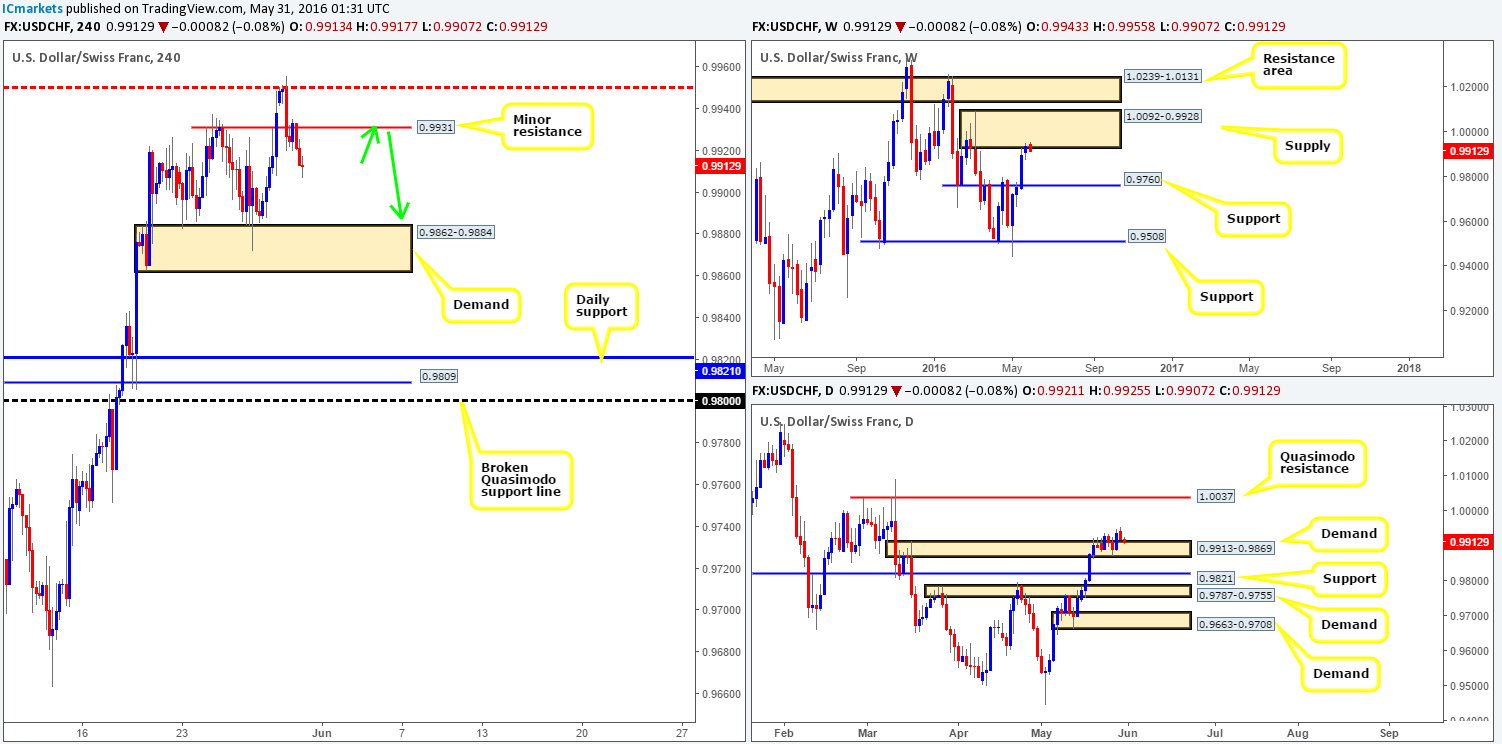
USD/CHF:
USD/CHF bears managed to find their feet early on in the day yesterday, selling-off from a H4 mid-way resistance line at 0.9950 and giving back some of Friday’s gains. From the H4 chart, we see very little noteworthy demand until price reaches the 0.9862-0.9884 region. And, in light of weekly price now trading from the jaws of a weekly supply area seen at 1.0092-0.9928, it’s likely this market will fall lower. However, let’s not forget about the daily chart! Demand at 0.9913-0.9869 which was prior supply not so long ago, is currently holding this market higher.
Our suggestions: Look for a confirmed short trade on any retest seen around the minor H4 resistance line at 0.9931 (as per the green arrows), targeting the H4 demand mentioned above at 0.9862-0.9884. The reason for requiring confirmation here (see the top of this report for confirming techniques) is simply because by selling from the current H4 resistance, although we’re trading in-line with weekly flow, we’re also selling into potential daily buying (see above).
Levels to watch/live orders:
- Buys: Flat (Stop loss: N/A).
- Sells: 0.9931 region [Tentative – confirmation required] (Stop loss: dependent on where one confirms this area).
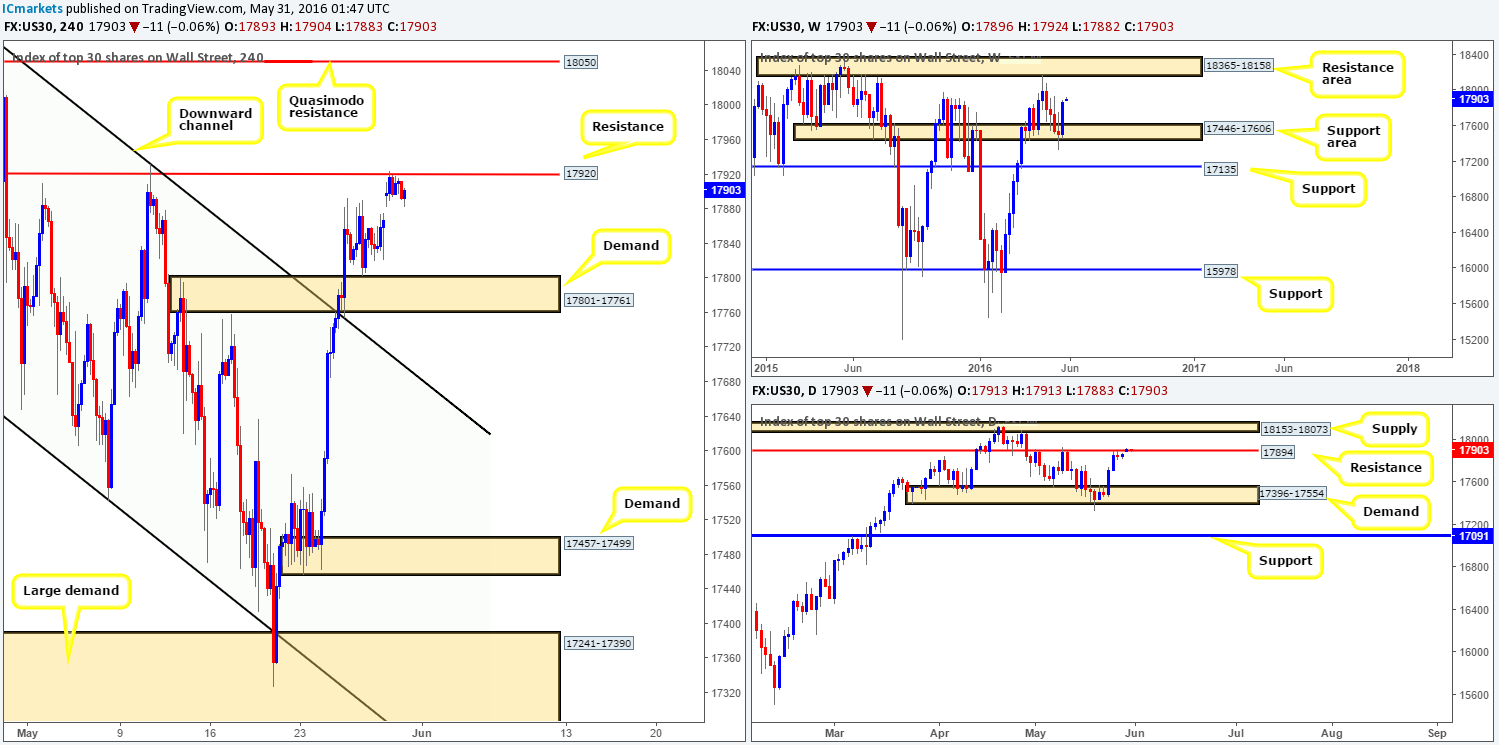
DOW 30:
U.S. stocks saw very little action amid holiday trade yesterday as price clung to the underside of a H4 resistance band at 17920. Consequent to this lackluster performance, much of the following report will echo thoughts put forward in Monday’s analysis…
From the weekly chart, we can see that the DOW recently rallied from a weekly support area at 17446-17606 which took out three prior weekly bearish candle bodies. Supposing the bulls continue to bid this market north, the next upside target to be aware of is the weekly resistance area at 18365-18158. Despite the bullish picture being seen on the weekly chart right now, daily is action is currently flirting with a daily resistance line carved from 17894. A break beyond this hurdle would likely clear the path north for price to touch base with a supply zone chalked up at 18153-18073, which sits a few points below the above said weekly resistance area.
Our suggestions: One could look to short from the current H4 resistance line today considering the DOW is also connecting with a daily resistance barrier right now (see above). However, given weekly price is bullish, some may want to wait and see if the H4 resistance line gives way, as this could provide an opportunity to trade long on any retest seen at this boundary, targeting the H4 Quasimodo resistance level at 18050 (located just below the daily supply zone at 18153-18073).
Levels to watch/live orders:
- Buys: Watch for price to consume 17920 and then look to trade any retest seen thereafter (lower timeframe confirmation required).
- Sells: 17920 region [Tentative – confirmation required] (Stop loss: dependent on where one confirms this area).
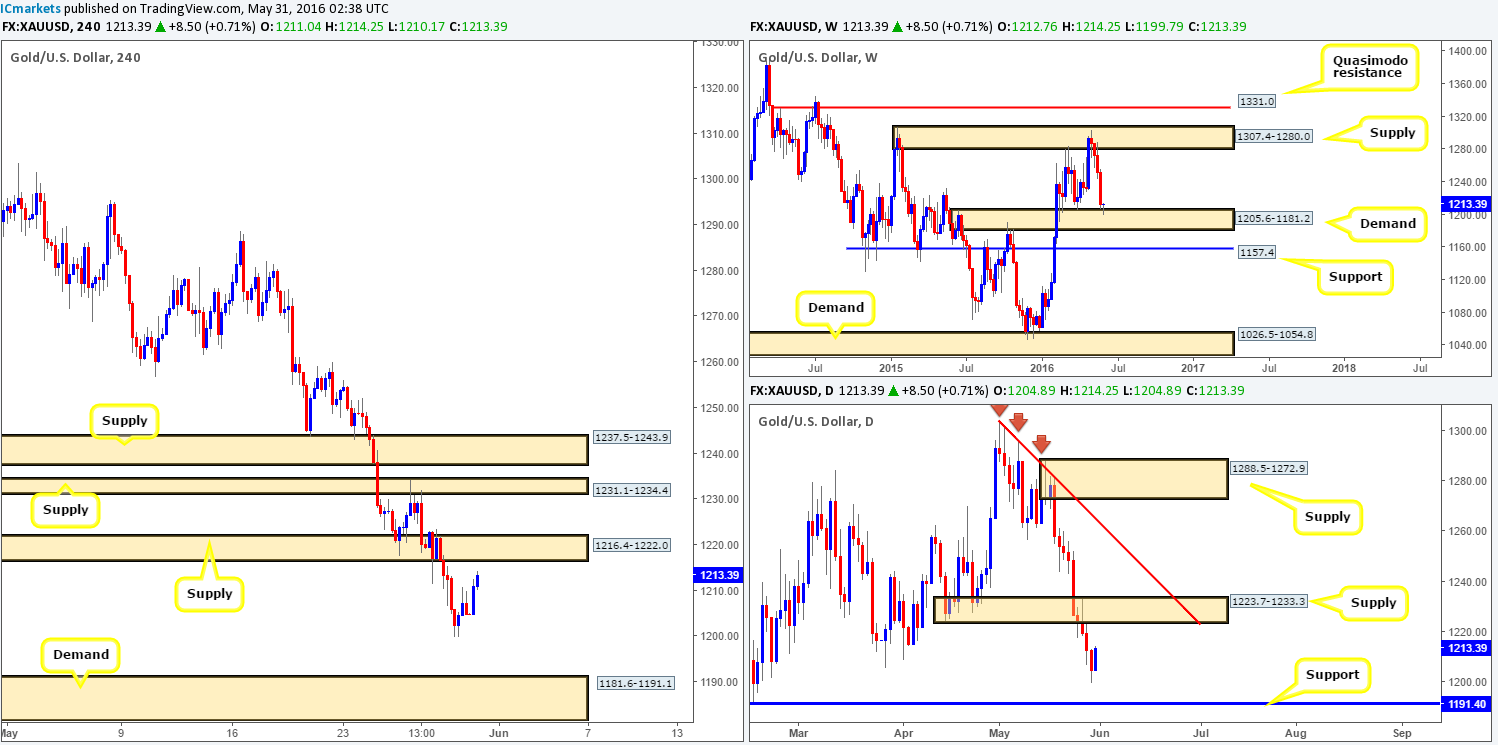
Gold:
Kicking-off this morning’s analysis with a look at the weekly chart, we found that gold is currently respecting a weekly demand base at 1205.6-1181.2, which could technically push the yellow metal back up to weekly supply at 1307.4-1280.0. Before weekly buyers get too excited, however, let’s be mindful to the fact that there is a daily supply area sitting above current price at 1223.7-1233.3. On top of this, there is also a H4 supply base carved from 1216.4-1222.0 in view right now that could potentially halt further buying from the current weekly demand area.
This is a tricky market to trade in our opinion. On the one hand, weekly action suggests buying to be more favorable path, whilst on the other hand both the daily and H4 charts indicate selling from supply to be the better route to take (see above).
Our suggestions: Quite frankly, neither a long nor short seems attractive at current prices. However, should bullion decline in value and connect with H4 demand at 1181.6-1191.1, we would be very interested in buying from here with our stops placed beyond this base at around the 1180.3 region. Reason being is this area sits just below daily support at 1191.40, and is also located within the depths of the above said weekly demand.
Levels to watch/live orders:
- Buys: 1181.6-1191.1 [Entering from here at market is a possibility] (Stop loss: 1180.3).
- Sells: Flat (Stop loss: N/A).


