
Key risk events today:
China Manufacturing PMI; China Non-Manufacturing PMI; UK Current Account; Canada GDP m/m; Chicago PMI; US CB Consumer Confidence.
(Previous analysis as well as outside sources – italics).
EUR/USD:
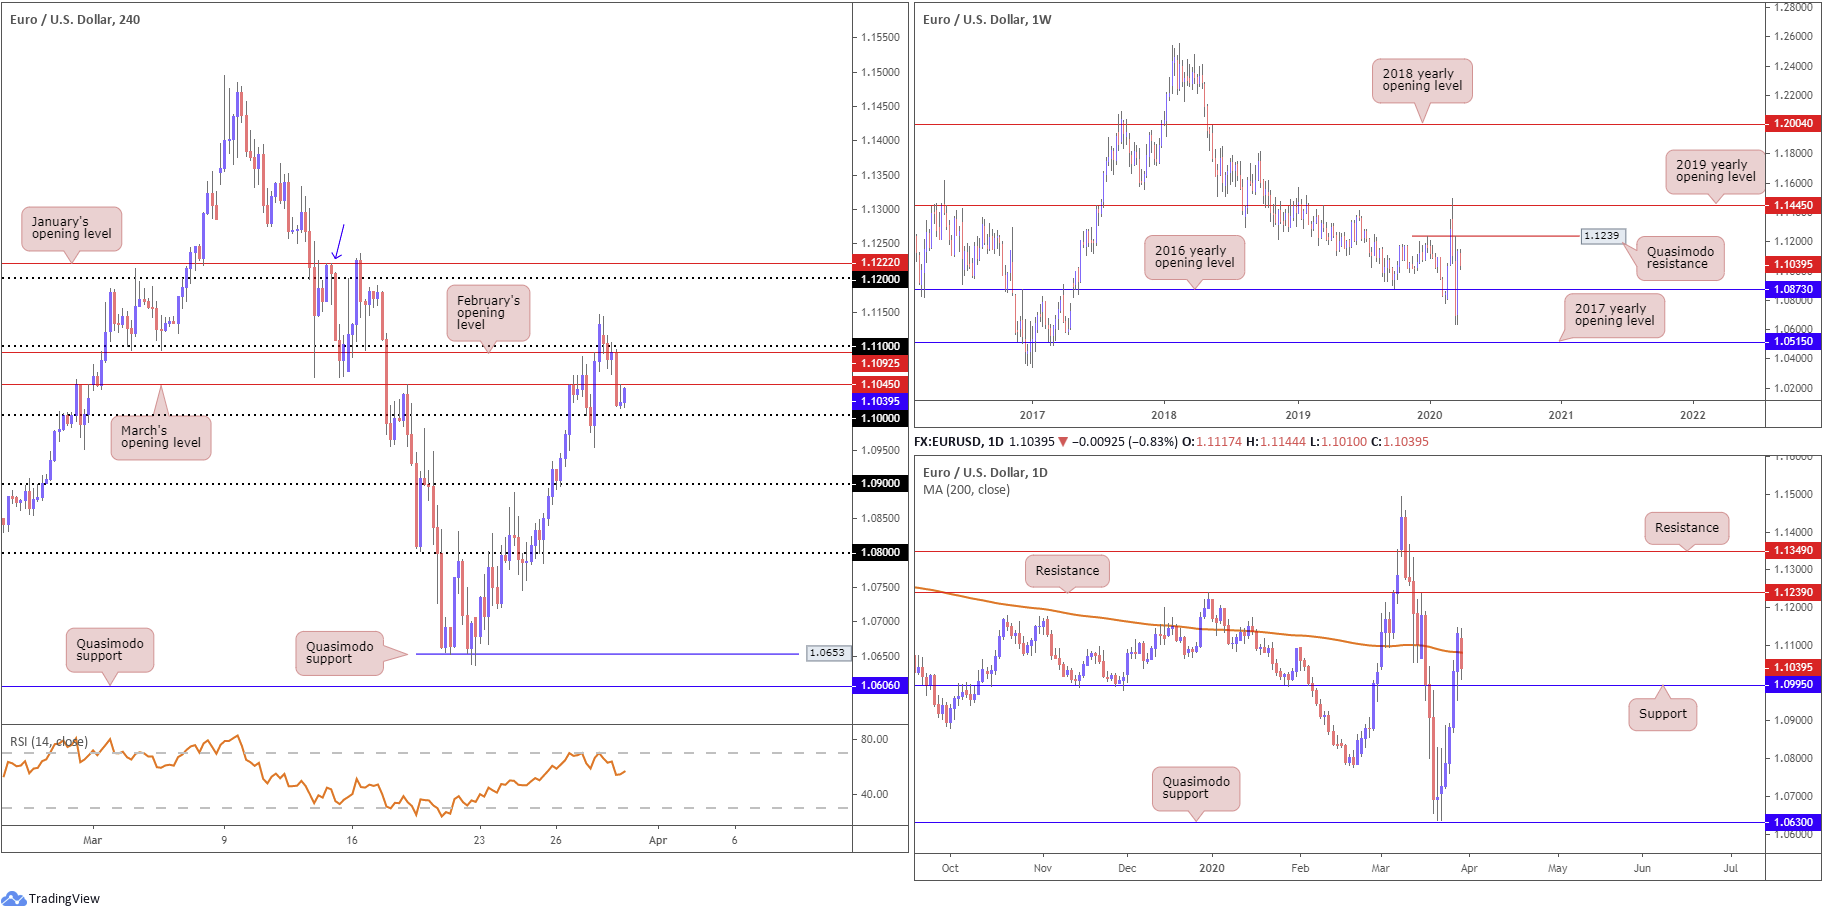
Monday had the US dollar index put in a stronger-than-expected recovery, firming north of 99.00 and reclaiming a large portion of Friday’s losses. This follows last week’s 3.50% correction off YTD peaks just south of 103.00. EUR/USD, based on H4 analysis, witnessed the pair reclaim 1.11 to the downside, followed by February’s opening level at 1.1092 and March’s opening level at 1.1045. Chart studies indicate 1.10, a widely watched key figure in this market, is next in the firing range as feasible support, with a break exposing a relatively free run to 1.09.
Leaving the 2017 yearly opening level at 1.0515 unchallenged on the weekly timeframe, EUR/USD staged an impressive recovery off multi-year lows at 1.0635 last week. Adding more than 430 points and recapturing all of the prior week’s losses, long-term flow made its way through the 2016 yearly opening level at 1.0873, potentially setting the stage for an approach to Quasimodo resistance at 1.1239.
The story on the daily timeframe shows price failed to sustain gains above the 200-day SMA (orange – 1.1080) yesterday, and appears poised to reconnect with support coming in at 1.0995. This, assuming the level takes hold, may pave the way for further gains to resistance at 1.1239, essentially denoting the same level as the weekly Quasimodo resistance highlighted above.
Areas of consideration:
The combination of 1.10 and daily support from 1.0995 may appeal this morning. Given 1.10 is considered a key figure, expect some form of whipsaw to materialise here to fill sell stops plotted south of the round number. Ultimately, buyers from this region would be looking for price to change hands above March’s opening level at 1.1045, with the expectation of a run to 1.11ish.
Alternatively, an engulf of 1.10 may unlock the door for bearish scenarios to 1.09. Conservative traders will likely seek a retest at 1.10 prior to pulling the trigger.
GBP/USD:
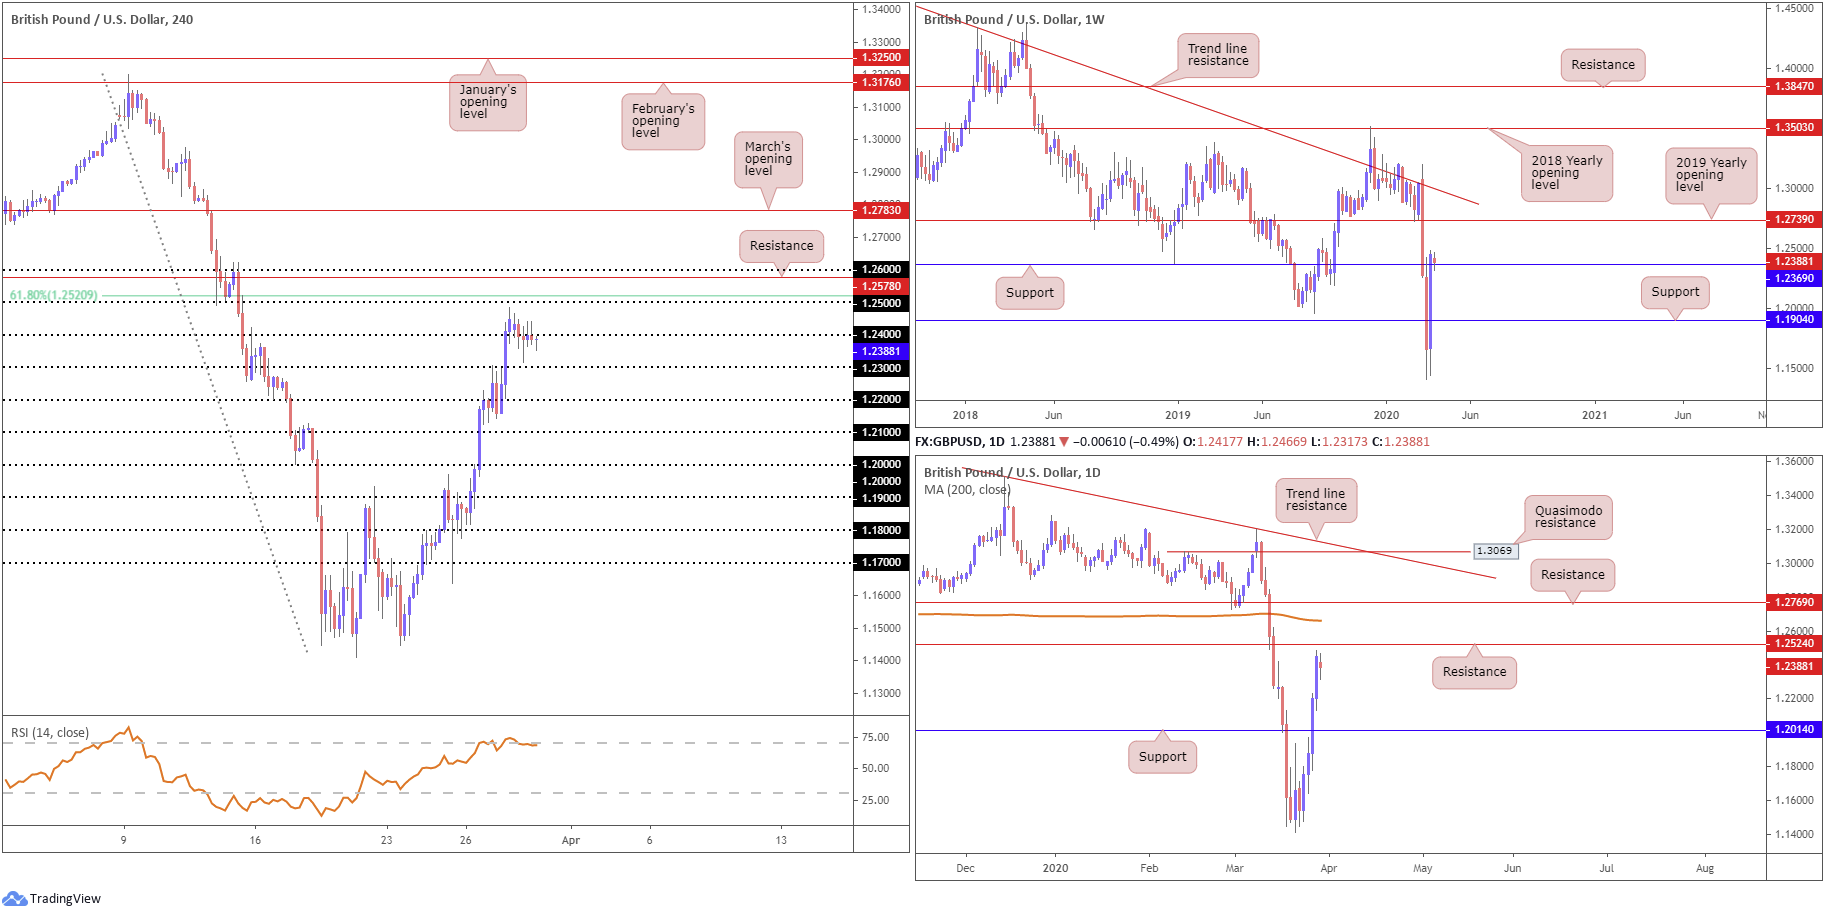
Sterling entered the week clutching a subdued vibe after a UK ratings downgrade from Fitch, with early trade dipping through 1.24 and holding the latter as resistance throughout the remainder of the session.
Although an approach to 1.23 could be at hand today, traders are urged to key in the 1.25 handle and 61.8% Fibonacci retracement ratio at 1.2520. A violation of this region could persuade further gains to resistance at 1.2578, taken from July 2019, and the round number 1.26. It may also interest some traders to note the relative strength index (RSI) is seen engaging with overbought levels.
Further afield on the weekly timeframe, last week’s vigorous climb firmed above resistance at 1.1904 and 1.2369, with the latter currently being retested as support. The next upside target for the week ahead falls in around the 2019 yearly opening level at 1.2739, with a break exposing long-term trend line resistance, taken from the high 1.5930.
After crossing daily resistance at 1.2014 (now a serving support), resistance lies in wait around the 1.2524 neighbourhood, trailed closely by the 200-day SMA (orange – 1.2661).
Areas of consideration:
Higher-timeframe projections on the weekly timeframe forecasts additional gains this week until shaking hands with 1.2739. Daily resistance at 1.2524 may throw a spanner in the works, however.
There’s not much (technical) evidence to suggest we’re heading lower from 1.24. 1.25 is the more likely destination, owing to its surrounding confluence from a 61.8% H4 Fibonacci ratio at 1.2520 and daily resistance at 1.2524. Therefore, this zone could be an area countertrend traders look to fade this week, targeting 1.24.
The next port of resistance falls in around the 1.26 handle on the H4 timeframe, enhanced by a H4 resistance level plotted at 1.2578, with the possibility of a fakeout seen to the 200-day SMA at 1.2661.
AUD/USD:
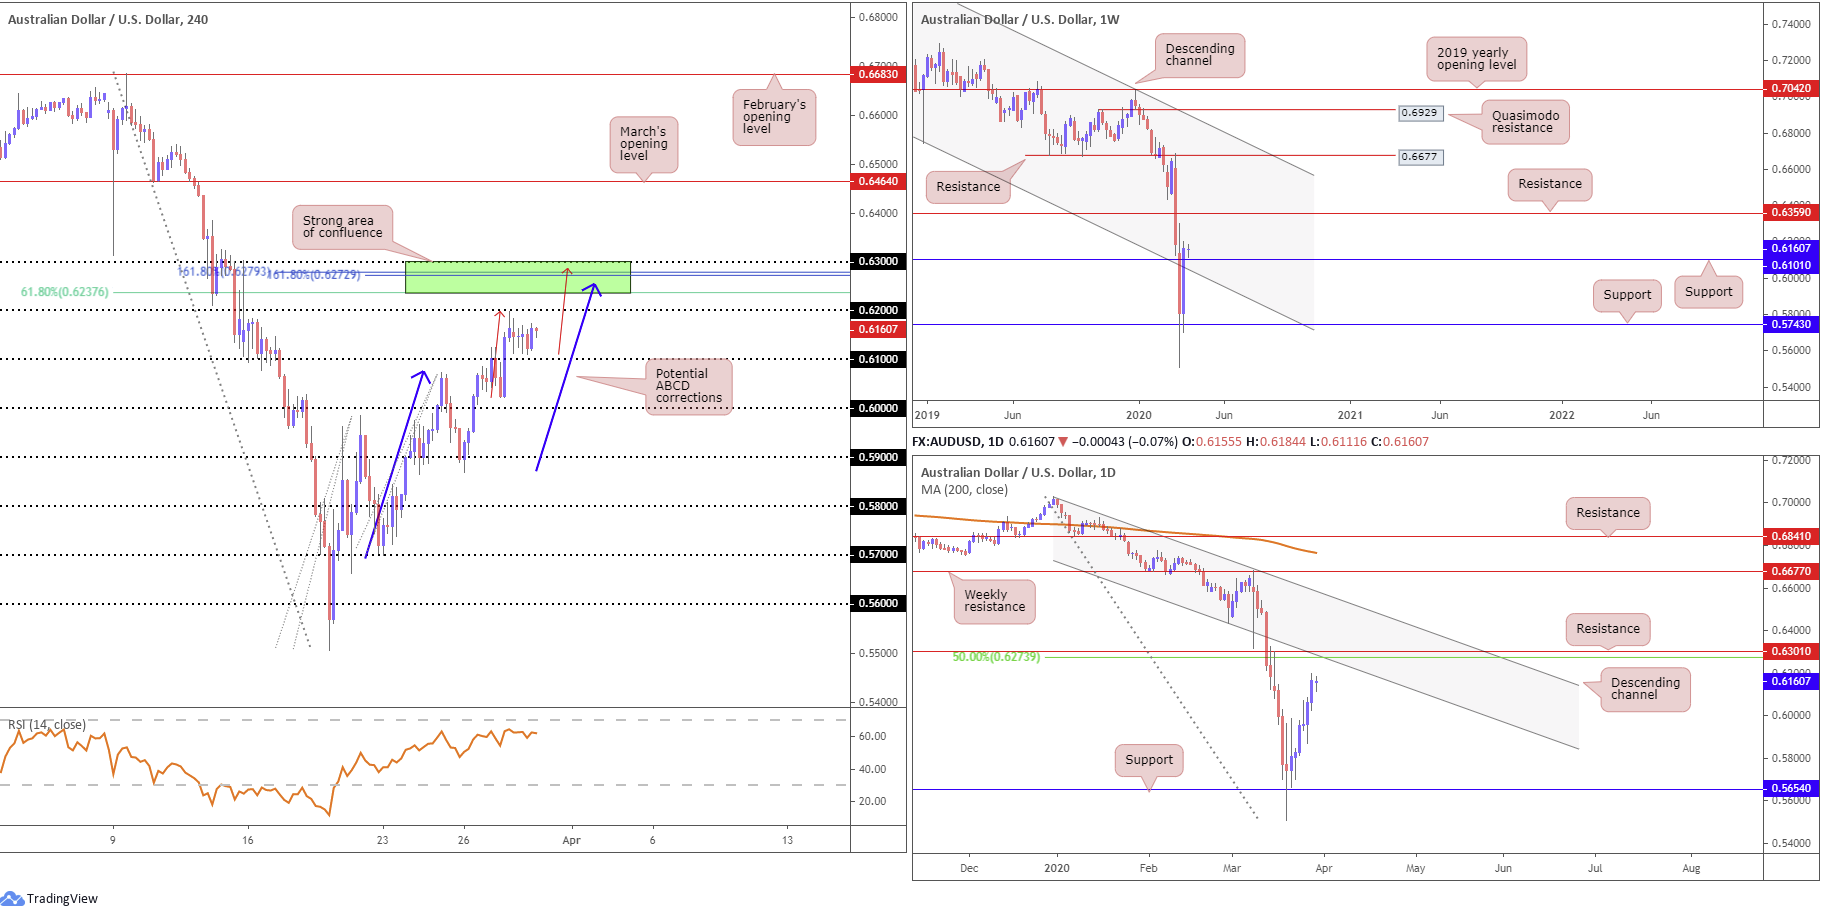
Month-end flows has AUD/USD holding space north of the 0.61 handle, despite a notable comeback in the US dollar index.
From the weekly timeframe, we can see the Australian dollar wrapped up last week a touch off best levels, accruing vigorous gains against the greenback exceeding 350 points. Price marginally closed above channel support-turned resistance, taken from the low 0.6744, and resistance at 0.6101, with the skies clear for a push to resistance coming in at 0.6359.
Starved of resistance on the daily timeframe, focus has shifted to resistance at 0.6301. Joined closely with a 50.0% retracement ratio carved in at 0.6273 and a channel support-turned resistance, extended from the low 0.6433, this area could be an issue for buyers this week.
Aside from H4 activity establishing ground above 0.61, what’s also notable from a technical perspective is two potential ABCD corrections (blue/red arrows), terminating at 0.6255 and 0.6289. Joining this region is the 0.63 handle, two 161.8% Fibonacci extensions at 0.6279 and 0.6272, a 61.8% Fibonacci retracement at 0.6237 and daily resistance at 0.6301 (green). The relative strength index (RSI), for those who follow momentum-based indicators, loiters around 65.00, a touch south of traditional overbought ground.
Areas of consideration:
Traders’ crosshairs are likely fixed on 0.63/0.6237 as an upside target for any long positions this week.
Further to this, 0.63/0.6237 represents a potential spot to consider bearish setups, in view of supporting structure.
USD/JPY:
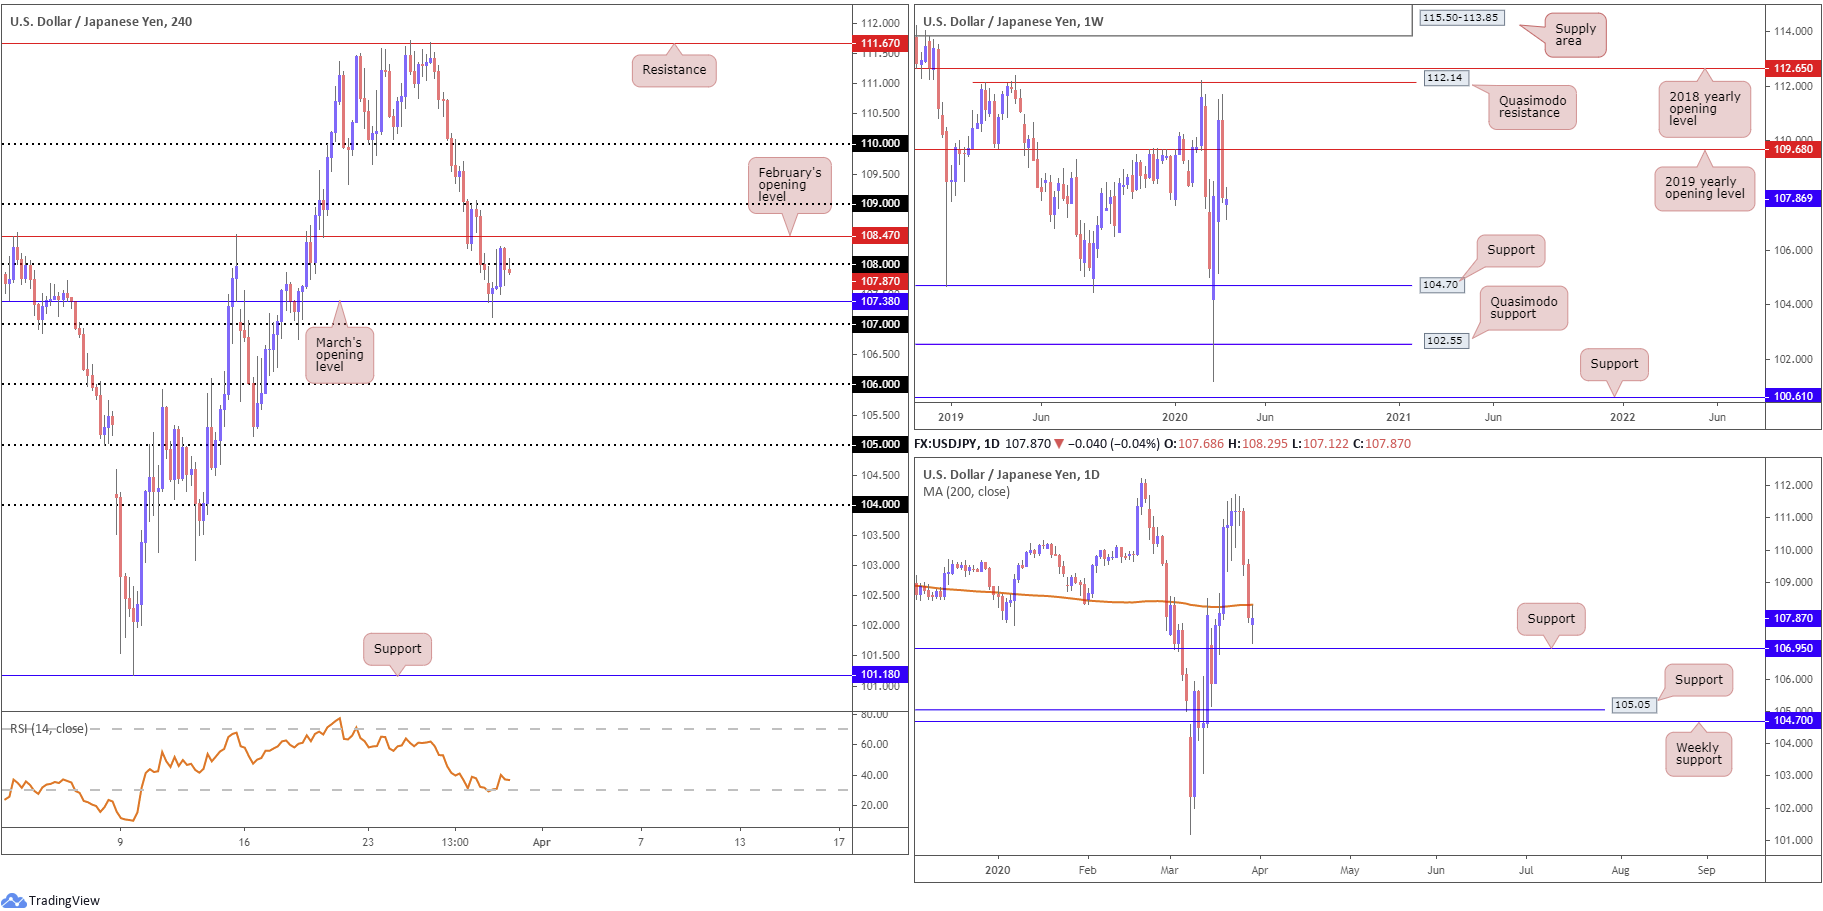
The explosive end-of-week correction consolidated Monday, eking out a modest gain off March’s opening level plotted at 107.38, resulting in a test of waters north of 108, a touch beneath February’s opening level at 108.47. Above 108.47 has 109 in sight, whereas a push through 107 underlines 106 as a feasible downside target. The relative strength index (RSI) is seen holding off oversold terrain, currently testing 37.05.
Technical action on the weekly timeframe left Quasimodo resistance at 112.14 unopposed, and pared a large portion of the prior-week’s gains last week, wiping off more than 280 points. Sustained downside on this timeframe is free to navigate lower levels until touching gloves with a familiar area of support coming in at 104.70. It might also interest some traders to note 104.70 denotes the lower boundary of a multi-month range between the said base and Quasimodo resistance mentioned above at 112.14.
Friday surrendered considerable ground, with USD/JPY eventually dipping its toes south of the 200-day SMA (orange – 108.30) and exposing support off 106.95 (a prior Quasimodo support level – September 2019). Note price is seen testing the underside of the said SMA value.
Areas of consideration:
Having noted room to explore lower levels on the weekly timeframe, as well as daily price testing the underside of its 200-day SMA value, H4 price reclaiming 108 to the downside in recent hours may be interpreted as an intraday bearish theme (particularly if the current H4 candle closes as is), targeting March’s opening level at 107.38, closely followed by 107 and then daily support found at 106.95.
The accuracy, completeness and timeliness of the information contained on this site cannot be guaranteed. IC Markets does not warranty, guarantee or make any representations, or assume any liability regarding financial results based on the use of the information in the site.
News, views, opinions, recommendations and other information obtained from sources outside of www.icmarkets.com.au, used in this site are believed to be reliable, but we cannot guarantee their accuracy or completeness. All such information is subject to change at any time without notice. IC Markets assumes no responsibility for the content of any linked site.
The fact that such links may exist does not indicate approval or endorsement of any material contained on any linked site. IC Markets is not liable for any harm caused by the transmission, through accessing the services or information on this site, of a computer virus, or other computer code or programming device that might be used to access, delete, damage, disable, disrupt or otherwise impede in any manner, the operation of the site or of any user’s software, hardware, data or property.


