
EUR/USD:
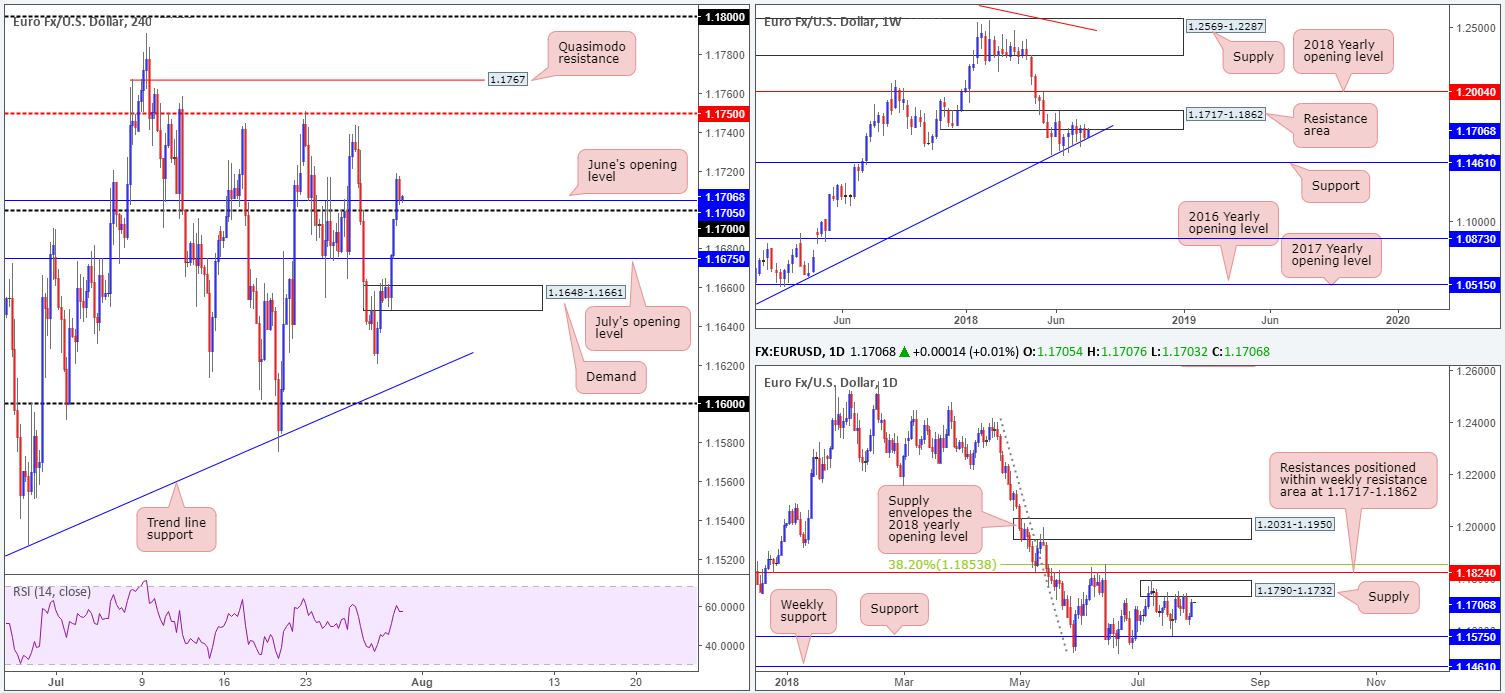
Paring a large portion of last week’s losses, EUR/USD bulls went on the offensive on Monday and bombarded its way through July’s opening level at 1.1675 on the H4 timeframe. Boosted by a softer dollar across the board, the single currency concluded the day closing above the 1.17 handle and nearby June’s opening level at 1.1705. Analysts attribute USD weakness to the GDP data released on Friday.
As of late May, weekly movement has been confined to a tight range comprised of a resistance area plotted at 1.1717-1.1862 and a trend line support (etched from the low 1.0340). Areas outside of this border to keep eyeballs on fall in at the 2018 yearly opening level drawn from 1.2004 (resistance), and support pencilled in at 1.1461.
Supply at 1.1790-1.1732, an area clearly of interest in this market at the moment on the daily timeframe, is likely to be brought back into the fold today, thanks to yesterday’s buying. On a wider perspective, however, traders are urged to remain conscious of the daily resistance seen directly above the said supply zone at 1.1824, shadowed closely by a 38.2% daily Fib resistance at 1.1853.
Areas of consideration:
A large number of traders are likely bullish this market today after the unit engulfed the 1.17 handle. While we agree, a retest off of this number as support (and its closely associated support at 1.1705 [June’s opening level]) is appealing, we maintain a fairly pessimistic outlook for this instrument on the higher timeframes. Why? Weekly action is seen shaking hands with the underside of a resistance area mentioned above at 1.1717-1.1862, along with daily price trading within striking distance of a supply at 1.1790-1.1732. For that reason, 1.17 is potentially fragile!
Should the 1.17 handle be taken out, what then? Of course, one could attempt to sell the market, knowing higher-timeframe structure is supporting a move lower. The only limitation being the nearby H4 support at 1.1675, followed by a strong-looking H4 demand at 1.1648-1.1661.
Today’s data points: German retail sales m/m; Spanish flash GDP q/q; Eurozone CPI figures; US core PCE price index m/m; Chicago PMI; US CB consumer confidence.
GBP/USD:
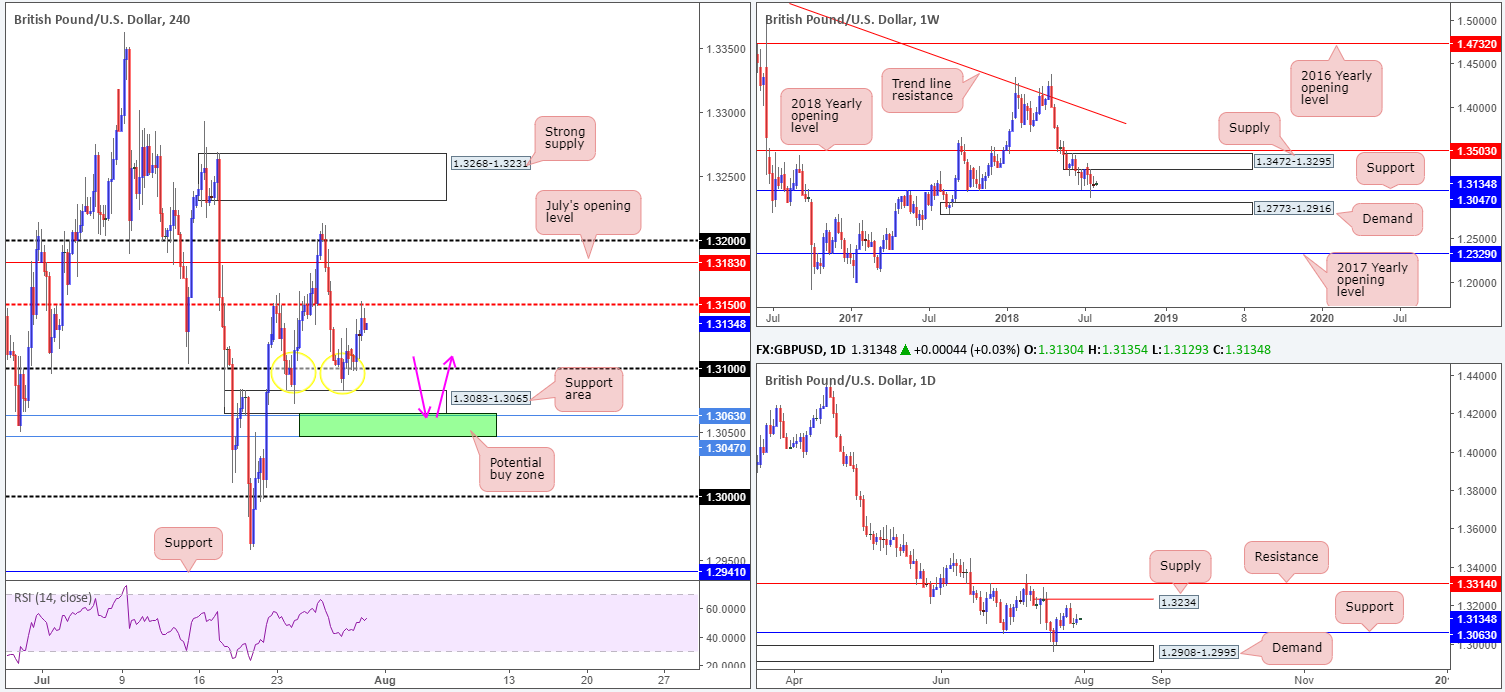
Sterling, as you can see, managed to establish support off the 1.31 handle on Monday, following Friday’s fakeout to a nearby H4 support area seen at 1.3083-1.3065 (yellow circle). Upside momentum, however, waned somewhat as the H4 candles approached mid-level resistance at 1.3150, consequently ending the session producing modest gains.
As we’re sure you’re aware, a number of driving forces are in play in this market at the moment: a softer dollar across the board; the BoE expected to lift rates by 25bps on Thursday; additional negative Brexit news flow released over the weekend via the Times on Sunday.
Technically speaking, though, higher-timeframe flows show weekly price remains buoyant above support at 1.3047, a barrier displaying history as far back as mid-2015. Daily price, on the other hand, continues to drift between a supply seen at 1.3234 and support priced in at 1.3063.
Areas of consideration:
The market likely has a soft spot for the small H4 area marked in green at 1.3047/1.3063, comprised of both the aforementioned weekly and daily supports. Besides its construction being made up of higher-timeframe levels, stop-loss orders beneath 1.31 and the noted H4 support area will also likely provide liquidity to those with big pockets looking to buy from here.
The first ‘trouble’ area from 1.3047/1.3063 can be seen at 1.31. A H4 close above this number would be an ideal cue to begin thinking about taking some profit off the table and reducing risk to breakeven.
Today’s data points: US core PCE price index m/m; Chicago PMI; US CB consumer confidence.
AUD/USD:
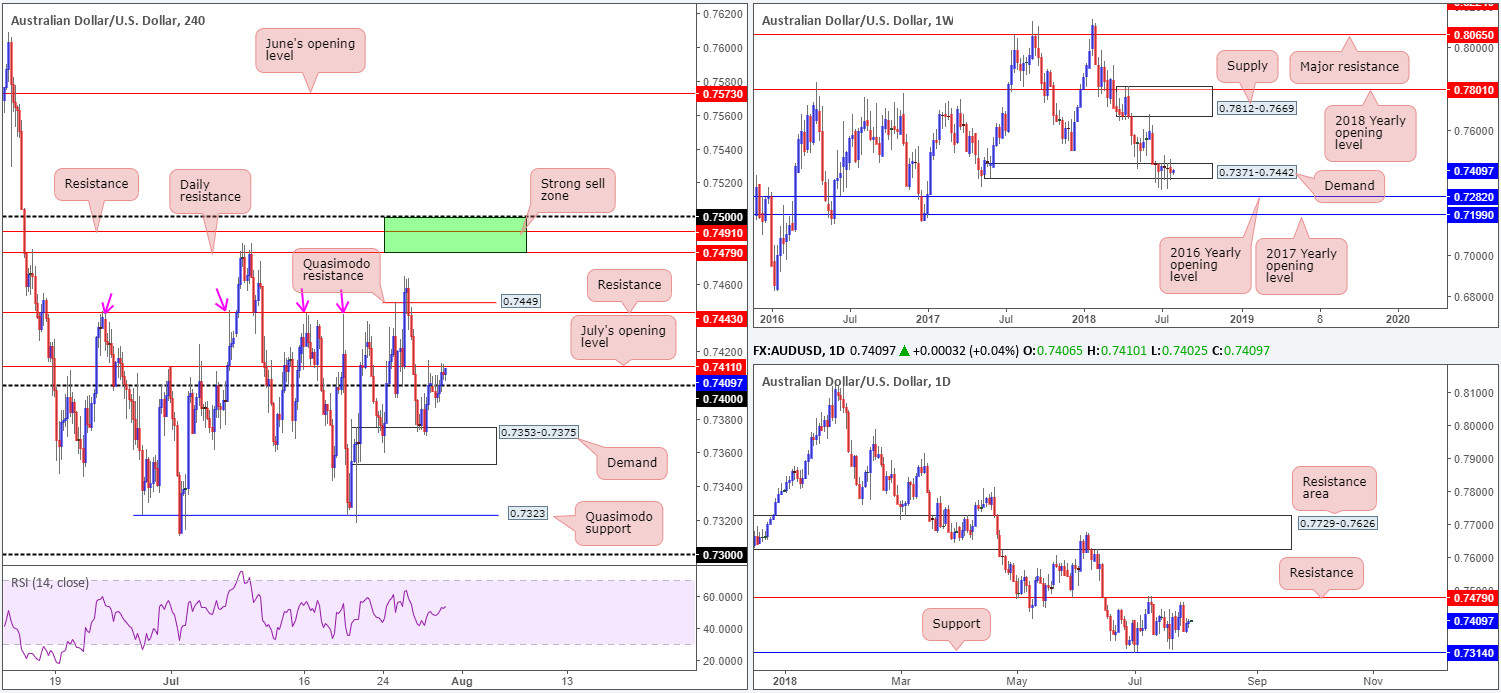
The Australian dollar is mildly stronger today against its US counterpart, after sellers lost their flavor beneath the 0.74 handle on the H4 timeframe amid Monday’s trade. Despite a weak USD, buyers are seen struggling to produce anything meaningful to the upside as nearby H4 resistance (in the form of July’s opening level) at 0.7411 is holding firm. As highlighted in Monday’s report, it’d be difficult for just about any technician to say H4 structure is not restricted right now. Between 0.7411 and 0.7443 (a H4 resistance), one has less than 30 pips to play with, whereas a push back beneath 0.74, sellers have the top edge of demand to target at 0.7375 – even less room!
In terms of weekly price action, little has changed over the past month. Demand at 0.7371-0.7442, as you can see, remains in a fragile state, opening the window to a possible test of the 2016 yearly opening level at 0.7282 sometime down the road. In the event the bulls regain consciousness, however, a retest of supply at 0.7812-0.7669 may eventually be on the cards. The reason behind the lack of movement on the weekly timeframe, technically that is, likely has something to do with the fact daily flow continues to respect its current range. Since early July, the commodity currency has fluctuated between support drawn from 0.7314 and resistance chalked up at 0.7479.
Areas of consideration:
On account of the above, either a long or short still appears to be a challenge. Remaining on the sidelines may, therefore, be the safer bet for the time being.
Today’s data points: Australian building approvals m/m; China manufacturing PMI; US core PCE price index m/m; Chicago PMI; US CB consumer confidence.
USD/JPY:
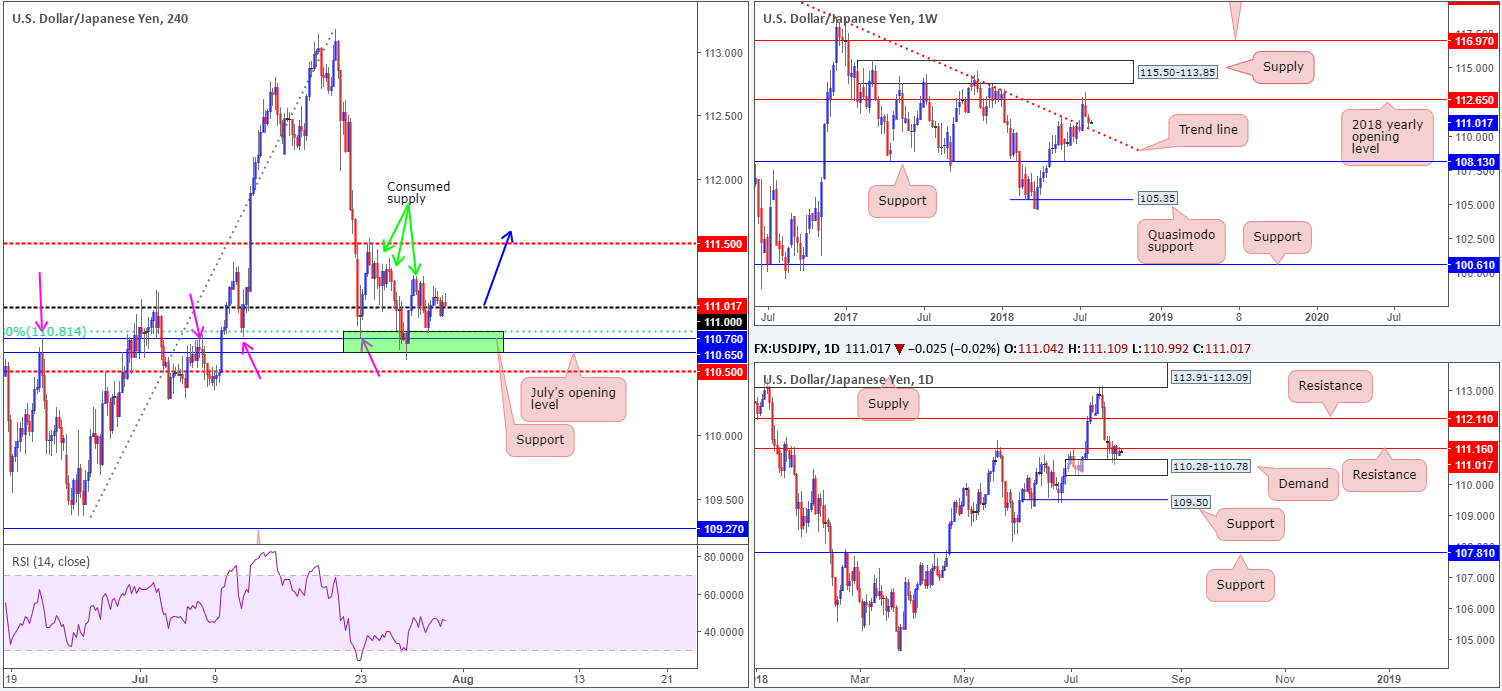
Opening with a look at the weekly timeframe this morning, the market recently bumped heads with a trend line resistance-turned support (taken from the high 123.57). Having seen this line hold firm as resistance on a number of occasions in the past, it’s likely a round of buying could take place from here.
What’s also notable about the current weekly trend line support is it converges with the top edge of daily demand posted at 110.28-110.78. Regrettably, though, nearby daily resistance at 111.16 is proving a troublesome barrier to overcome. Beyond this line, resistance is not expected to enter the fold until 112.11.
Monday’s intraday movement edged its way above the 111 handle on the H4 timeframe, but failed to yield much follow-through buying. This likely has something to do with seller interest stemming from the aforementioned daily resistance level. Below 111 on the H4 scale, it’s also worth pointing out an interesting area of support marked in green at 110.65/110.81 (comprised of July’s opening level, a support level and a 61.8% Fib support).
Areas of consideration:
Should H4 price continue to reside above 111 today, and chalk up a H4 full or near-full-bodied bull candle (stop-loss orders generally best placed beyond the rejection candle’s tail) this would, in our view, be enough to consider longs in this market. Our rationale behind this approach comes from the possibility of weekly buyers lifting price action higher off its trend line support and eventually breaking through daily resistance. Adding to this, to the left of current price (above 111) we see limited supply (see H4 chart – green arrows). As for take-profit targets, the ultimate area of interest falls in at the 2018 yearly opening level seen on the weekly timeframe drawn from 112.65 – the next upside target on that scale.
Today’s data points: US core PCE price index m/m; Chicago PMI; US CB consumer confidence; BoJ outlook report, monetary policy statement, policy rate and press conference.
USD/CAD:
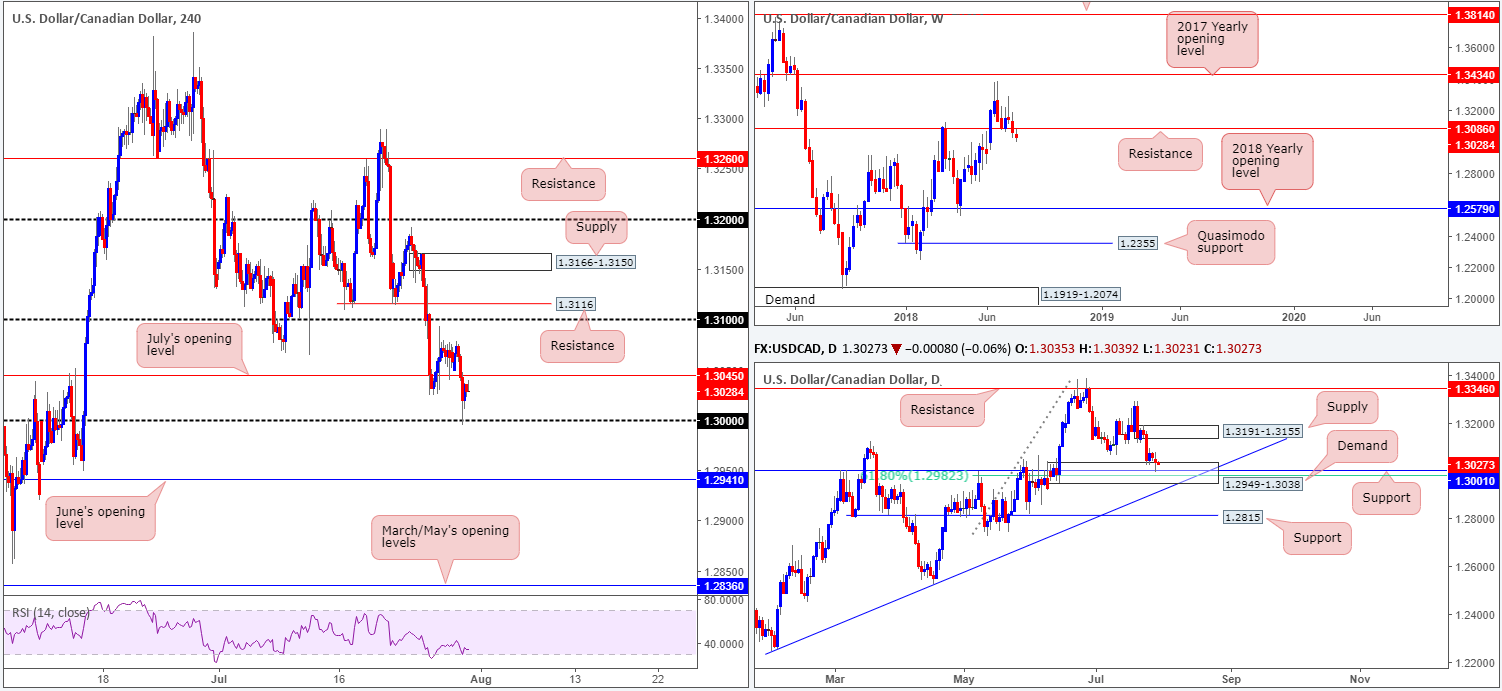
With oil prices strengthening on Monday along with the USD weakening, it should not come as a surprise to see the USD/CAD lower this morning. The pair broke through July’s opening level at 1.3045 (H4 support-turned resistance) and connected with the key figure 1.30. As you can see, 1.30 proved a defensive level, causing the unit to trim a modest portion of recent losses into Monday’s close.
On a wider perspective, the weekly candles are seen lurking beneath support coming in at 1.3086 (now acting resistance). In terms of obvious support beneath 1.3086, we do not see a whole lot stopping this market from reaching as far south as 1.2579: the 2018 yearly opening level. In spite of last week’s close beneath weekly support, daily price remains toying with a rather attractive demand area visible at 1.2949-1.3038. Within this area we also see strong support standing at 1.3001 (history dating back to Sept 2016 – brought into the fray yesterday), followed closely by a 61.8% Fib support value at 1.2982. The next upside target from this area can be seen around supply fixed at 1.3191-1.3155.
Areas of consideration:
In view of July’s opening level at 1.3045 likely to act as resistance, buying this market is a chancy move, despite coming from daily demand. A better, more conservative, route, therefore, might be to wait and see if H4 bulls can penetrate 1.3045 and retest it as support. From here, intraday targets fall in around weekly resistance at 1.3086, followed by the 1.31 handle on the H4 timeframe. It is tight between 1.3045/1.3086, we agree, but with a small enough stop-loss order, risk/reward could still turn out favorable.
Another alternative might be to watch 1.30 for a second retest as support today. Should a H4 full or near-full-bodied bull candle print from this region, a long (with stops tucked beneath the candle’s rejection tail) could be an option, targeting a close above 1.3045 as a trigger to reduce risk to breakeven.
Today’s data points: US core PCE price index m/m; Chicago PMI; US CB consumer confidence; Canadian inflation figures.
USD/CHF:
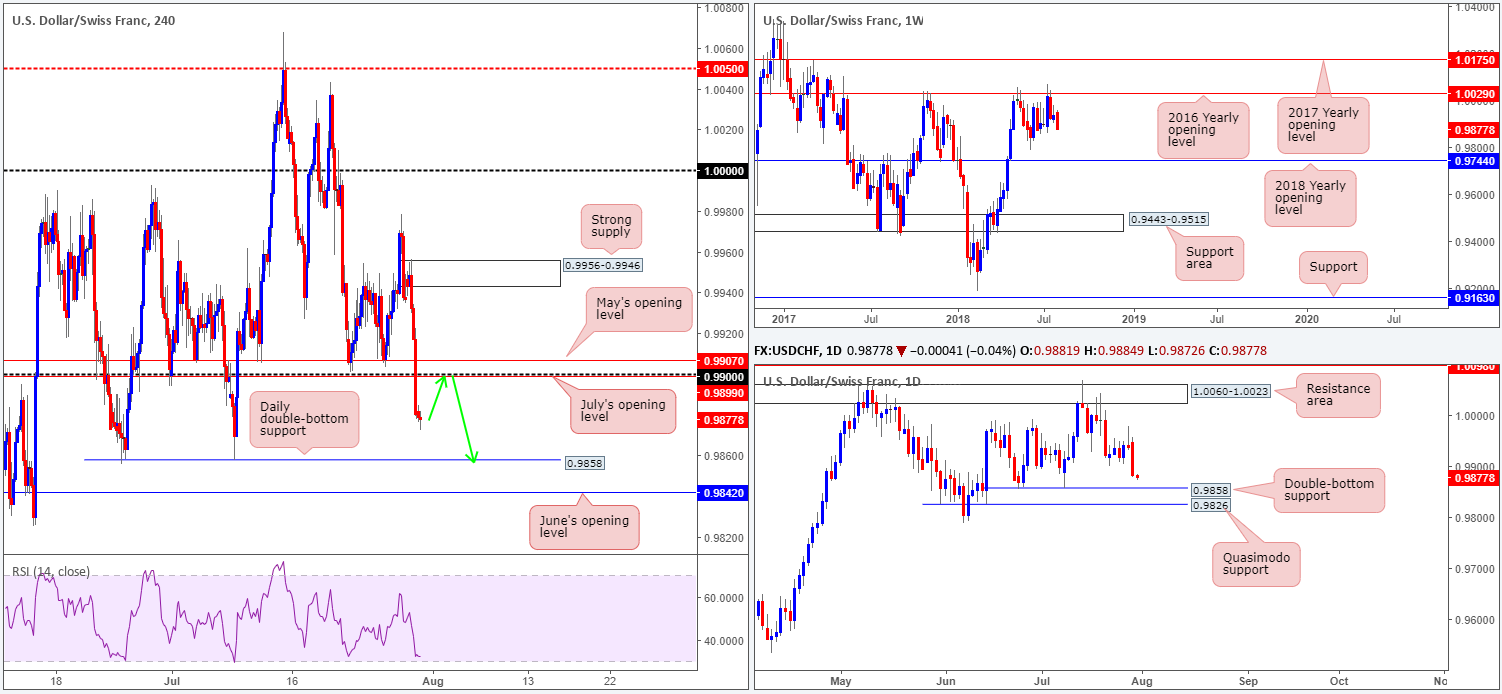
The US dollar weakened in aggressive fashion against its Swiss counterpart on Monday, chewing through a number of H4 technical supports along the way!
From a weekly perspective, further downside was to be expected. Weekly price remains capped by the 2016 yearly opening level at 1.0029. Holding price lower on two occasions in 2017, and twice already in 2018, this level commands attention! Further selling from current price has the June lows at 0.9788 to target, as well as the 2018 yearly opening level at 0.9744. In terms of daily action, recent selling has positioned the pair within striking distance of 0.9858: a double-bottom support, shadowed closely by Quasimodo support at 0.9826.
Areas of consideration:
Having seen the 0.99 handle taken out as support on the H4 timeframe, along with nearby supports at 0.9899/0.9907 (July and May’s opening level), this area could offer traders a platform to short today.
A retest to the underside of 0.9907-0.9899 in the shape of a full or near-full-bodied H4 bearish candle would, in our view, be enough to validate further selling down to at least daily (double-bottom) support mentioned above at 0.9858 (green arrows).
Today’s data points: US core PCE price index m/m; Chicago PMI; US CB consumer confidence.
Dow Jones Industrial Average:
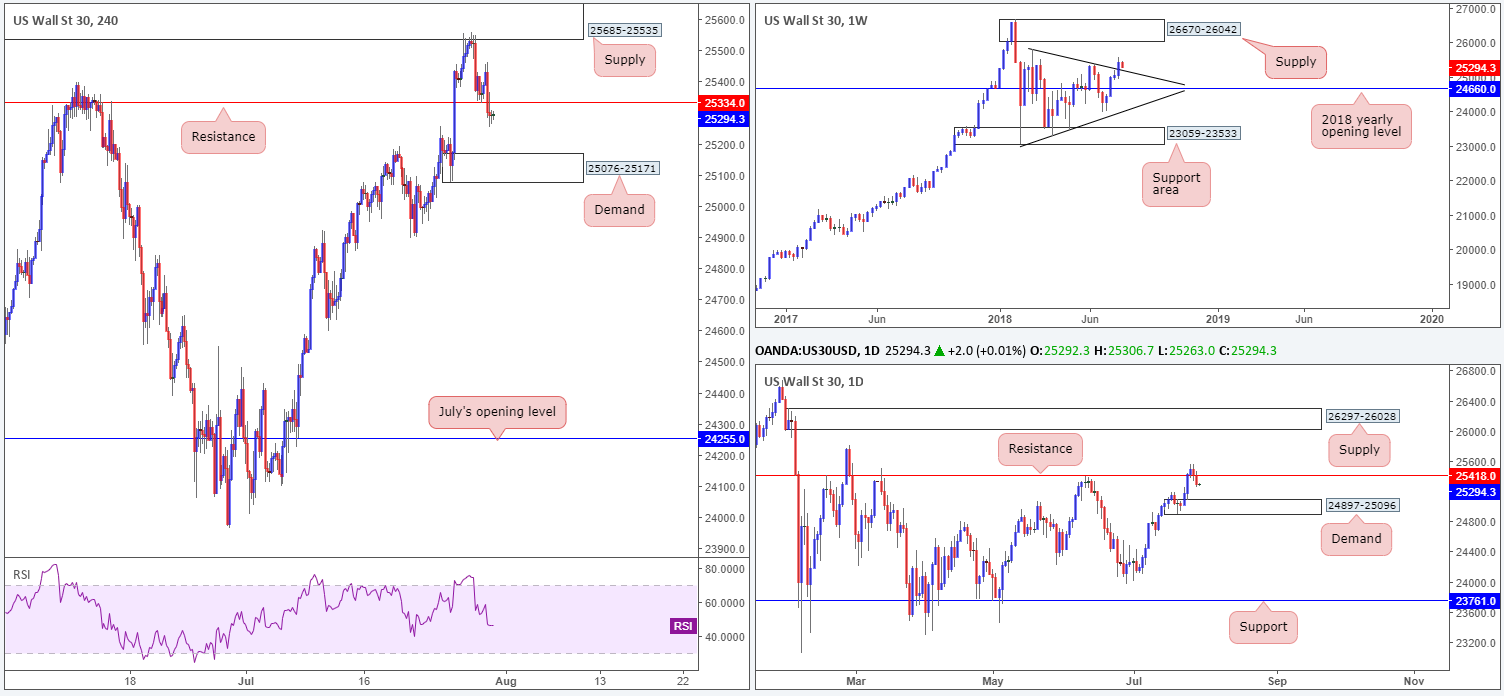
US equities extended downside momentum on Monday as tech-giants continued to suffer sharp losses on last week’s disappointing earnings.
Weekly traders need to remain prepared for the possibility of a retest of the recently broken trend line resistance-turned support (etched from the high 25807). Meanwhile, on the daily timeframe, the candles appear poised to test demand printed at 24897-25096 after crunching back beneath support at 25418 (now acting resistance).
H4 demand at 25076-25171, glued to the top edge of the aforementioned daily demand zone, is next in line for some action on the H4 scale, after price broke back beneath support at 25334 (now acting resistance).
Areas of consideration:
Seeing as how both daily and H4 demand areas are located nearby the weekly trend line support, a buy from the current H4 demand base is an option today. Conservative traders, nevertheless, may opt to wait and see if daily price probes lower into the noted daily demand area (implies a fakeout of the H4 demand), before pulling the trigger. That way, one has a relatively safe position to site stops: the underside of daily demand at 24897.
Today’s data points: US core PCE price index m/m; Chicago PMI; US CB consumer confidence.
The use of the site is agreement that the site is for informational and educational purposes only and does not constitute advice in any form in the furtherance of any trade or trading decisions.
The accuracy, completeness and timeliness of the information contained on this site cannot be guaranteed. IC Markets does not warranty, guarantee or make any representations, or assume any liability with regard to financial results based on the use of the information in the site.
News, views, opinions, recommendations and other information obtained from sources outside of www.icmarkets.com.au, used in this site are believed to be reliable, but we cannot guarantee their accuracy or completeness. All such information is subject to change at any time without notice. IC Markets assumes no responsibility for the content of any linked site. The fact that such links may exist does not indicate approval or endorsement of any material contained on any linked site.
IC Markets is not liable for any harm caused by the transmission, through accessing the services or information on this site, of a computer virus, or other computer code or programming device that might be used to access, delete, damage, disable, disrupt or otherwise impede in any manner, the operation of the site or of any user’s software, hardware, data or property.


