
DXY:
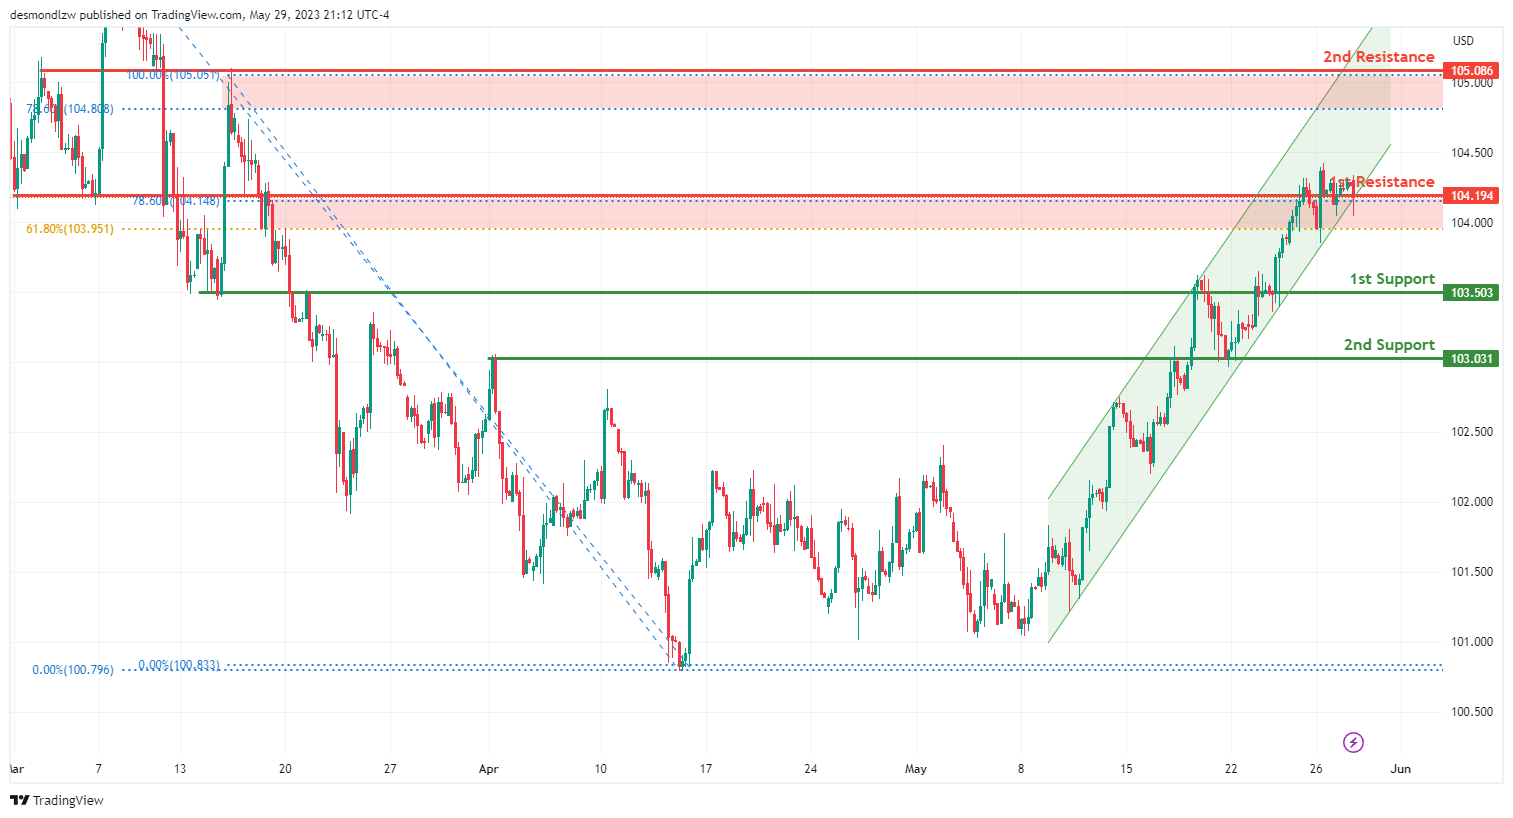
The DXY chart currently displays a weak bearish momentum, although with low confidence. The potential factors contributing to this momentum are the possibility of the price breaking below an ascending trendline, which could trigger a bearish continuation towards the first support level.
The first support level at 103.50 level serves as an important support area, identified as an overlap support. This level carries significance due to its historical relevance as a price level where buyers have previously entered the market.
Additionally, there is a second support level at 103.03, the second support level is also an overlap support. Previous instances of price action bouncing off this level provide additional credibility to its importance as a potential support area.
On the resistance side, the first resistance level at 104.19 level represents an overlap resistance and aligns with the 78.60% Fibonacci retracement. This confluence of technical factors adds strength to the resistance level and suggests it may act as a barrier to upward price movements.
Furthermore, there is a second resistance level at 105.09 is identified as an overlap resistance. This level has previously shown its significance as a price level where selling pressure has emerged.
EUR/USD:
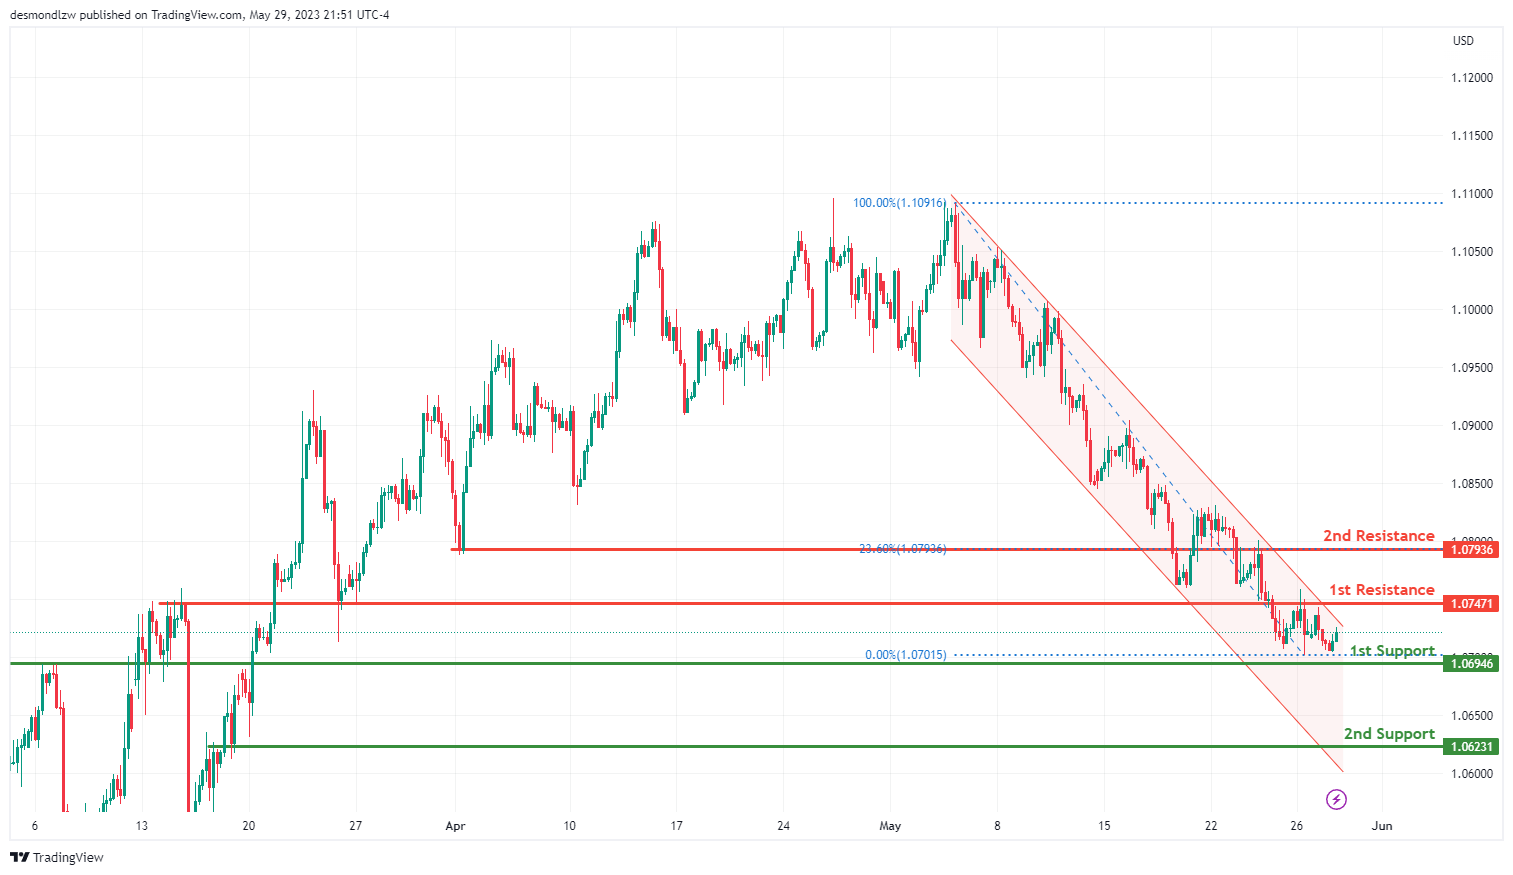
The EUR/USD chart currently exhibits a bearish momentum, characterized by being in a bearish descending channel. This suggests a potential continuation of the downward trend, indicating a negative sentiment in the market.
The first support level at 1.0695 serves as a significant support area, identified as an overlap support. This level carries historical importance as a price level where buyers have previously entered the market, making it a key support area to monitor.
Additionally, there is a second support level at 1.0623 which is also an overlap support. Previous instances of price action bouncing off this level provide additional credibility to its importance as a potential support area.
On the resistance side, the first resistance level at 1.0747 represents an overlap resistance. This level may act as a temporary barrier to upward price movements, potentially causing a pause or retracement in the bearish trend.
Furthermore, there is a second resistance level at 1.0794 that is identified as an overlap resistance. This level has previously shown its significance as a price level where selling pressure has emerged. Additionally, it aligns with the 23.60% Fibonacci retracement, adding further strength to its potential as a resistance area.
GBP/USD:
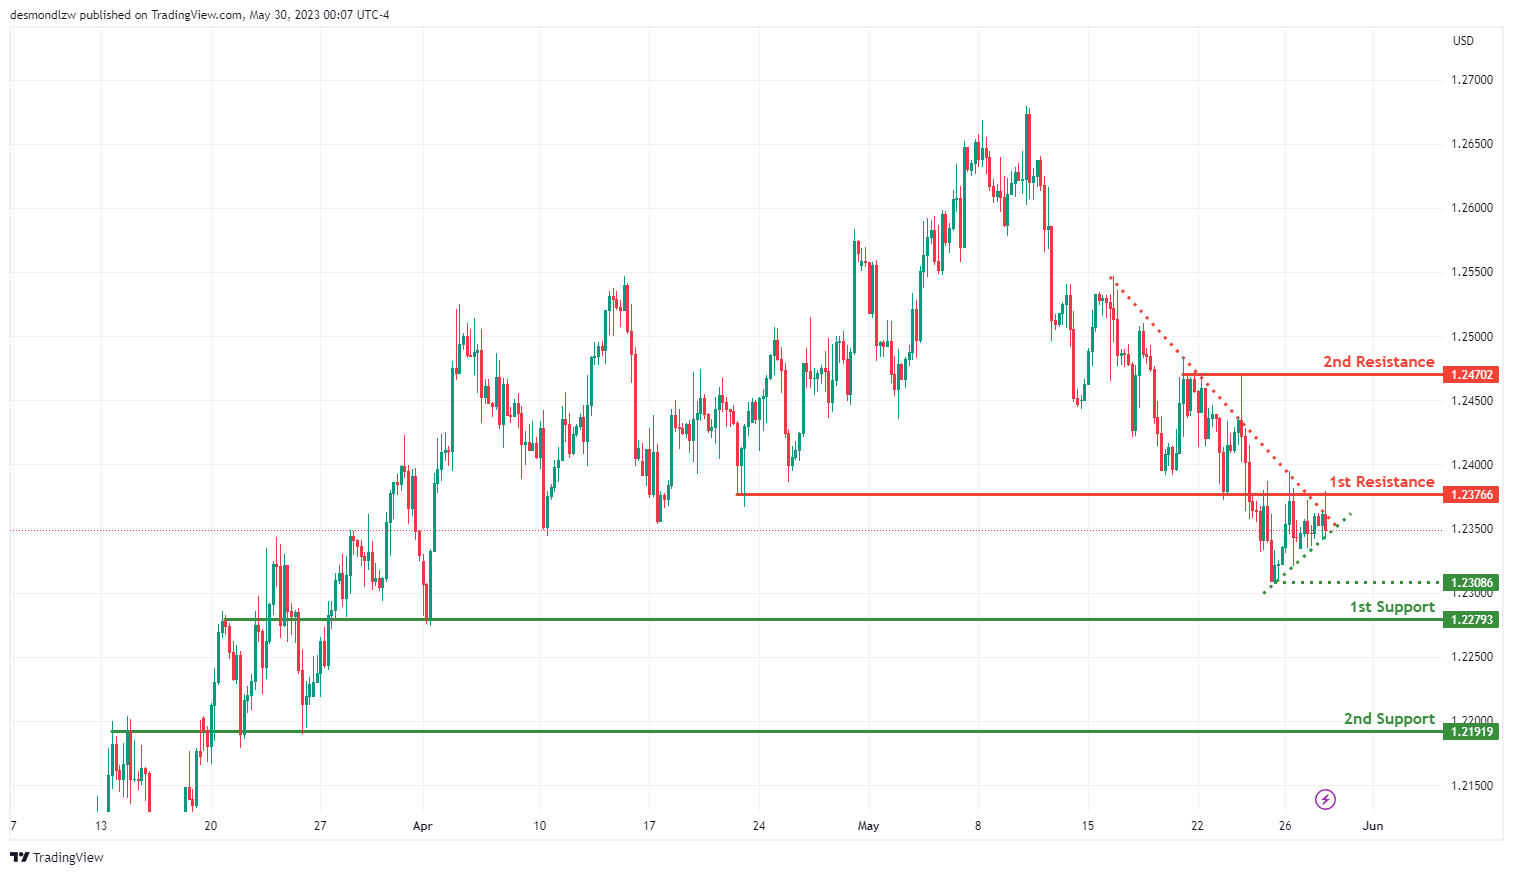
The GBP/USD chart currently exhibits a bearish momentum, characterized by a bearish symmetrical triangle pattern. This pattern suggests a potential continuation of the downward trend, indicating a negative sentiment in the market. Price could break below the ascending support line, triggering a potential bearish move.
The first support level at 1.2279 serves as a significant support area, identified as an overlap support. This level carries historical importance as a price level where buyers have previously entered the market, making it a key support area to monitor.
Additionally, there is a second support level at 1.2192, the second support level is also an overlap support. Previous instances of price action bouncing off this level provide additional credibility to its importance as a potential support area.
On the resistance side, the first resistance level at 1.2377 represents an overlap resistance. This level may act as a temporary barrier to upward price movements, potentially causing a pause or retracement in the bearish trend.
Furthermore, there is a second resistance level at 1.2470 that is identified as an overlap resistance. This level has previously shown its significance as a price level where selling pressure has emerged.
USD/CHF:
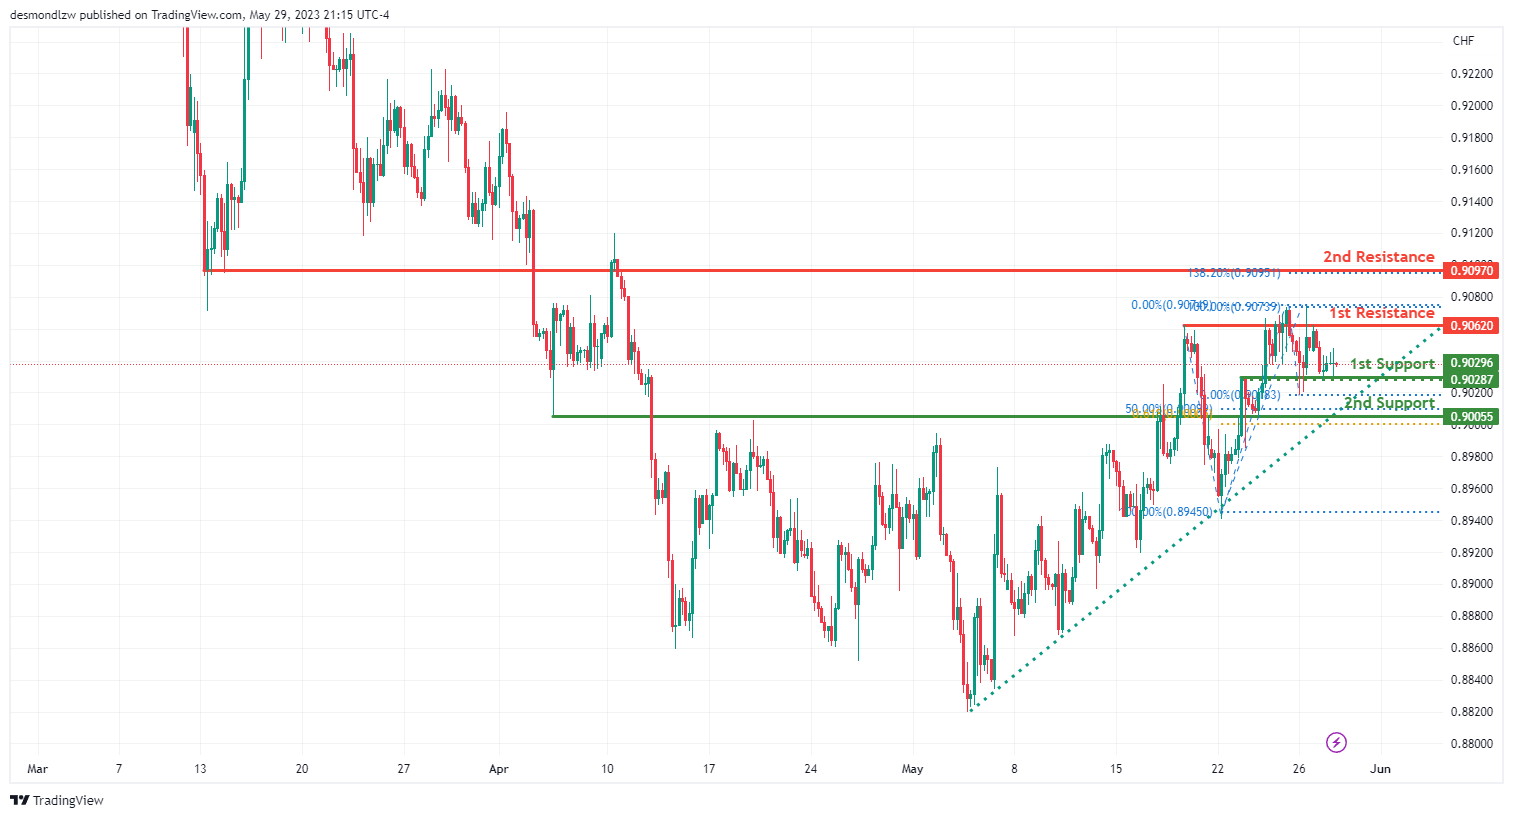
The USD/CHF chart currently exhibits a weak bullish momentum, although with low confidence. This suggests a potential continuation of the upward trend, but with uncertainty surrounding the strength of the bullish sentiment. There is a possibility of a bullish continuation towards the first resistance level at 0.9062.
The first support level at 0.9030 serves as a significant support area that is identified as an overlap support. This level carries historical importance as a price level where buyers have previously entered the market, making it a key support area to monitor.
Additionally, there is a second support level at 0.9006 which is also an overlap support. This level carries additional significance as it aligns with the 50% Fibonacci retracement and 61.80% Fibonacci projection, adding strength to its potential as a support area.
On the resistance side, the first resistance level at 0.9062 represents an overlap resistance. This level may act as a temporary barrier to further upward price movements, potentially causing a pause or retracement in the bullish trend.
Furthermore, there is a second resistance level at 0.9097 that is identified as an overlap resistance. This level has previously shown its significance as a price level where selling pressure has emerged. Additionally, it aligns with the 138.20% Fibonacci expansion, adding further strength to its potential as a resistance area.
USD/JPY:
The USD/JPY chart currently exhibits a bullish momentum, characterized by being in a bullish ascending channel. This suggests a potential continuation of the upward trend, indicating a positive sentiment in the market. There is a possibility of a bullish continuation towards the intermediate resistance level at 140.89.
On the support side, the first support level at 138.80 serves as a significant support area, identified as an overlap support. This level carries historical importance as a price level where buyers have previously entered the market, making it a key support area to monitor.
Additionally, there is a second support level at 137.71 which is also an overlap support. Previous instances of price action bouncing off this level provide additional credibility to its importance as a potential support area.
On the resistance side, the first resistance level at 142.26 represents an overlap resistance. This level may act as a temporary barrier to further upward price movements, potentially causing a pause or retracement in the bullish trend.
USD/CAD:
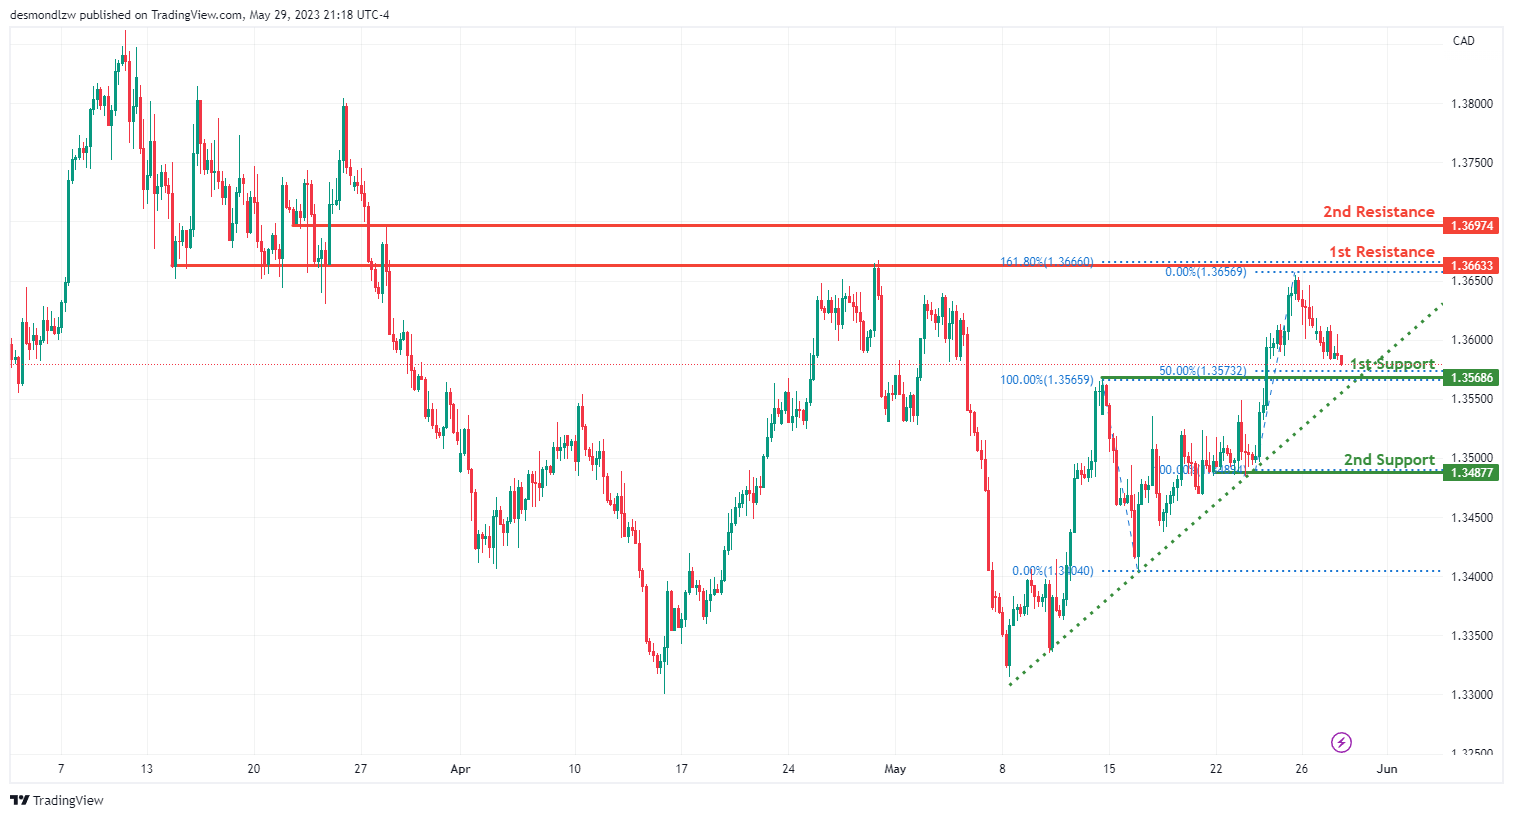
The USD/CAD chart currently exhibits a bullish momentum, suggesting a potential continuation of the upward trend. This bullish sentiment indicates a favorable environment for further price appreciation.
The first support level at 1.3569 serves as a significant support area that is identified as an overlap support. This level carries historical importance as a price level where buyers have previously entered the market. Additionally, it aligns with the 50% Fibonacci retracement, further reinforcing its significance as a potential support area.
Additionally, there is a second support level at 1.3488 which is also an overlap support. Previous instances of price action bouncing off this level provide additional credibility to its importance as a potential support area.
On the resistance side, the first resistance level at 1.3663 that represents an overlap resistance. This level may act as a temporary barrier to further upward price movements, potentially causing a pause or retracement in the bullish trend. Additionally, it aligns with the 161.80% Fibonacci extension, adding strength to its potential as a resistance area.
Additionally, there is a second resistance level at 1.3697 that is identified as an overlap resistance. This level has previously shown its significance as a price level where selling pressure has emerged.
AUD/USD:
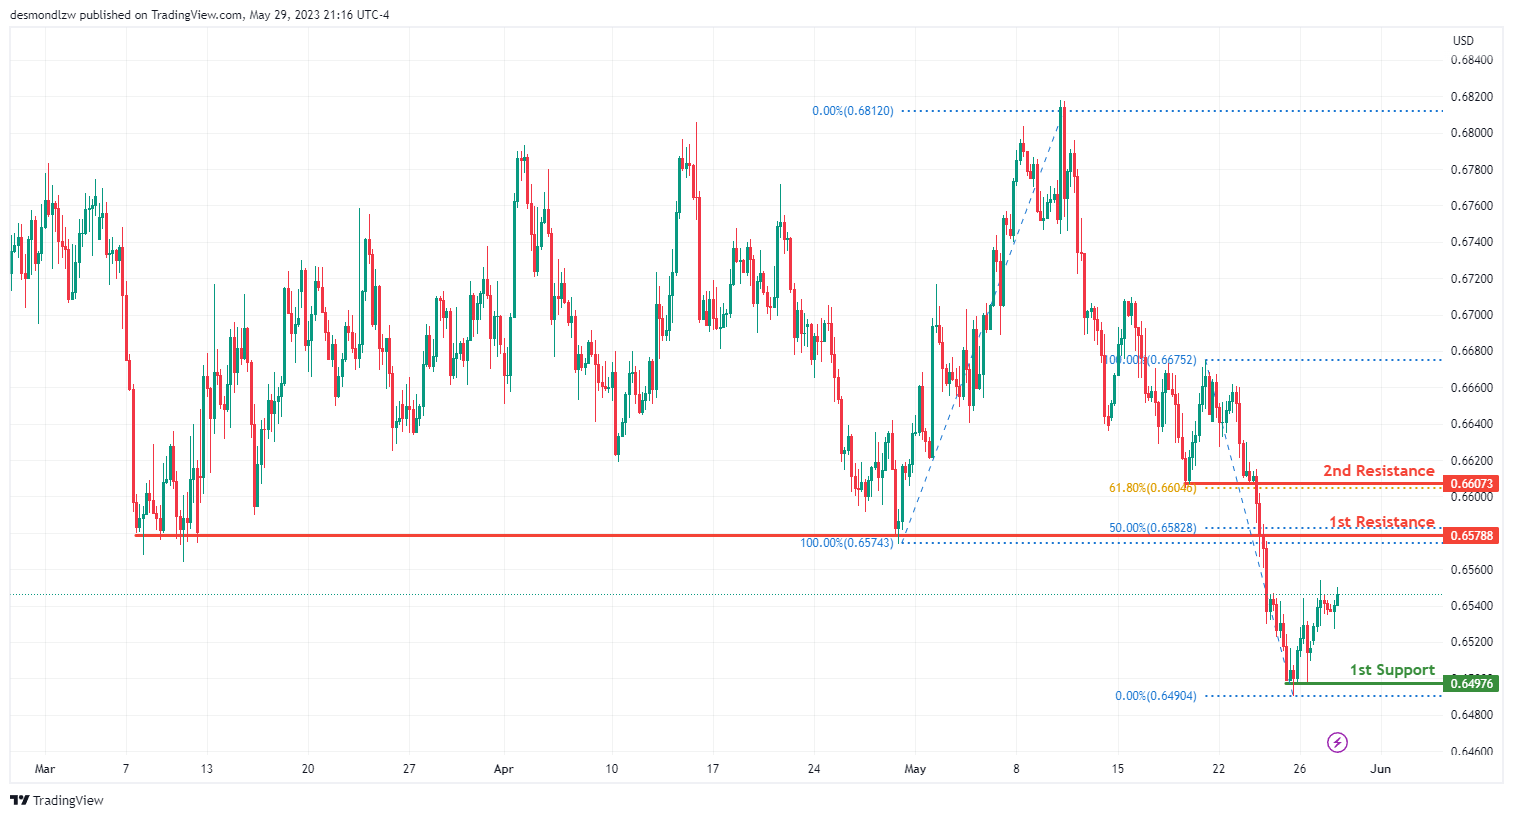
The AUD/USD chart currently exhibits a strong bearish momentum, suggesting a potential continuation of the downward trend. This bearish sentiment indicates a negative outlook for the currency pair.
On the support side, the first support level at 0.6498 serves as a significant support area, identified as a swing low support. This level carries historical importance as a price level where buyers have previously entered the market, making it a key support area to monitor.
On the resistance side, the first resistance level at 0.6579 that represents an overlap resistance. This level may act as a temporary barrier to upward price movements, potentially causing a pause or retracement in the bearish trend. Additionally, it aligns with the 50% Fibonacci retracement, adding further strength to its potential as a resistance area.
Furthermore, there is a second resistance level at 0.6607 that is identified as an overlap resistance. This level has previously shown its significance as a price level where selling pressure has emerged. Additionally, it aligns with the 61.80% Fibonacci retracement, further reinforcing its potential as a resistance area.
NZD/USD
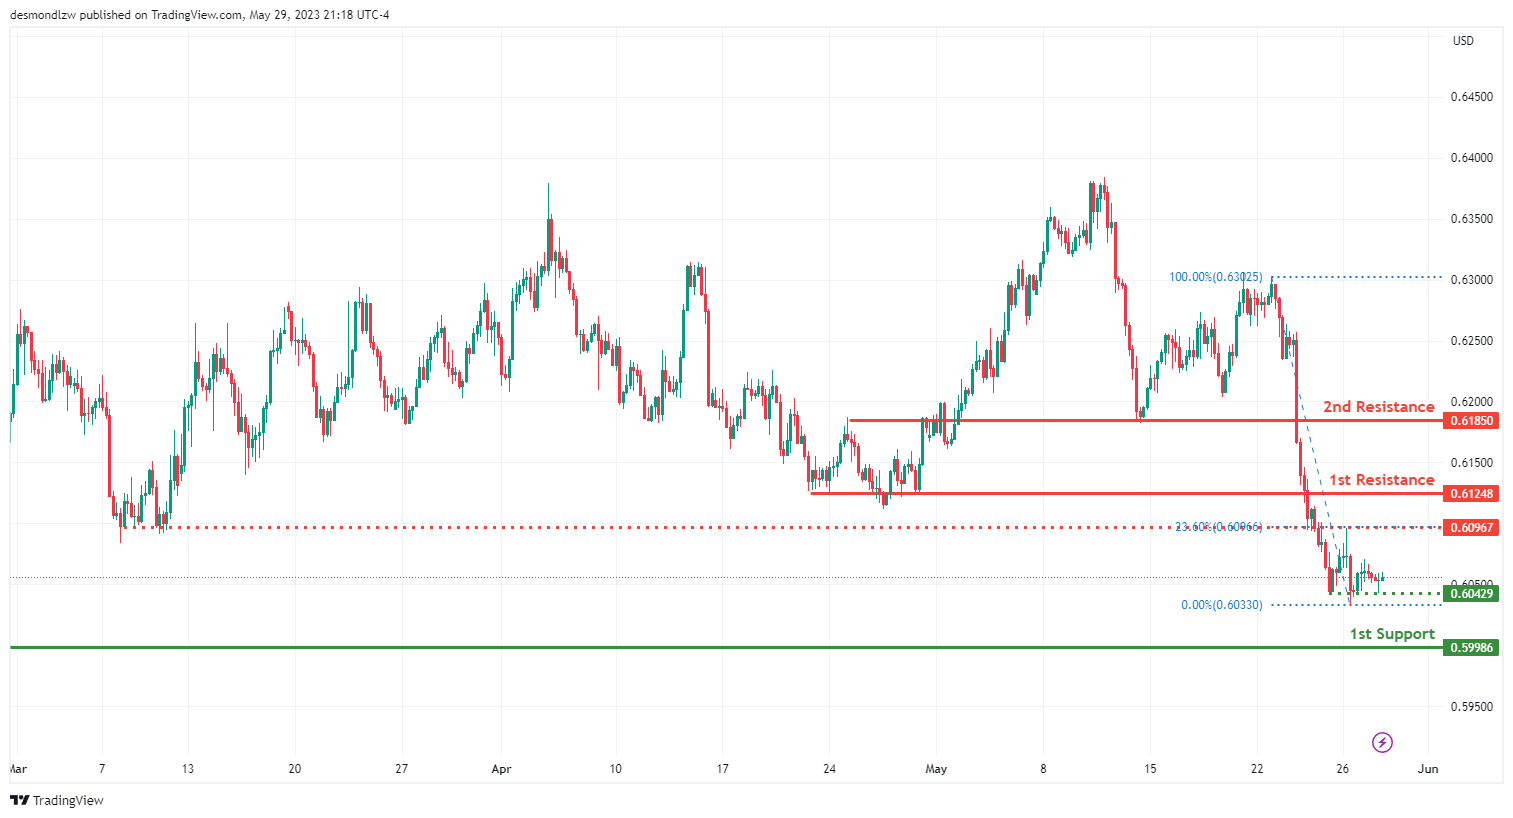
The NZD/USD chart currently exhibits a strong bearish momentum, suggesting a potential continuation of the downward trend. This bearish sentiment indicates a negative outlook for the currency pair.
An intermediate support level can be found at 0.6043, which represents an overlap support while the first support at 0.6000 serves as a significant support area that is identified as an overlap support. This level carries historical importance as a price level where buyers have previously entered the market, making it a key support area to monitor..
On the resistance side, the first resistance level at 0.6125 represents an overlap resistance. This level may act as a temporary barrier to upward price movements, potentially causing a pause or retracement in the bearish trend.
Additionally, there is a second resistance level at 0.6185 that is identified as an overlap resistance. This level has previously shown its significance as a price level where selling pressure has emerged.
DJ30:
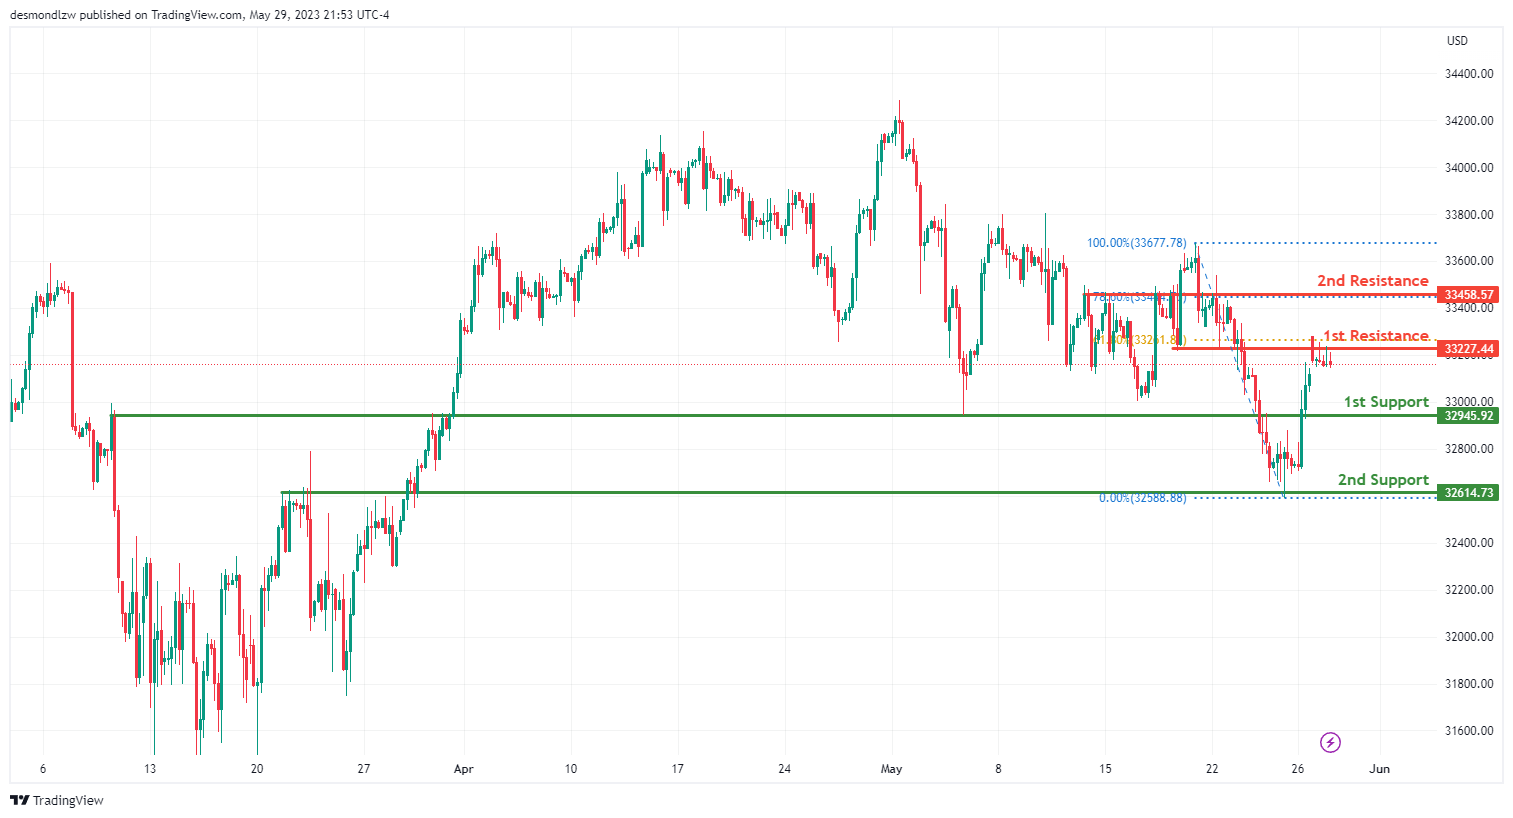
The DJ30 (Dow Jones Industrial Average) chart currently exhibits bullish momentum, indicating a potential continuation of the upward trend. This bullish sentiment suggests a favorable environment for further price appreciation.
There is a possibility of a bullish continuation towards the first resistance level at 33227.44. This level represents an overlap resistance and aligns with the 61.80% Fibonacci retracement. This confluence of technical factors adds strength to the resistance level and suggests it may act as a barrier to further upward price movements. Additionally, there is a second resistance level at 33458.57 is identified as an overlap resistance and aligns with the 78.60% Fibonacci retracement. This level has previously shown its importance as a price level where selling pressure has emerged, making it a crucial area to watch.
On the support side, the first support level at 32945.92 level serves as a significant support area, identified as an overlap support. This level has historical importance as a price level where buyers have previously entered the market, making it a key support area to monitor. Additionally, there is a second support level at 32614.73, the second support level is also an overlap support. Previous instances of price action bouncing off this level add credibility to its significance as a potential support area.
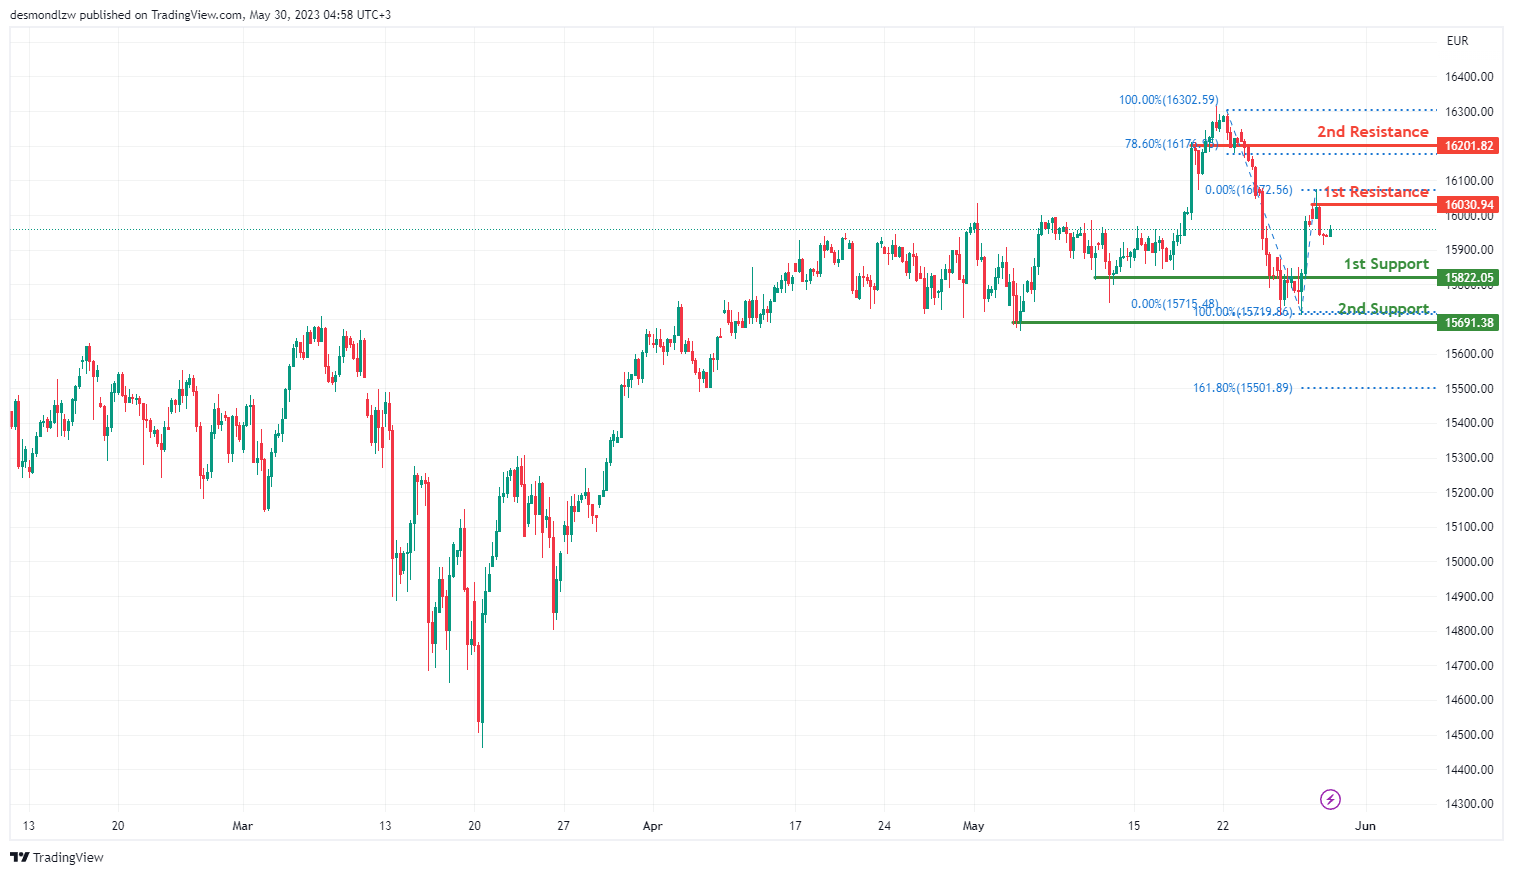
GER30:
The GER30 (DAX) chart currently exhibits a weak bullish momentum, although with low confidence. This suggests a potential continuation of the upward trend, but with uncertainty surrounding the strength of the bullish sentiment.
There is a possibility of a bullish continuation towards the first resistance level at 16030.94 level. This level may act as a temporary barrier to further upward price movements, potentially causing a pause or retracement in the bullish trend. Additionally, a second resistance level at 16201.82 is identified as an overlap resistance. This level has previously shown its significance as a price level where selling pressure has emerged. Additionally, it aligns with the 78.60% Fibonacci retracement, adding further strength to its potential as a resistance area.
On the support side, the first support level at 15822.05 level serves as an important support area, identified as an overlap support. This level carries significance due to its historical relevance as a price level where buyers have previously entered the market. Furthermore, there is a second support level at 15691.38. Previous instances of price action bouncing off this level provide additional credibility to its importance as a potential support area.
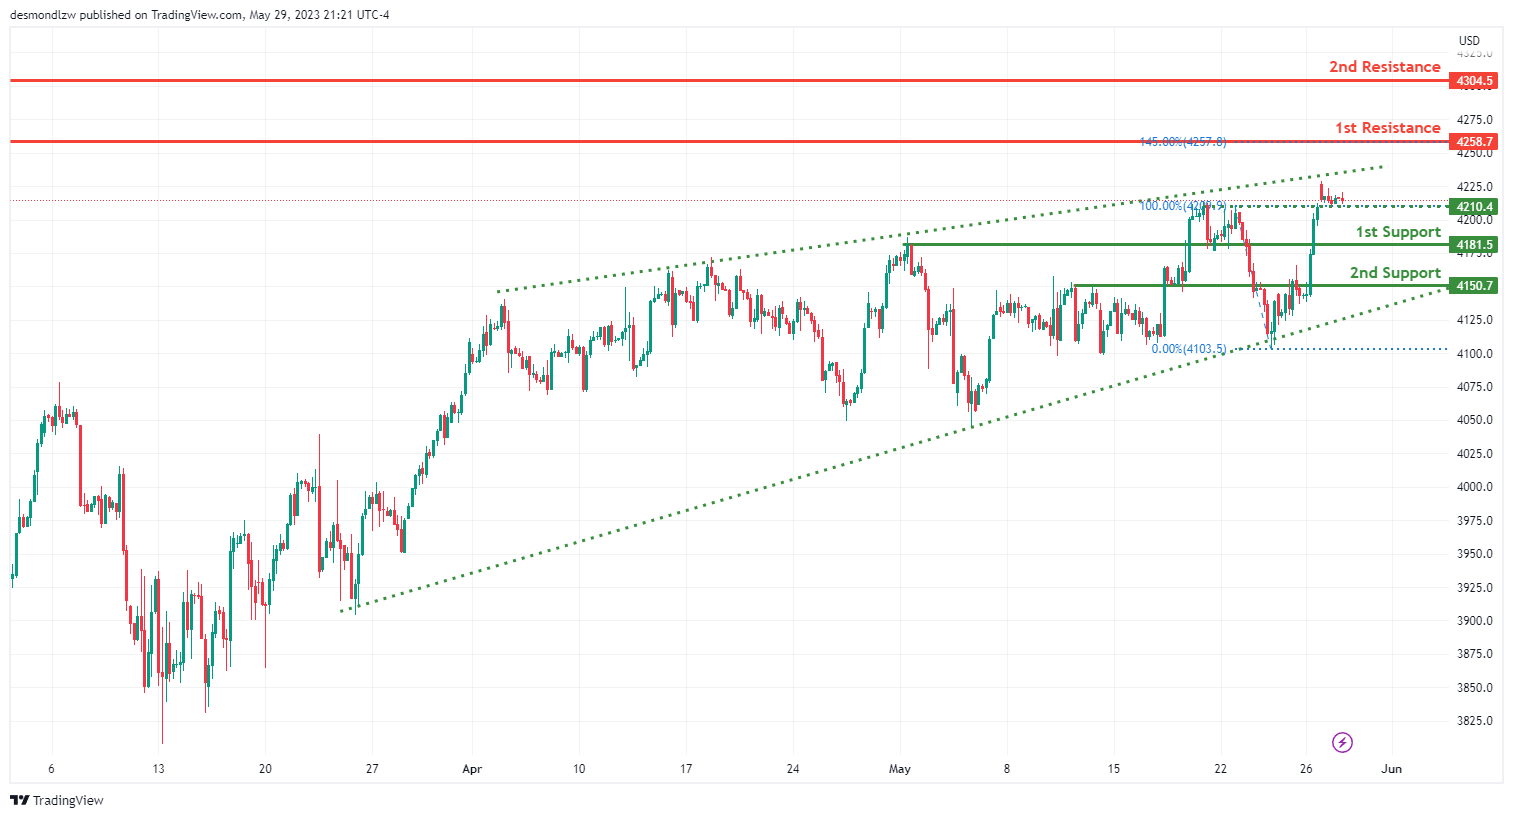
US500
The US500 chart currently exhibits a weak bullish momentum, although with low confidence. This suggests a potential continuation of the upward trend, but with uncertainty surrounding the strength of the bullish sentiment.
There is an intermediate support level at 4210.40 and the first support level at 4181.50 serves as an important support area, identified as an overlap support. This level carries significance due to its historical relevance as a price level where buyers have previously entered the market.
The second support level at 4150.70 is also an overlap support. Previous instances of price action bouncing off this level provide additional credibility to its importance as a potential support area.
There is a possibility of a bullish break through the ascending channel to rise towards the first resistance level at 4258.70. This level may act as a temporary barrier to further upward price movements, potentially causing a pause or retracement in the bullish trend. Additionally, it aligns with the 145.00% Fibonacci expansion, adding strength to its potential as a resistance area.
The second resistance level at 4304.50 is identified as an overlap resistance. This level has previously shown its significance as a price level where selling pressure has emerged.
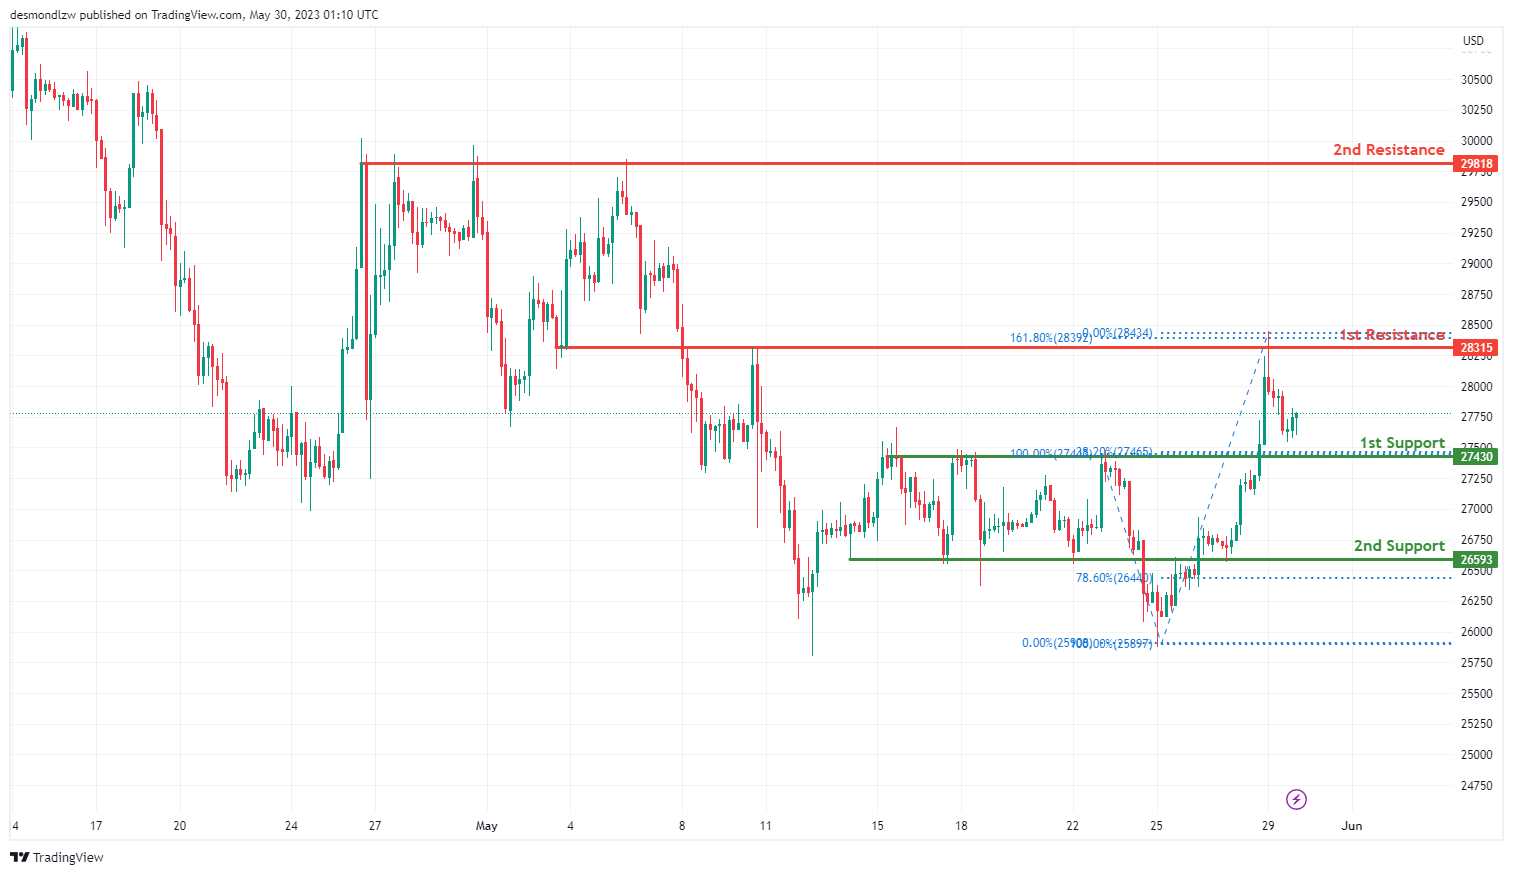
BTC/USD:
The BTC/USD chart currently exhibits a weak bullish momentum, although with low confidence. This suggests a potential continuation of the upward trend, but with uncertainty surrounding the strength of the bullish sentiment.
There is a possibility of a bullish move towards the first resistance level at 28315.00. This level may act as a temporary barrier to further upward price movements, potentially causing a pause or retracement in the bullish trend. Additionally, it aligns with the 161.80% Fibonacci expansion, adding strength to its potential as a resistance area.
The second resistance at 29818.00 is identified as an overlap resistance. This level has previously shown its significance as a price level where selling pressure has emerged.
On the support side, the first support level at 27430.00 serves as an important support area, identified as an overlap support. This level carries significance due to its historical relevance as a price level where buyers have previously entered the market.
Additionally, there is a second support level at 26593.00 which is an overlap support and aligns with the 78.60% Fibonacci retracement. This confluence of technical factors adds strength to its importance as a potential support area.
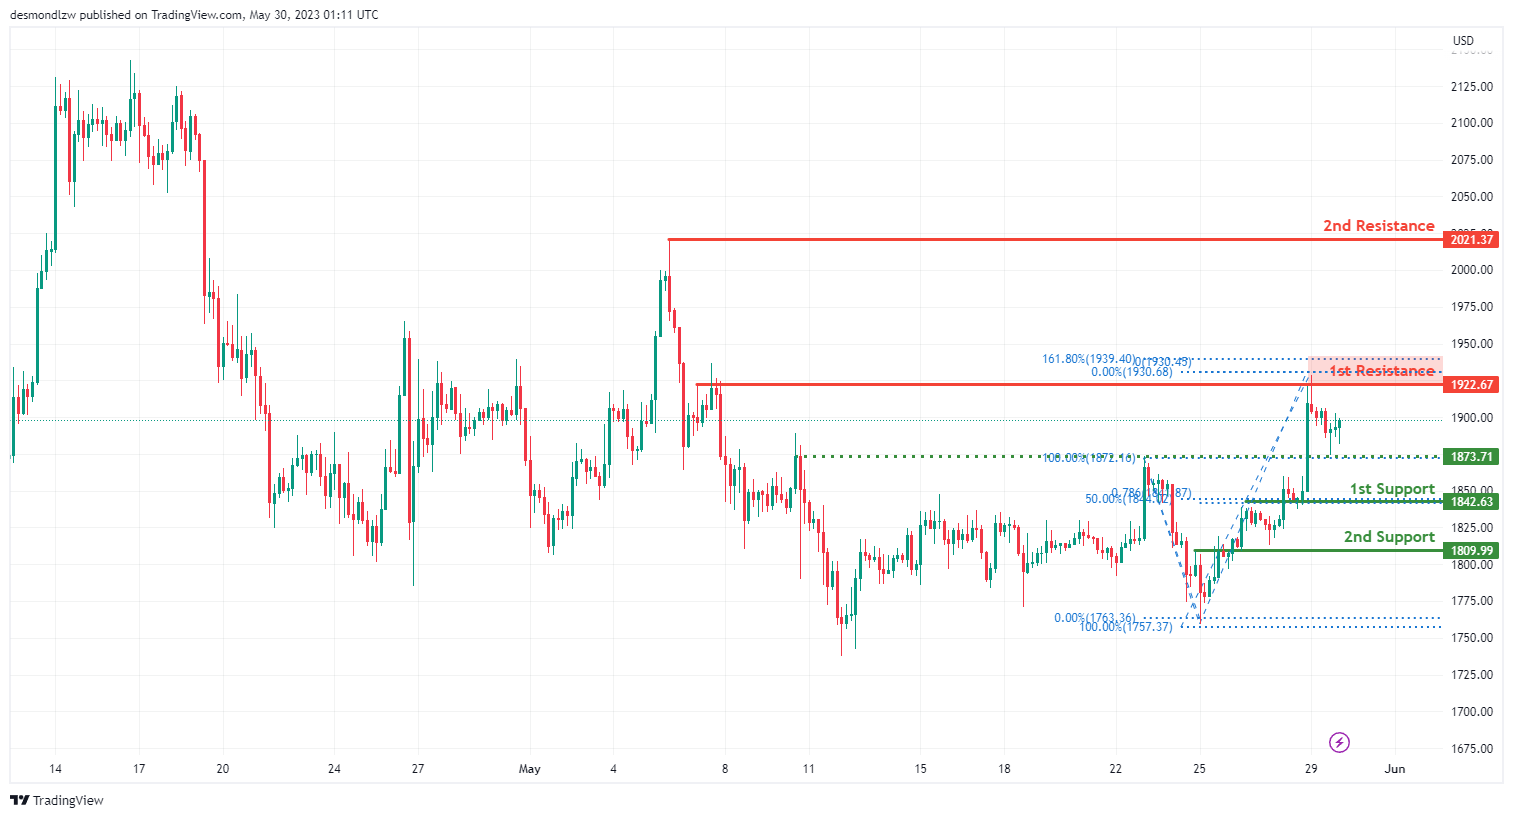
ETH/USD:
The ETH/USD chart currently exhibits a bullish momentum, suggesting a potential continuation of the upward trend. This bullish sentiment indicates a favorable environment for further price appreciation.
The first line of support at 1842.63 level serves as a significant support area, identified as an overlap support. Additionally, it aligns with the 50% Fibonacci retracement, adding further significance to this level as a potential area for price stabilization during pullbacks.
If the price breaks below this level, the second line of support lies at 1809.99 which is also an overlap support. Previous instances of price action bouncing off this level provide additional credibility to its importance as a potential support area.
On the upside, the first resistance is at 1922.67 which represents an overlap resistance. This level may act as a temporary barrier to further upward price movements, potentially causing a pause or retracement in the bullish trend. Additionally, it aligns with the 161.80% Fibonacci expansion, adding further strength to its potential as a resistance area.
The second resistance is at 2021.37, which was a previous swing high. This level has previously shown its significance as a price level where selling pressure has emerged.
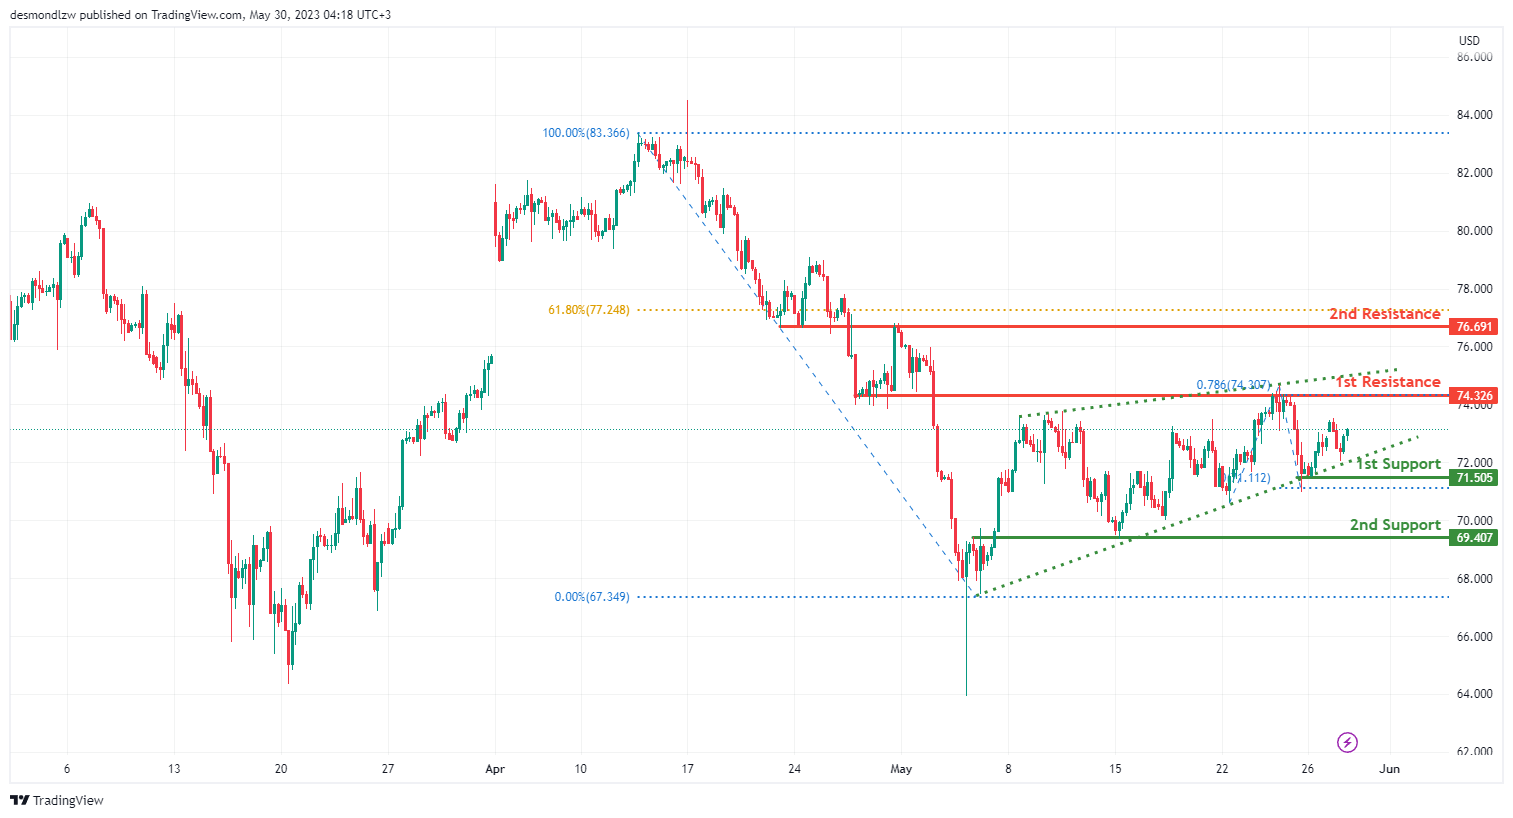
WTI/USD:
The WTI/USD chart currently exhibits a bullish momentum, suggesting a potential continuation of the upward trend. This bullish sentiment indicates a favorable environment for further price appreciation.
The 71.51 level serves as a significant first support area, identified as an overlap support. This level has historical relevance as a price level where buyers have previously entered the market, making it a key support area to monitor.
If the price falls below this point, the second line of support is at 69.41 which is also an overlap support. Previous instances of price action bouncing off this level provide additional credibility to its importance as a potential support area.
Looking upward, the first resistance level is at 74.33 which represents an overlap resistance. This level may act as a temporary barrier to further upward price movements, potentially causing a pause or retracement in the bullish trend.
The second resistance is at 76.69 which is identified as an overlap resistance. This level has previously shown its significance as a price level where selling pressure has emerged. Additionally, it aligns with the 61.80% Fibonacci retracement, adding further strength to its potential as a resistance area.
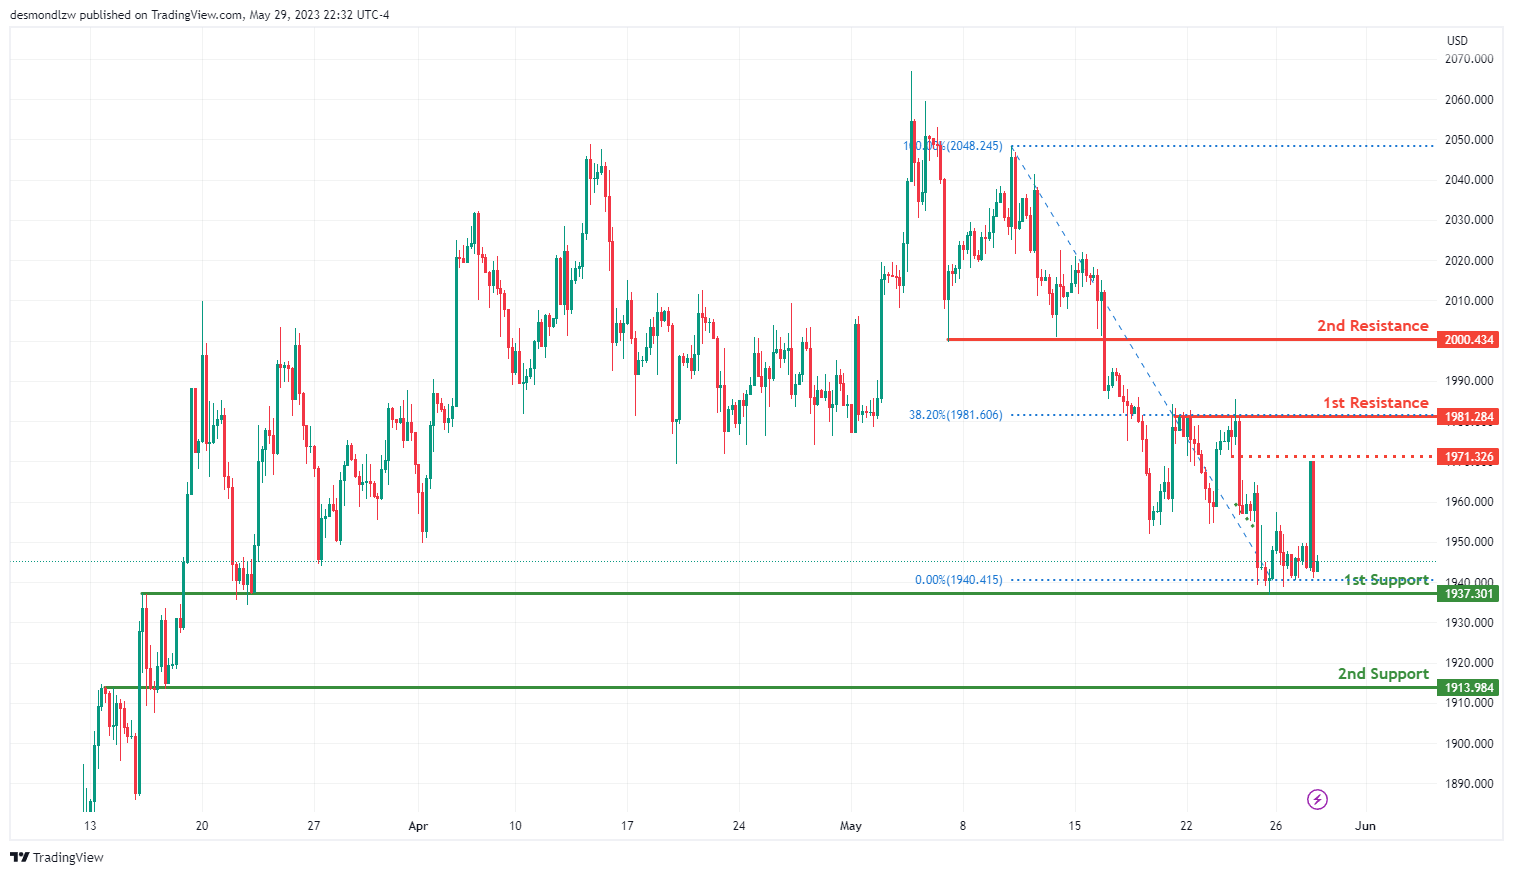
XAU/USD (GOLD):
The XAU/USD chart currently exhibits a weak bullish momentum, suggesting a potential bounce from the first support. This indicates a cautious environment where further price appreciation may be limited.
The first level of support is at 1937.30 which serves as a significant support area, identified as an overlap support. This level carries historical importance as a price level where buyers have previously entered the market, making it a key support area to monitor.
If the price breaks below this level, the second line of support is at 1913.98 which is also an overlap support. Previous instances of price action bouncing off this level provide additional credibility to its importance as a potential support area.
On the upside, the first resistance level is at 1981.28 which represents an overlap resistance. This level may act as a temporary barrier to further upward price movements, potentially causing a pause or retracement in the bullish trend. Additionally, it aligns with the 38.20% Fibonacci retracement, adding further strength to its potential as a resistance area.
The second resistance is located at 2000.43 is identified as an overlap resistance. This level has previously shown its significance as a price level where selling pressure has emerged.
The accuracy, completeness and timeliness of the information contained on this site cannot be guaranteed. IC Markets does not warranty, guarantee or make any representations, or assume any liability regarding financial results based on the use of the information in the site.
News, views, opinions, recommendations and other information obtained from sources outside of www.icmarkets.com, used in this site are believed to be reliable, but we cannot guarantee their accuracy or completeness. All such information is subject to change at any time without notice. IC Markets assumes no responsibility for the content of any linked site.
The fact that such links may exist does not indicate approval or endorsement of any material contained on any linked site. IC Markets is not liable for any harm caused by the transmission, through accessing the services or information on this site, of a computer virus, or other computer code or programming device that might be used to access, delete, damage, disable, disrupt or otherwise impede in any manner, the operation of the site or of any user’s software, hardware, data or property.


