
Key risk events today:
BoJ Outlook Report, Monetary Policy Statement and Press Conference; German Prelim CPI m/m; US Core PCE Price Index m/m and Personal Spending m/m; US CB Consumer Confidence.
EUR/USD:
Europe’s single currency entered a somewhat subdued state Monday, unable to close outside of Friday’s range. Consequent to yesterday’s lacklustre performance, much of the following will echo thoughts aired in Monday’s weekly report.
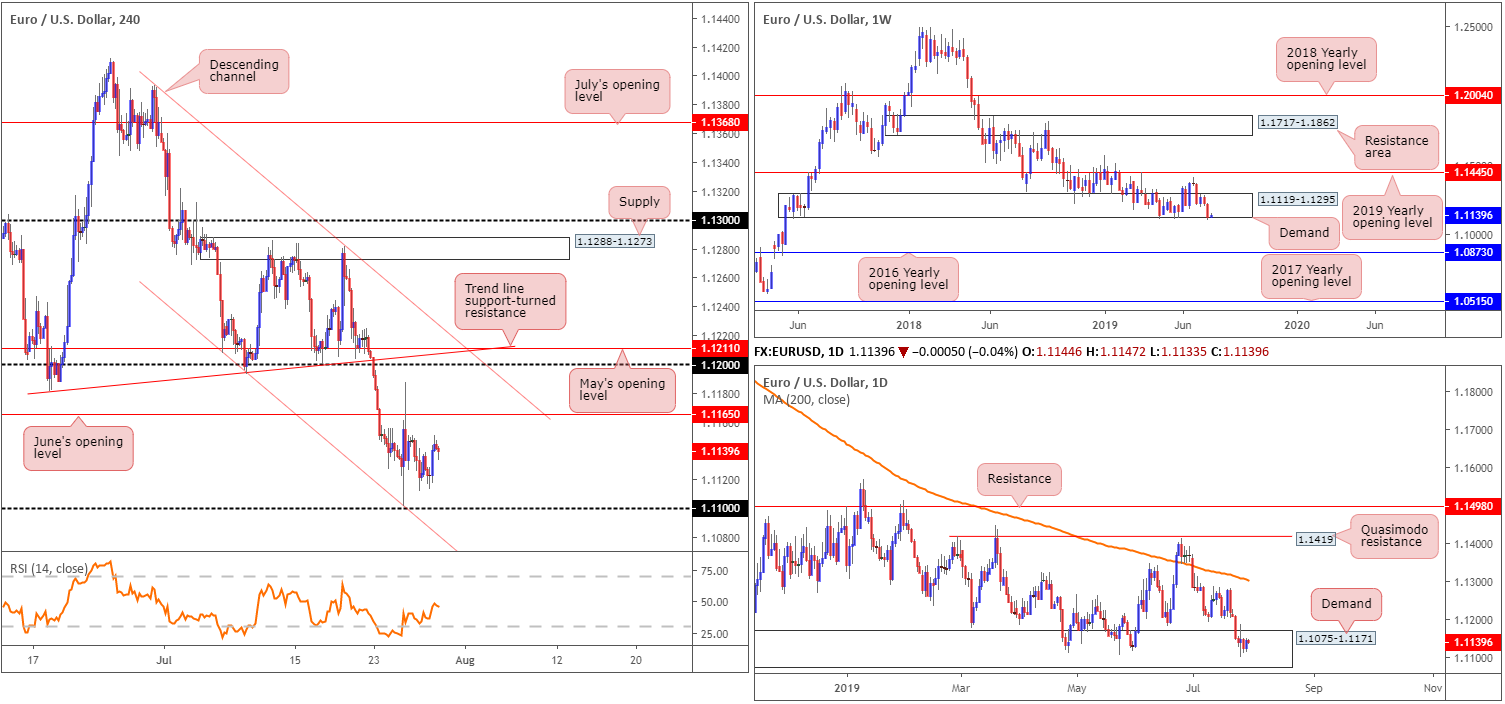
From the weekly timeframe, we can see the unit clocked fresh 2019 lows of 1.1101 last week, and marginally surpassed the lower edge of long-standing demand at 1.1119-1.1295 by way of a near-full-bodied bearish candle. Despite this, it’d be unwise to rule out the possibility of fresh upside attempts, as the break of demand was unlikely enough to trigger major sell stops. In the event further selling is observed, though, the 2016 yearly opening level at 1.0873 (support) is next in the firing range.
A closer reading of price action on the daily timeframe reveals the unit is treading water within the walls of demand at 1.1075-1.1171, an area seen hugging the underside of the current weekly demand zone. Further downside this week may entail engulfing the current daily demand zone and making a run for demand at 1.0860-1.0954 (not seen on the screen).
From the H4 timeframe, we have the 1.11 handle in view as possible support and June’s opening level coming in at 1.1165 as resistance. A break below 1.11 has nearby support in the shape of a channel formation taken from the low 1.1207. Beyond 1.1165, nonetheless, the 1.12 handle appears the next logical target, closely shadowed by two trend line resistances (1.1393/1.1181) and May’s opening level at 1.1211.
Areas of consideration:
Traders may witness a fakeout through 1.11 (tripping stop-loss orders) to H4 channel support (1.1207). Assuming this plays out and we close back above 1.11, short-term buying opportunities could be on offer (entry and risk levels can be determined on the breakout candle above 1.11).
Another possibility is a break of the 1.11 handle and the H4 channel support, given weekly buyers are likely fearful around the lower edge of demand at 1.1119-1.1295 and daily price demonstrating little in terms of upside presence within demand at 1.1075-1.1171. For that reason, shorting opportunities beyond the said H4 structures are also an option, preferably as a retest play, targeting 1.10 as the initial target.
GBP/USD:
Sterling, a standout underperformer vs. its US counterpart, struck fresh 2-year lows Monday as no-deal Brexit fears intensified. Technical selling also likely increased downside pressure by running stop-loss orders.
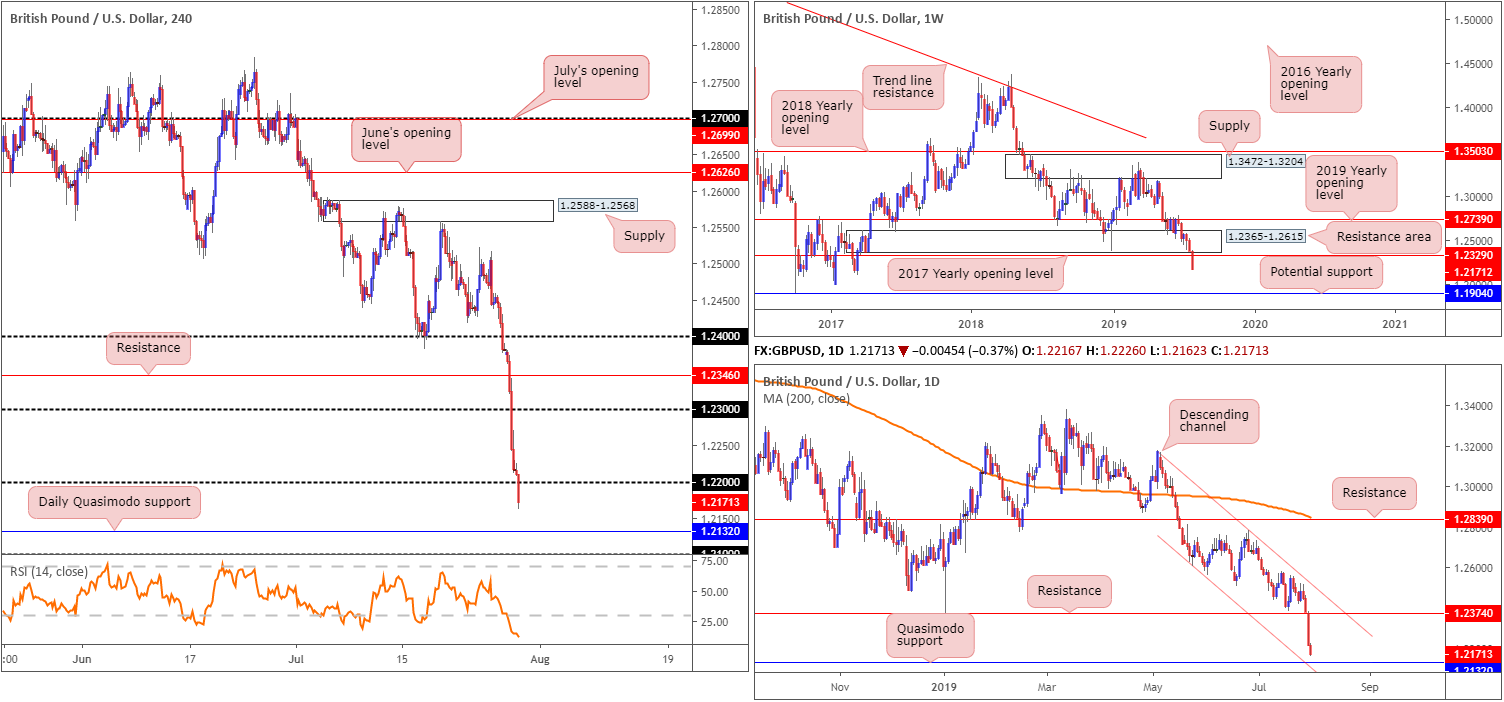
Kicking things off from the weekly timeframe, we have the current candle establishing firm ground beneath its 2017 yearly opening level at 1.2329. Limited support is visible on this timeframe, according to our technical studies, leaving space to potentially approach 1.1904, a standout low clocked in early October of 2016.
A closer reading of price action on the daily timeframe, traders’ crosshairs are likely fixed on Quasimodo support coming in at 1.2132 this week, thanks to recent selling. Notably, this layer of support blends together with channel support etched from the low 1.2624. Therefore, this may be an area we see buyers attempt to make an appearance.
Furthering the analysis to the H4 timeframe, we can see in recent hours the pair crossed beneath 1.22 and appears poised to tackle the daily Quasimodo support highlighted above at 1.2132, closely followed by 1.21.
Areas of consideration:
Although concerns surrounding Brexit are clearly weighing on the pair right now, the space between the 1.21 handle and the daily Quasimodo support at 1.2132/channel support extended from the low 1.2624 is interesting for a possible bounce higher today. To be on the safe side, traders are urged to wait and see if the H4 candles chalk up a bullish candlestick signal out of 1.21/1.2132 prior to pulling the trigger (entry and risk levels can be determined according to the candlestick’s structure), targeting 1.22 as the initial take-profit zone.
The accuracy, completeness and timeliness of the information contained on this site cannot be guaranteed. IC Markets does not warranty, guarantee or make any representations, or assume any liability regarding financial results based on the use of the information in the site.
News, views, opinions, recommendations and other information obtained from sources outside of www.icmarkets.com.au, used in this site are believed to be reliable, but we cannot guarantee their accuracy or completeness. All such information is subject to change at any time without notice. IC Markets assumes no responsibility for the content of any linked site.
The fact that such links may exist does not indicate approval or endorsement of any material contained on any linked site. IC Markets is not liable for any harm caused by the transmission, through accessing the services or information on this site, of a computer virus, or other computer code or programming device that might be used to access, delete, damage, disable, disrupt or otherwise impede in any manner, the operation of the site or of any user’s software, hardware, data or property.


