
EUR/USD:
Data published by the European Commission came in mostly weaker than forecast Monday, with economic sentiment at its lowest level since 2016. In addition to this, the US dollar index, calculated by factoring in the exchange rates of six major world currencies, was unable to hold above the 98.00 mark as core PCE numbers came in below expectations. This was likely the main driver behind the EUR/USD’s recent upsurge.
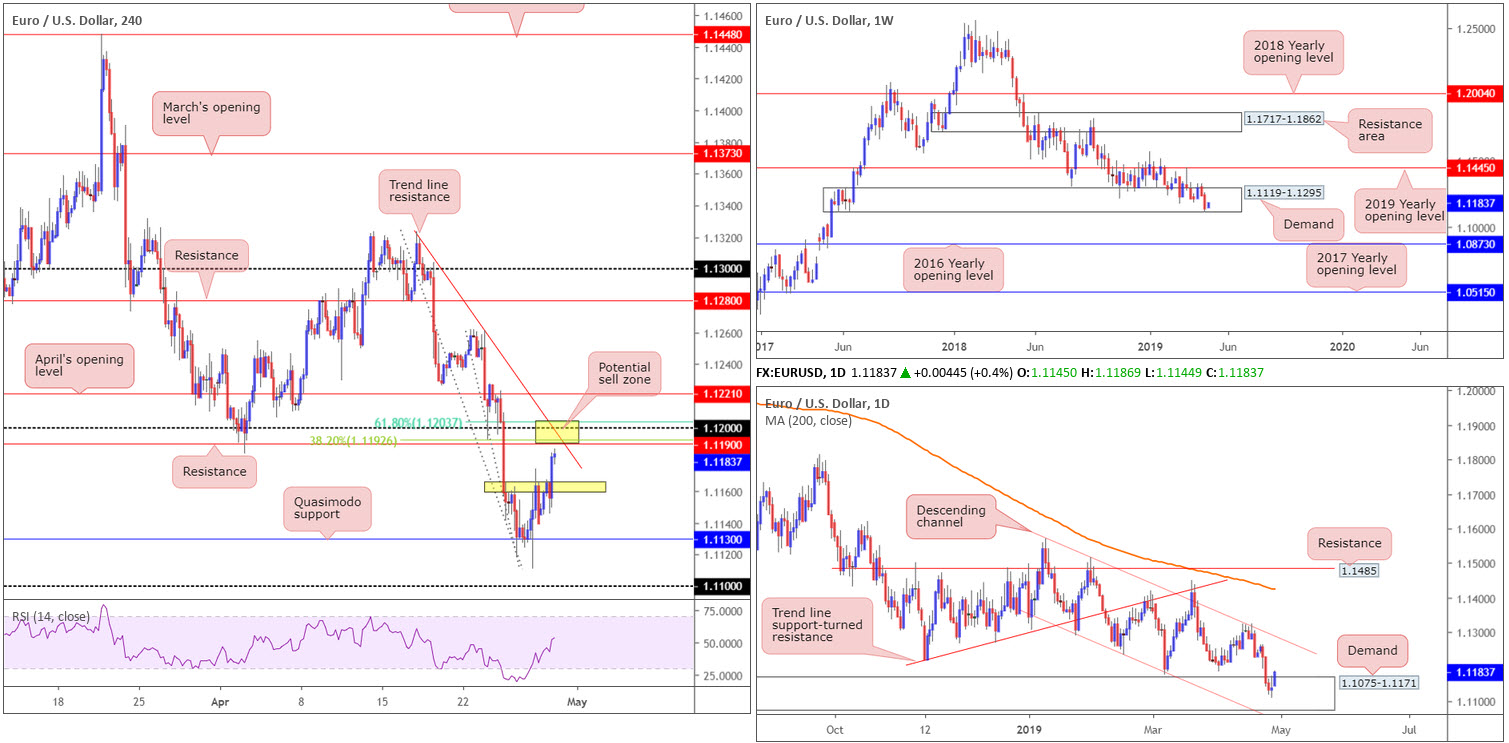
From a technical standpoint, weekly buyers appear to be ‘hanging on by a thread’ within the lower limits of a long-standing demand area at 1.1119-1.1295. Recent flow clipped the lower edge of the zone, though was unlikely enough to trip stop-loss orders on this timeframe. A decisive break of the area to the downside, however, has the 2016 yearly opening level at 1.0873 to target.
Daily activity, on the other hand, shows signs of strength out of demand priced in at 1.1075-1.1171 (glued to the underside of the current weekly demand area). The next point of resistance from current price falls in around channel resistance etched from the high 1.1569.
Recent buying on the H4 timeframe positions the candles within striking distance of resistance drawn from 1.1190 (a Quasimodo support-turned resistance), followed closely by the 1.12 handle, a 38.2% Fibonacci resistance at 1.1192, a trend line resistance taken from the high 1.1323 and a 61.8% Fibonacci resistance value at 1.1203.
Areas of consideration:
The cluster of confluence surrounding the 1.12 handle, the area marked in yellow at 1.1203/1.1190, on the H4 timeframe is impressive. What’s also notable is the immediate trend faces a southerly direction. The only grumble, nonetheless, is the fact we’re pushing out of demand on the higher timeframes.
Should traders still find interest in 1.1203/1.1190, despite the higher-timeframe picture, waiting for additional candlestick confirmation to form may be an option (entry and risk parameters can be determined according to this structure) before pulling the trigger. In regards to a first take-profit target, the lower yellow zone around 1.1160ish is the next local support on the H4 timeframe.
Today’s data points: French Flash GDP q/q; German GfK Consumer Climate; German Import Prices m/m; French Consumer Spending m/m; French Gov Budget Balance; French Prelim CPI m/m; Spanish Flash GDP q/q; Spanish Flash CPI y/y; German Prelim CPI m/m; EUR Prelim Flash GDP q/q; US Employment Cost Index q/q; Chicago PMI; US CB Consumer Confidence.
GBP/USD:
Outlook unchanged due to lacklustre movement.
Having recaptured 1.29+ status late last week, sterling traded relatively flat vs. its US counterpart Monday. Unresponsive to reports UK Prime Minister Theresa May could be ousted in June, the day’s range came in between 1.2947/1.2904, up 0.17% on the day.
In light of a somewhat lacklustre start to the week, much of the following analysis will echo thoughts put forward In Monday’s briefing.
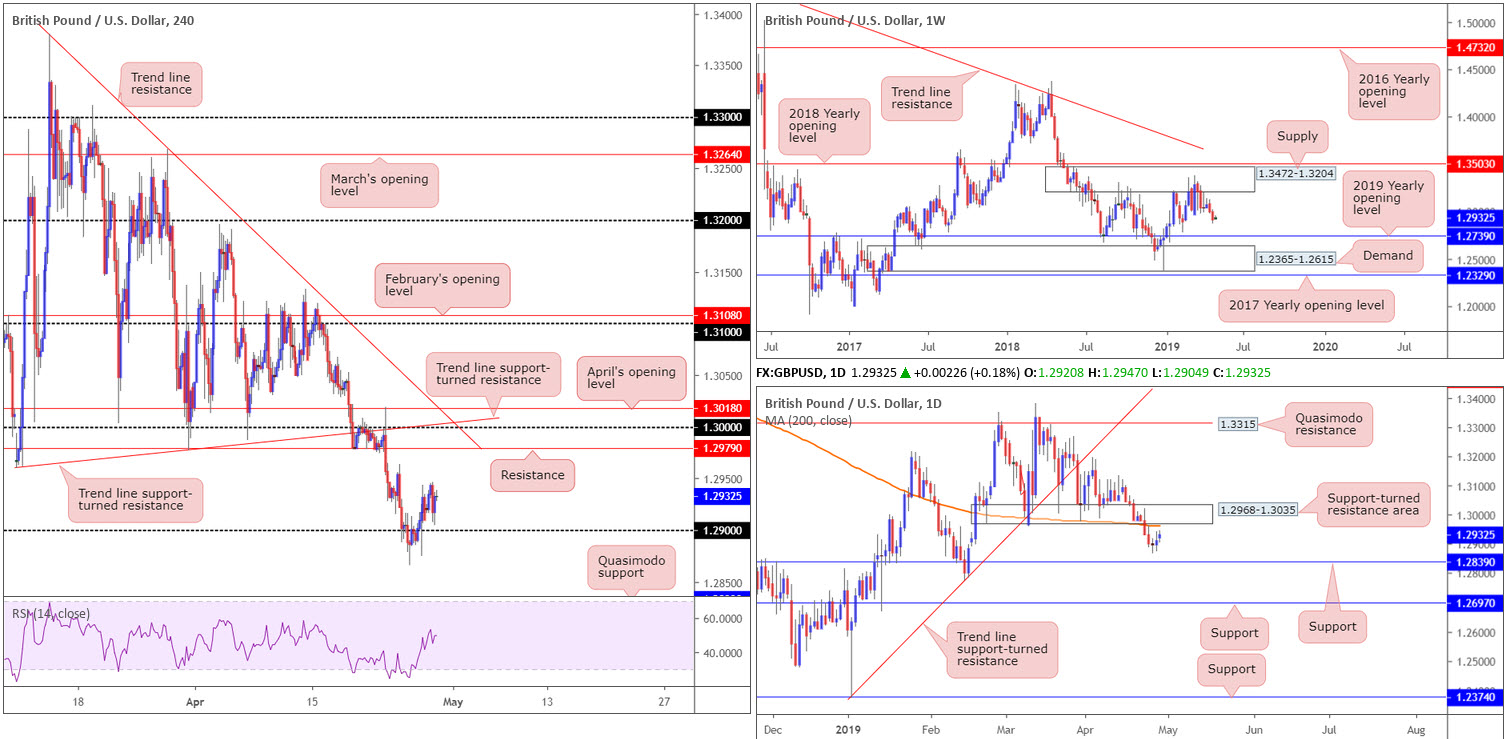
Since the end of February, the underside of weekly supply at 1.3472-1.3204, situated a few points south of the 2018 yearly opening level at 1.3503, has been home to many traders. With the next obvious downside target not realised on this timeframe until the 2019 yearly opening level at 1.2739, and the market pushing 80 points south last week, sellers still have plenty of room to manoeuvre if they shoot lower.
In conjunction with weekly flow, last week’s action saw daily price cross beneath its 200-day SMA (orange) and also overthrow a block of support coming in at 1.2968-1.3035 (now acting resistance). As a result of this, support at 1.2839 is now in the firing range. Before we reach here, though, traders might want to pencil in the possibility of a retest forming at 1.2968-1.3035 to draw in additional sellers.
With 1.29 on the H4 timeframe poised to offer support, short-term buying may materialise today/early week towards resistance plotted at 1.2979, shadowed closely by key figure 1.30 and two merging trend line resistances (1.3380/1.2975). In the event 1.29 fails to hold ground, nonetheless, the next port of call falls in around Quasimodo support at 1.2839 (not seen on the H4 chart – also lines up with daily support highlighted above).
Areas of consideration:
Traders considering longs from 1.29 are urged to tread carefully. Not only is the overall market direction facing a southerly bearing at the moment, both weekly and daily structure exhibit space to explore lower ground.
Assuming our higher-timeframe reading is accurate and the H4 candles engulf 1.29 to the downside, the spotlight will be focused on shorts towards Quasimodo support at 1.2839. A retest of 1.29 as resistance by way of a H1 or H4 bearish candlestick signal would be optimal, identifying seller intent and also providing entry/risk parameters to work with.
Today’s data points: MPC Member Ramsden Speaks; US Employment Cost Index q/q; Chicago PMI; US CB Consumer Confidence.
AUD/USD:
Outlook unchanged due to lacklustre movement.
Following a brief spell beneath key figure 0.70 on the H4 timeframe late last week, the AUD/USD pair kicked off a recovery phase and registered its third consecutive daily gain Monday, up 0.28%. Further bolstering the commodity-linked currency was the US dollar index exploring ground beneath 98.00 amid disappointing core PCE numbers and positive news flow regarding US/China trade talks.
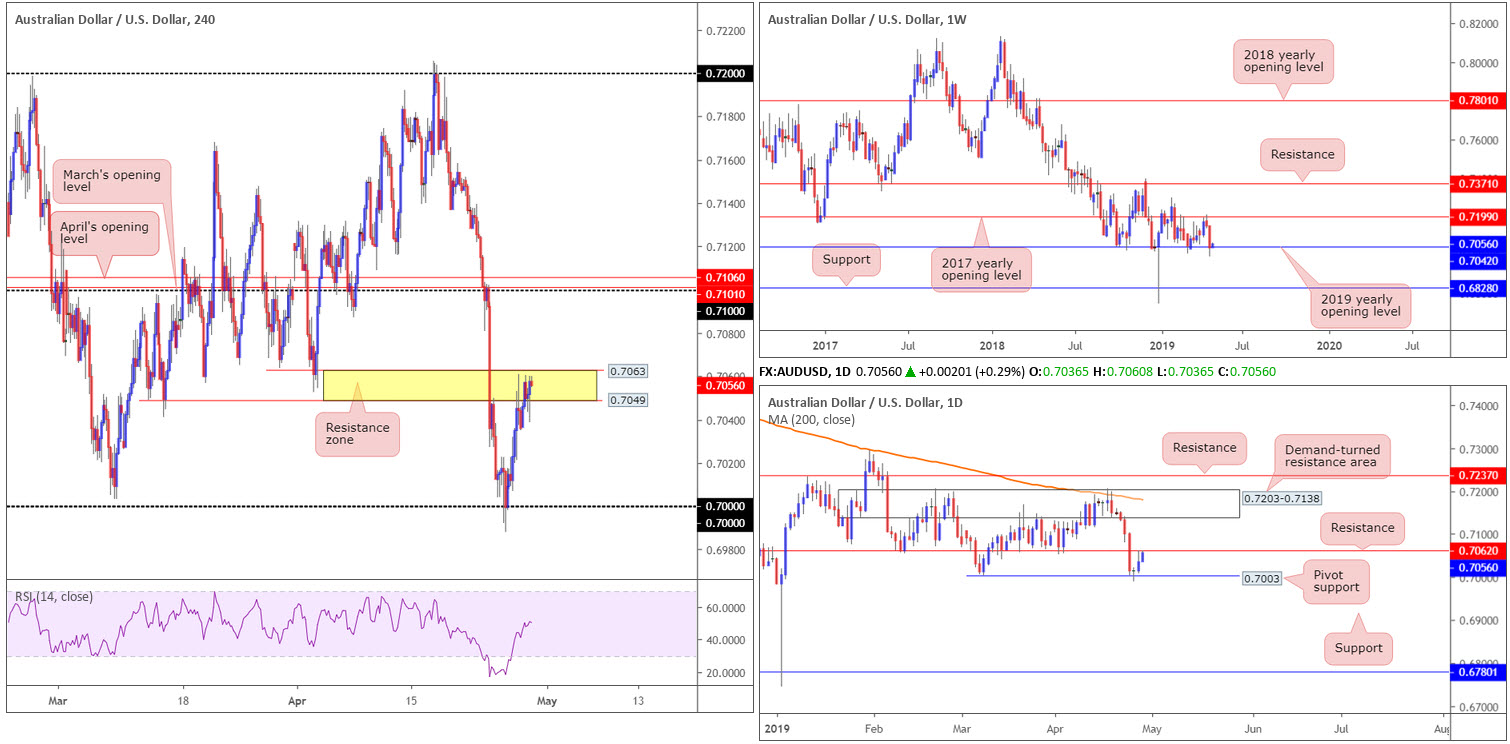
Technically, the H4 candles remain warring for position within a resistance zone pencilled in between 0.7063/0.7049 (yellow). This area is particularly significant, comprised of two Quasimodo support-turned resistances, levels which, statistically, have a high probability of holding – even more so when merging with daily resistance seen at 0.7062.
On the other side of the spectrum, weekly action is shaking hands with potential support by way of the 2019 yearly opening level at 0.7042. Further buying from here on the weekly timeframe has the 2017 yearly opening level to target at 0.7199.
Areas of consideration:
In spite of both H4 and daily structure underscoring strong resistance, weekly has support in sight. As a result of this, sellers might want to exercise some caution. Rather than entering a market sell order and placing a stop above the yellow H4 zone hoping it’ll move in favour, traders are urged to wait and see if the H4 candles breakout to the downside. A reasonably solid H4 bearish candle drawn from here will, given we’re coming from daily resistance as well, likely be enough energy to deliver a move towards the 0.70 neighbourhood.
Today’s data points: China Manufacturing PMI; China Non-Manufacturing PM; US Employment Cost Index q/q; Chicago PMI; US CB Consumer Confidence.
USD/JPY:
Outlook unchanged due to lacklustre movement.
The Japanese yen weakened slightly Monday amid mounting risk appetite, though the currency traded with thin liquidity owing to Japanese banks closing in observance of Showa Day. The USD/JPY pair ranged no more than 40 points, and chalked up marginal gains of 0.10%.
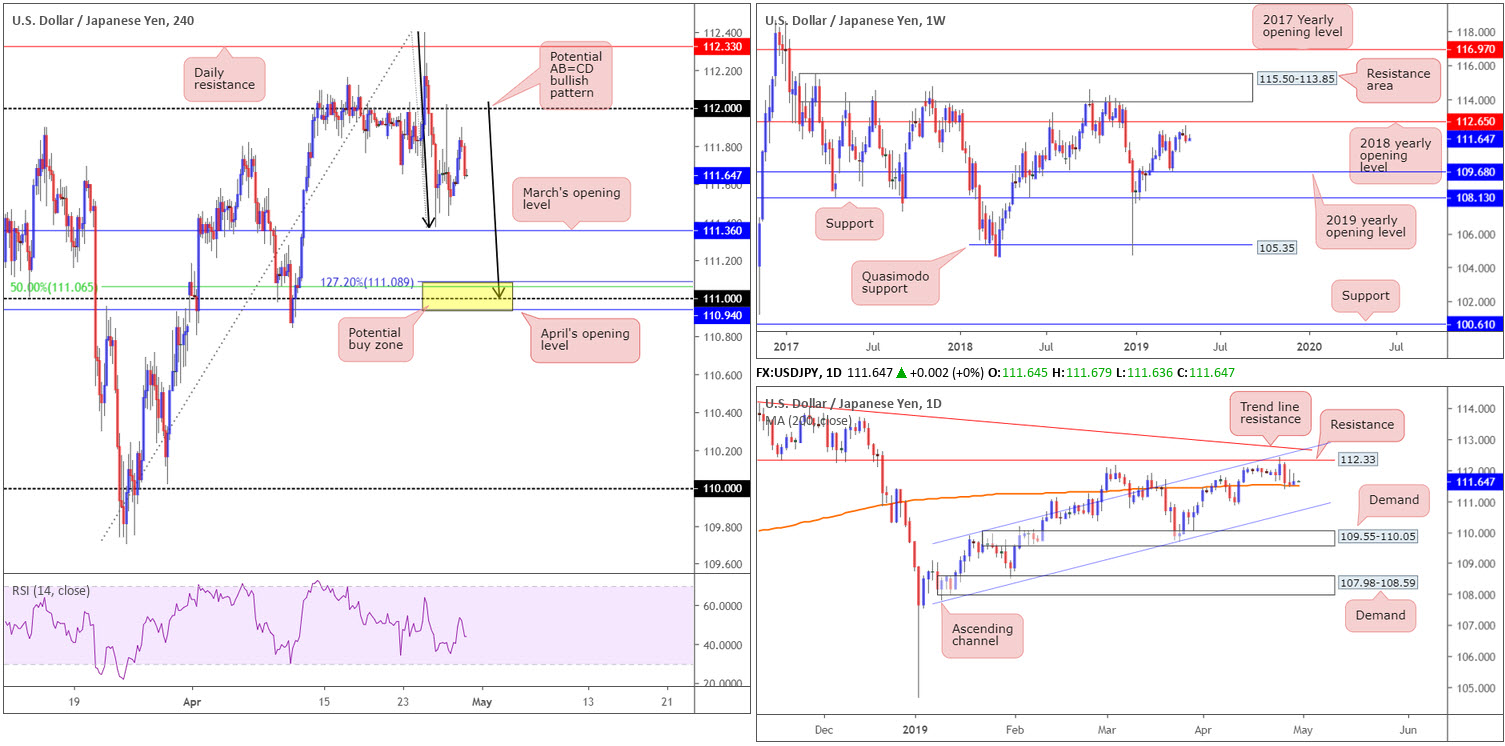
Pretty much echoing the same idea as in Monday’s briefing, the research team notes weekly price left the 2018 yearly opening level at 112.65 unopposed last week and turned lower, wrapping up the session forming a bearish pin-bar pattern. Further selling from this point is a possibility and has the 2019 yearly opening level at 109.68 to target. Traders may also want to note the long-standing resistance area positioned at 115.50-113.85, in the event we push for higher ground this week.
Mid-week trading observed a test of daily resistance at 112.33 form. This, by reason of the level fusing closely with a channel resistance drawn from the high 109.88 and a nearby trend line resistance etched from the high 114.54, was a noted level to watch for shorts in previous analysis. As is evident from the chart, buyers and sellers remain clashing for position around the 200-day SMA (orange). Failure to offer support could lead to a move in the direction of channel support drawn from the low 107.77.
A look at Monday’s dealings on the H4 timeframe shows the unit remains consolidating between the 112 handle and March’s opening level at 111.36. Beyond here, the research team has eyes on the (yellow) 110.94/111.08 region (comprised of April’s opening level at 110.94, the round number 111, a 50.0% support value at 111.06 and a 127.2% AB=CD [black arrows] Fibonacci ext. point at 111.08).
Areas of consideration:
March’s opening level at 111.36 on the H4 timeframe remains a barrier worth keeping an eye on today, largely due to its connection with the 200-day SMA. A H4 or H1 bullish candlestick signal printed from 111.36 (entry and risk parameters can be determined according to this structure) is likely sufficient to draw in buyers and potentially retest the 112 region.
A push below 111.36, as mentioned above, has 110.94/111.08 on the hit list. Owing to its local H4 confluence this is also another area buyers may potentially reside this week. As round numbers are prone to fakeouts, traders may also wish to consider waiting for additional candlestick confirmation to form here before pulling the trigger.
Today’s data points: US Employment Cost Index q/q; Chicago PMI; US CB Consumer Confidence.
USD/CAD:
Outlook unchanged due to lacklustre movement.
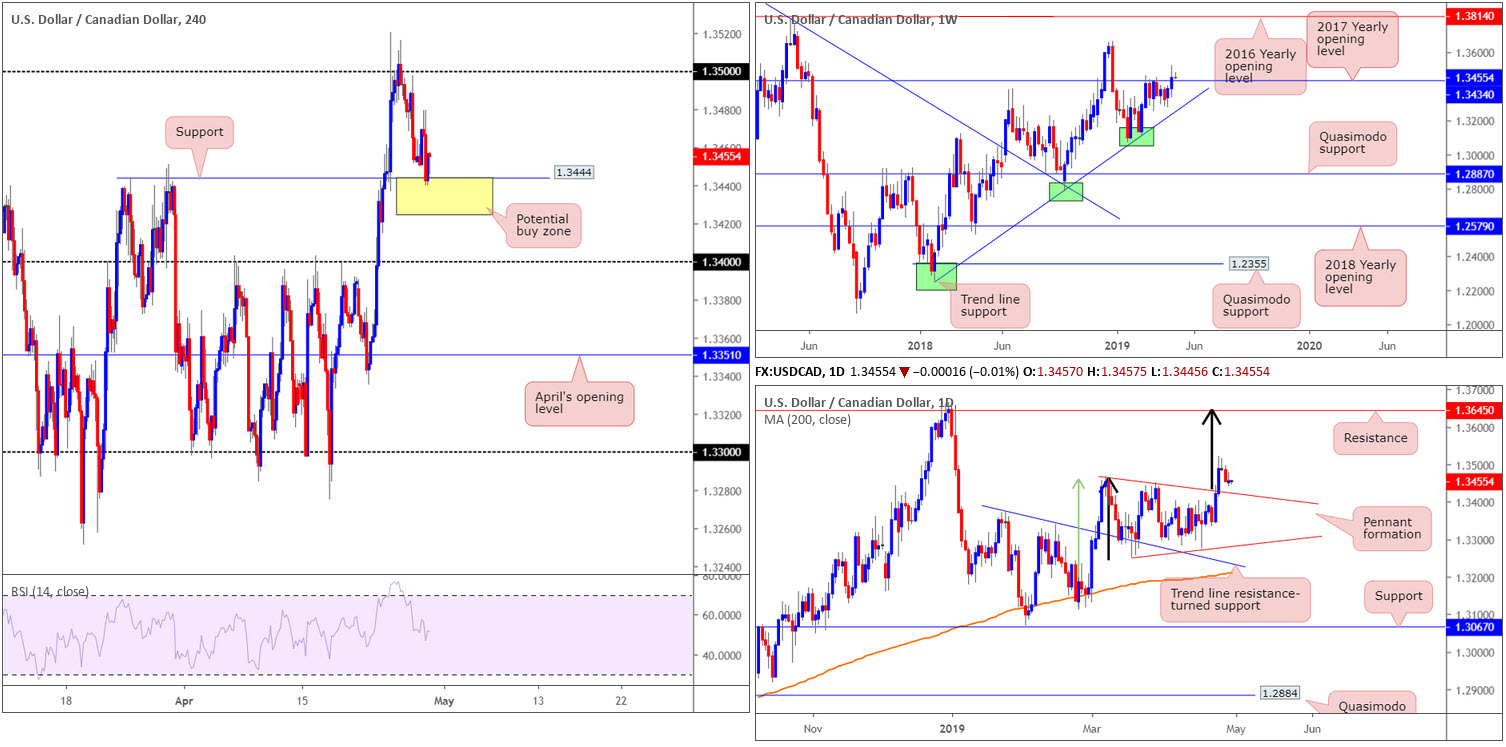
USD/CAD prices are all but unchanged this morning. Longer-term flow remains balanced a few points north of its 2017 yearly opening level at 1.3434, a barrier which held the unit lower by way of a tight consolidation since early March. Assuming buyers remain in the driving seat, this could eventually lead to a move materialising in the direction of the 2018 yearly high of 1.3664.
In addition to weekly position, daily action recently broke out of a symmetrical pennant formation. Traders are likely looking for this pattern to hit a take-profit target around resistance at 1.3645 (the T.P was calculated by adding the base distance to the breakout level [black arrows]). Another price target traders are likely eyeing is calculated by taking the distance from the beginning of the sharp move preceding the pennant to the first reversal within the formation and adding the value to the breakout price (green arrow).
As we head into a fresh week, though, it appears a retest of the top edge of the pennant could be in store.
USD/CAD movement on the H4 timeframe is seen testing support at 1.3444, a Quasimodo resistance-turned support. The important thing to consider here is the nearby 2017 yearly opening level seen on the weekly timeframe at 1.3434 and the top edge of the daily pennant coming in around the 1.3425 region (yellow).
Areas of consideration:
The yellow zone marked on the H4 timeframe between 1.3425/1.3444 is likely of interest for longs today/early week; the area echoes a strong cluster of confluence.
The only drawback to a buy from 1.3425/1.3444 is the possibility of price drawing lower to bring in buyers from the nearby psychological band 1.34. For that reason, traders are urged to consider waiting for additional candlestick confirmation to form within the zone before pressing the buy button (entry and risk can be defined according to this structure).
Today’s data points: US Employment Cost Index q/q; Chicago PMI; US CB Consumer Confidence; Canadian GDP m/m 0.3%; Canadian RMPI m/m; BoC Gov. Poloz Speaks.
USD/CHF:
Outlook unchanged due to lacklustre movement.
USD/CHF movement wrapped up Monday’s segment unchanged, sporting a 30-point range for the day. As a consequence of yesterday’s lacklustre approach, the following report will mimic a large portion of Monday’s outlook.
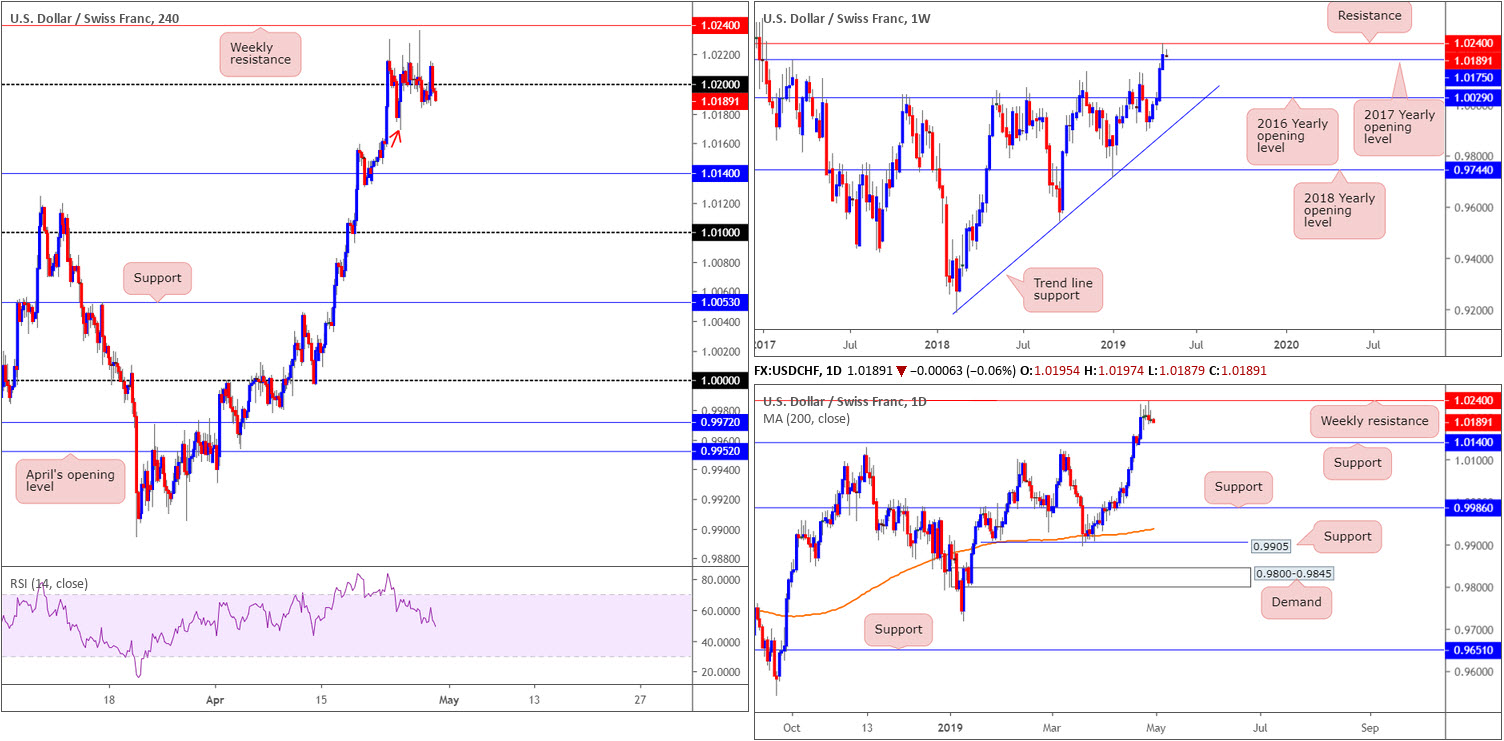
The 2017 yearly opening level at 1.0175 on the weekly timeframe failed to offer the market resistance last week, consequently lifting the USD/CHF to its fifth consecutive weekly gain and fresh 2019 highs, as well as opening the gates for a test of nearby resistance at 1.0240. This level boasts reasonably strong historical significance and could therefore entice sellers into the market this week.
Much the same as the weekly viewpoint, weekly resistance 1.0240 is in view on the daily timeframe, though instead of the 2017 yearly opening level at 1.0175 set as the next downside target, daily support comes in a little lower at 1.0140.
Since last Tuesday, trading volume has been thin as the unit continues to flip between gains/losses around the 1.02 handle on the H4 timeframe. Overhead, traders are urged to pencil in weekly resistance coming in at 1.0240 (also shown on the H4 chart), which could, technically, be the reason behind cautious buying above 1.02.
Monday concluded the session reclaiming 1.02 to the downside and is now set to potentially retest the the 2017 yearly opening level at 1.0175 on the weekly timeframe. Note this level was already retested as support on the H4 chart last Wednesday (red arrow).
Areas of consideration:
From a technical standpoint, the USD/CHF still appears to be ‘caught between a rock and a hard place’. In other words, irrespective of the direction one selects, opposing structure is close by. A short in this market has you contending with possible support from the 2017 yearly opening level at 1.0175, and a long has you competing with nearby weekly resistance at 1.0240. Granted, a long from above 1.02 has 40-points of wiggle room to play with, though given the lacklustre buying seen around this neighbourhood of late, it’s still a chancy move. With that being the case, the research team’s initial outlook stands: neither a long nor short seems attractive at this time.
Today’s data points: US Employment Cost Index q/q; Chicago PMI; US CB Consumer Confidence.
Dow Jones Industrial Average:
Outlook unchanged due to lacklustre movement.
US equities edged higher Monday ahead of Wednesday’s Fed action, more earnings and a potential advance in US Chinese trade talks. The Dow Jones Industrial Average eked out marginal gains of 0.04% (0.26% CFD).
The S&P 500 ended the day adding 0.11%, while the tech-heavy Nasdaq Composite chalked up a 0.16% gain.
Having seen a rather subdued session yesterday as well as little change observed to technical structure, the outlook for this market will remain unchanged as we head into Asia’s trading hours.
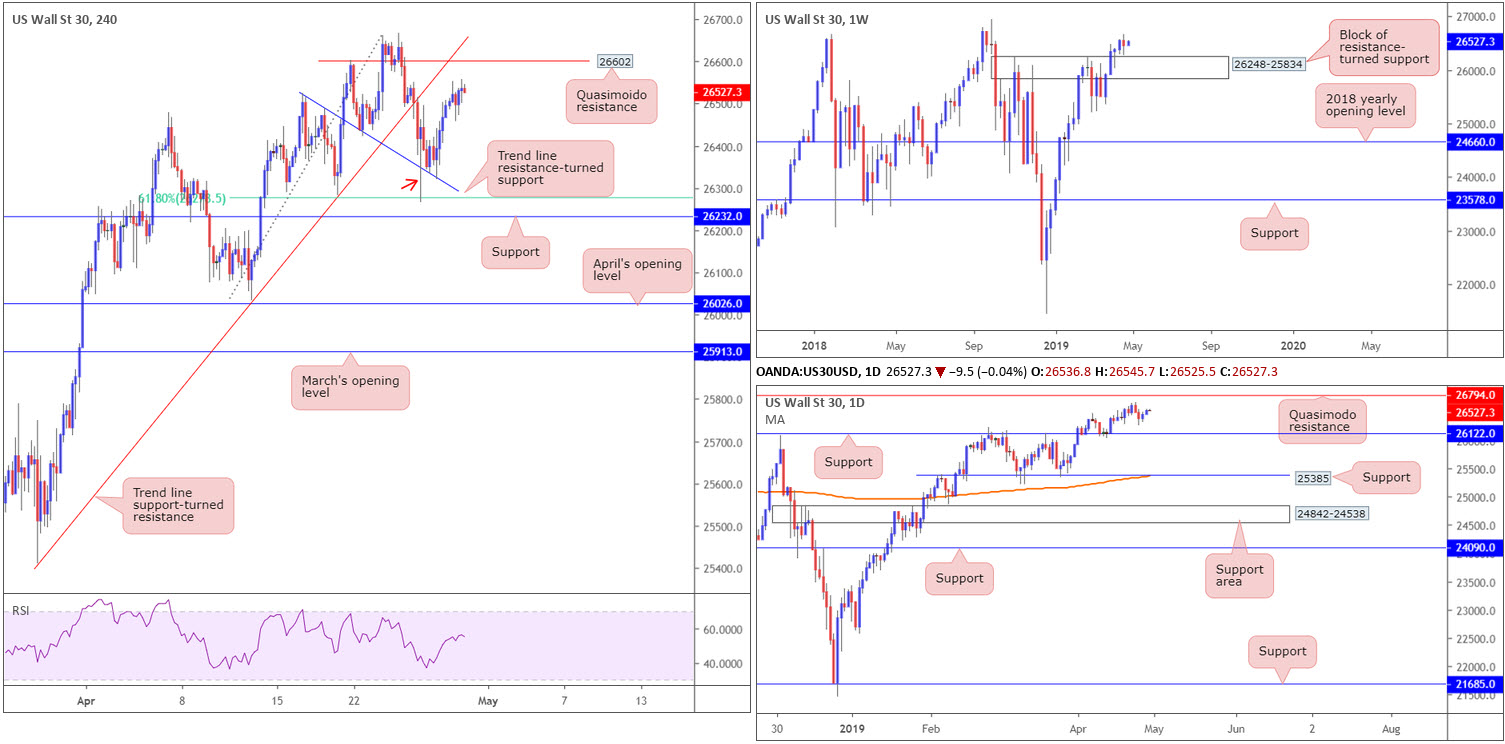
In the shape of a weekly bearish engulfing configuration, the Dow Jones Industrial Average settled the week lower, down 80 points. While candlestick traders may consider this a bearish signal, it is worth noting the formation printed just north of a block of resistance-turned support at 26248-25834.
Should our technical reading prove accurate, the next port of call to the upside on this timeframe can be seen around the all-time high of 26939.
Located within the top region of the current support zone on the weekly timeframe, daily structure displays support at 26122. To the upside, however, a Quasimodo resistance is present at 26794. A break beyond the current support this week has another layer of support to target at 25385, which happens to merge closely with the 200-day SMA (orange).
Technically, Monday extended Friday’s advance off trend line resistance-turned support taken from the high 26525. Further buying has a Quasimodo resistance in view at 26602 that merges closely with a trend line support-turned resistance drawn from the low 25410.
Areas of consideration:
Traders may still be long this market on the back of last Thursday’s goodish H4 pin-bar pattern (red arrow). The first logical take-profit target from here is the H4 Quasimodo resistance mentioned above at 26602. A break beyond here and price may approach the 26668 April 24 high, followed closely by the daily Quasimodo resistance mentioned above at 26794.
Today’s data points: US Employment Cost Index q/q; Chicago PMI; US CB Consumer Confidence.
XAU/USD (GOLD):
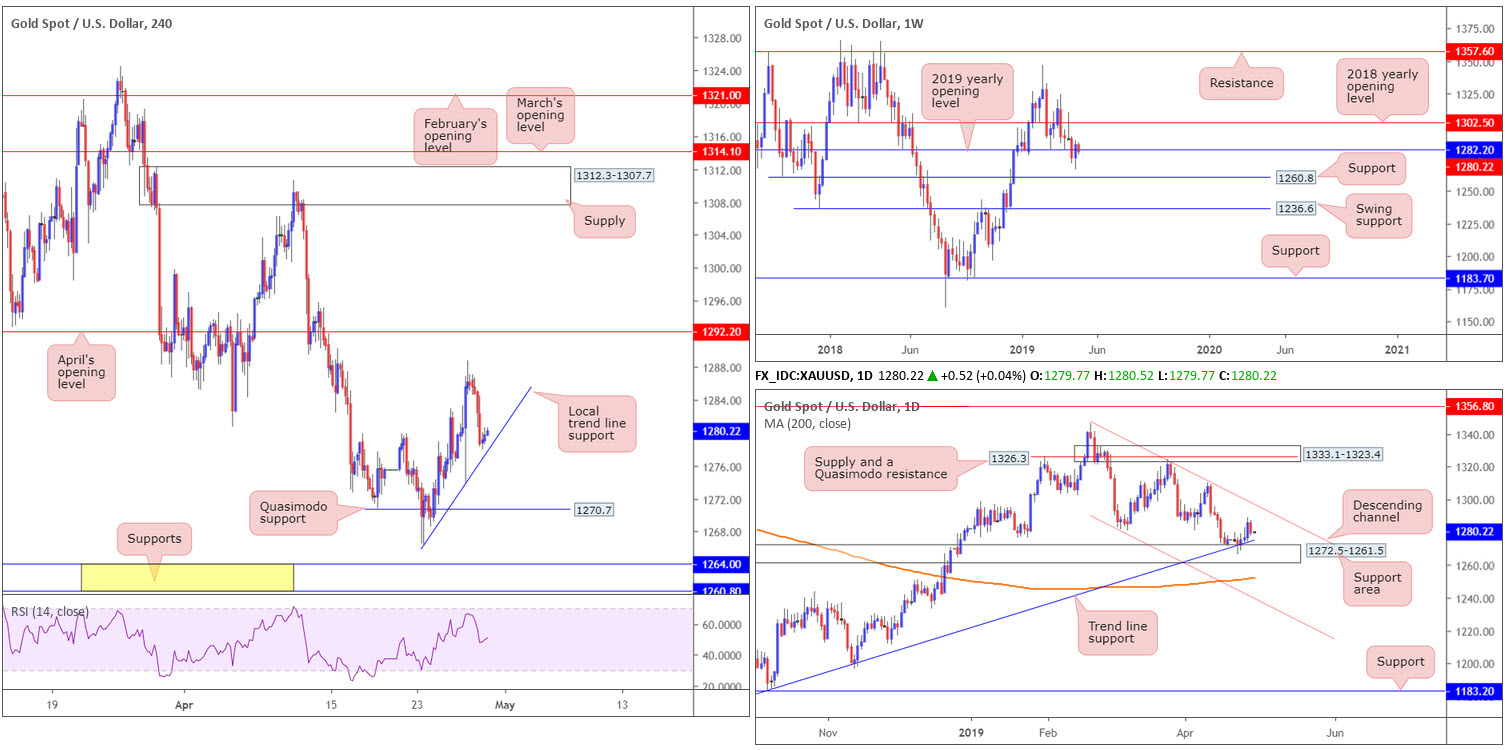
The price of gold, in $ terms, kicked off the week on a negative tone, concluding the day down nearly 0.50%. Reclaiming a large portion of Friday’s gains, daily flow is seen eyeballing a retest of a support area coming in at 1272.5-1261.5 this week, which, as you can see, merges with a trend line support etched from the low 1160.3. The next upside target from current price rests at a channel resistance drawn from the high 1346.7.
Weekly movement is seen flirting with its 2019 yearly opening level at 1282.2. Areas outside of this barrier to keep noted are support coming in at 1260.8 and the 2018 yearly opening level at 1302.5. A closer reading of price action on the H4 timeframe has the candles hovering just ahead of a local trend line support taken from the low 1266.1. To the upside, traders’ crosshairs are likely fixed on Friday’s high at 1288.7, tailed closely by April’s opening level at 1292.2, whereas to the downside Quasimodo support rests at 1270.7.
Areas of consideration:
Shorter-term traders may find use in the current H4 trend line support today, given it likely has additional ‘juice’ from the 2019 yearly opening level on the weekly timeframe at 1282.2 and the aforementioned daily support area.
Traders are, however, urged to consider waiting for additional confirmation to form before pulling the trigger from the said trend line support, as limited confluence is seen supporting this base on the H4 timeframe. A H4 hammer candlestick signal, for example, not only helps define buyer intent, it provides a structure with which to base entry and risk levels from.
The accuracy, completeness and timeliness of the information contained on this site cannot be guaranteed. IC Markets does not warranty, guarantee or make any representations, or assume any liability with regard to financial results based on the use of the information in the site.
News, views, opinions, recommendations and other information obtained from sources outside of www.icmarkets.com.au, used in this site are believed to be reliable, but we cannot guarantee their accuracy or completeness. All such information is subject to change at any time without notice. IC Markets assumes no responsibility for the content of any linked site. The fact that such links may exist does not indicate approval or endorsement of any material contained on any linked site.
IC Markets is not liable for any harm caused by the transmission, through accessing the services or information on this site, of a computer virus, or other computer code or programming device that might be used to access, delete, damage, disable, disrupt or otherwise impede in any manner, the operation of the site or of any user’s software, hardware, data or property.


