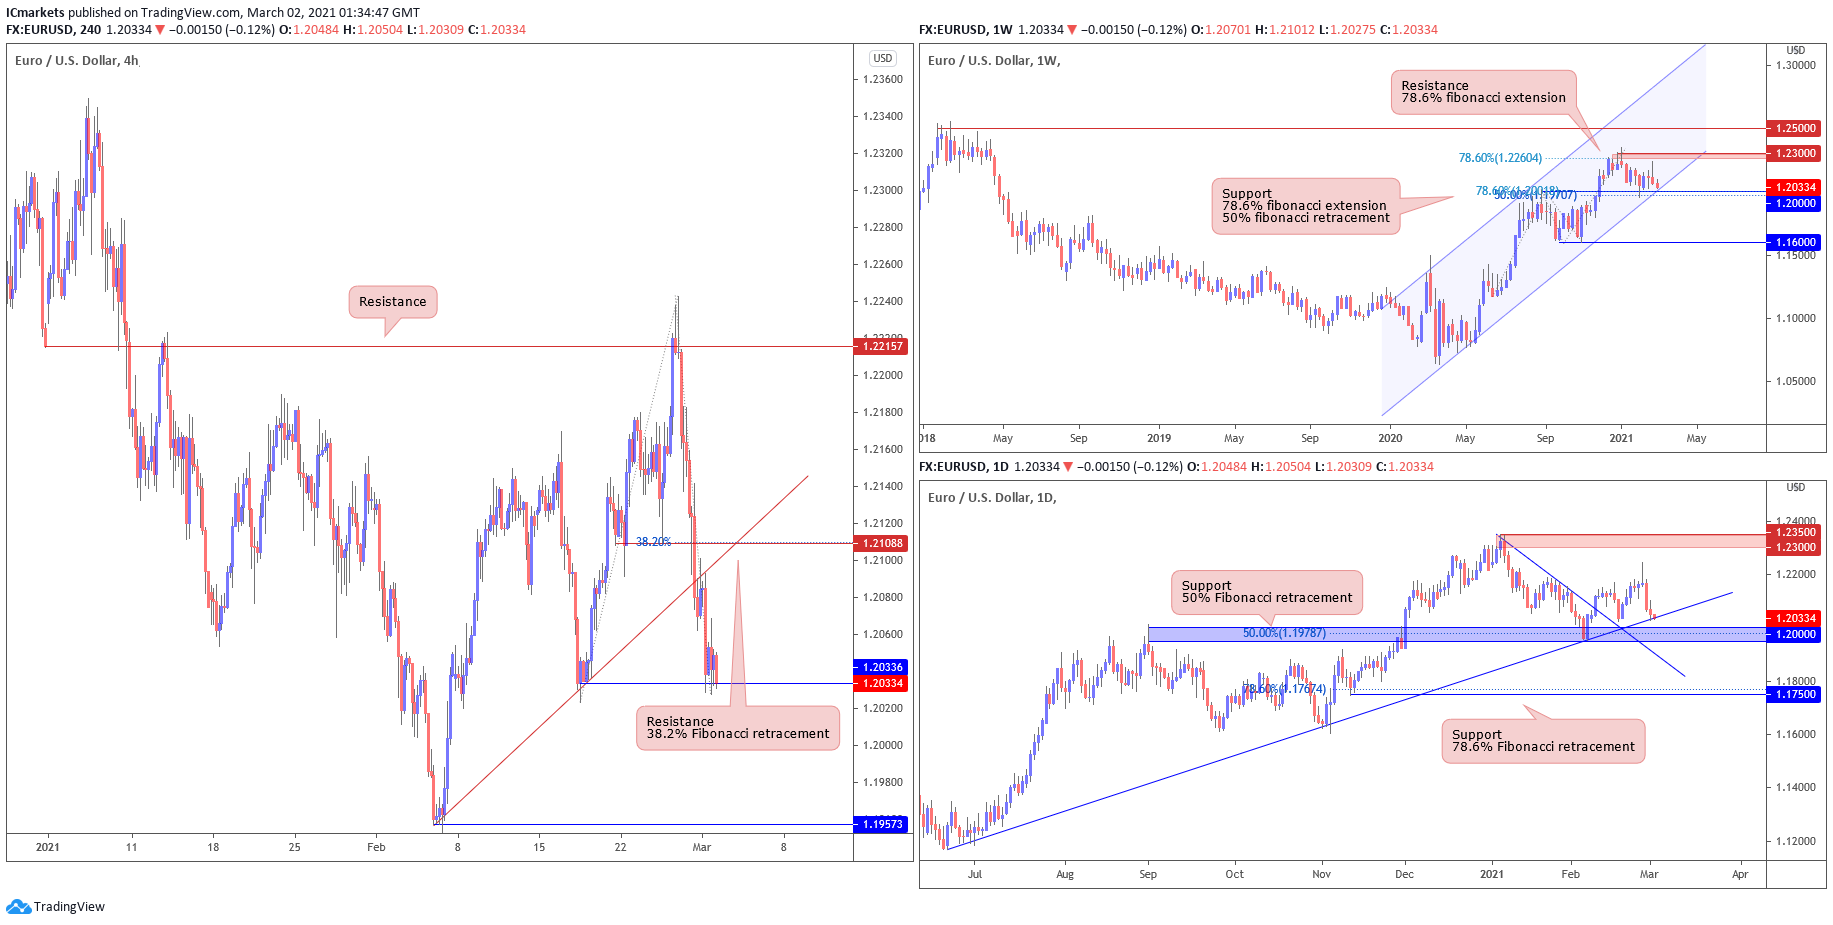
EUR/USD:
Looking at the weekly chart, we can see that prices are approaching the support area of our ascending channel at 1.200, which coincides with the 50% Fibonacci retracement and 78.6% Fibonacci extension. We could see a further upside to test our resistance area at 1.2300, in line with the graphical swing high resistance and 78.6% Fibonacci extension. On the daily time frame, prices are holding nicely above the ascending trend line and support area at 1.200 which can also be found on the weekly time frame.
On the H4 timeframe, prices are testing our support level at 1.20336, in line with our graphical swing low support and a break below this level could see a further drop to our next support area at 1.19573 – 1.20000, in line with the support area found on the daily and weekly time frame.
Areas of consideration:
- 20336 support area found on H4 time frame
- 21088 resistance level found on H4 time frame
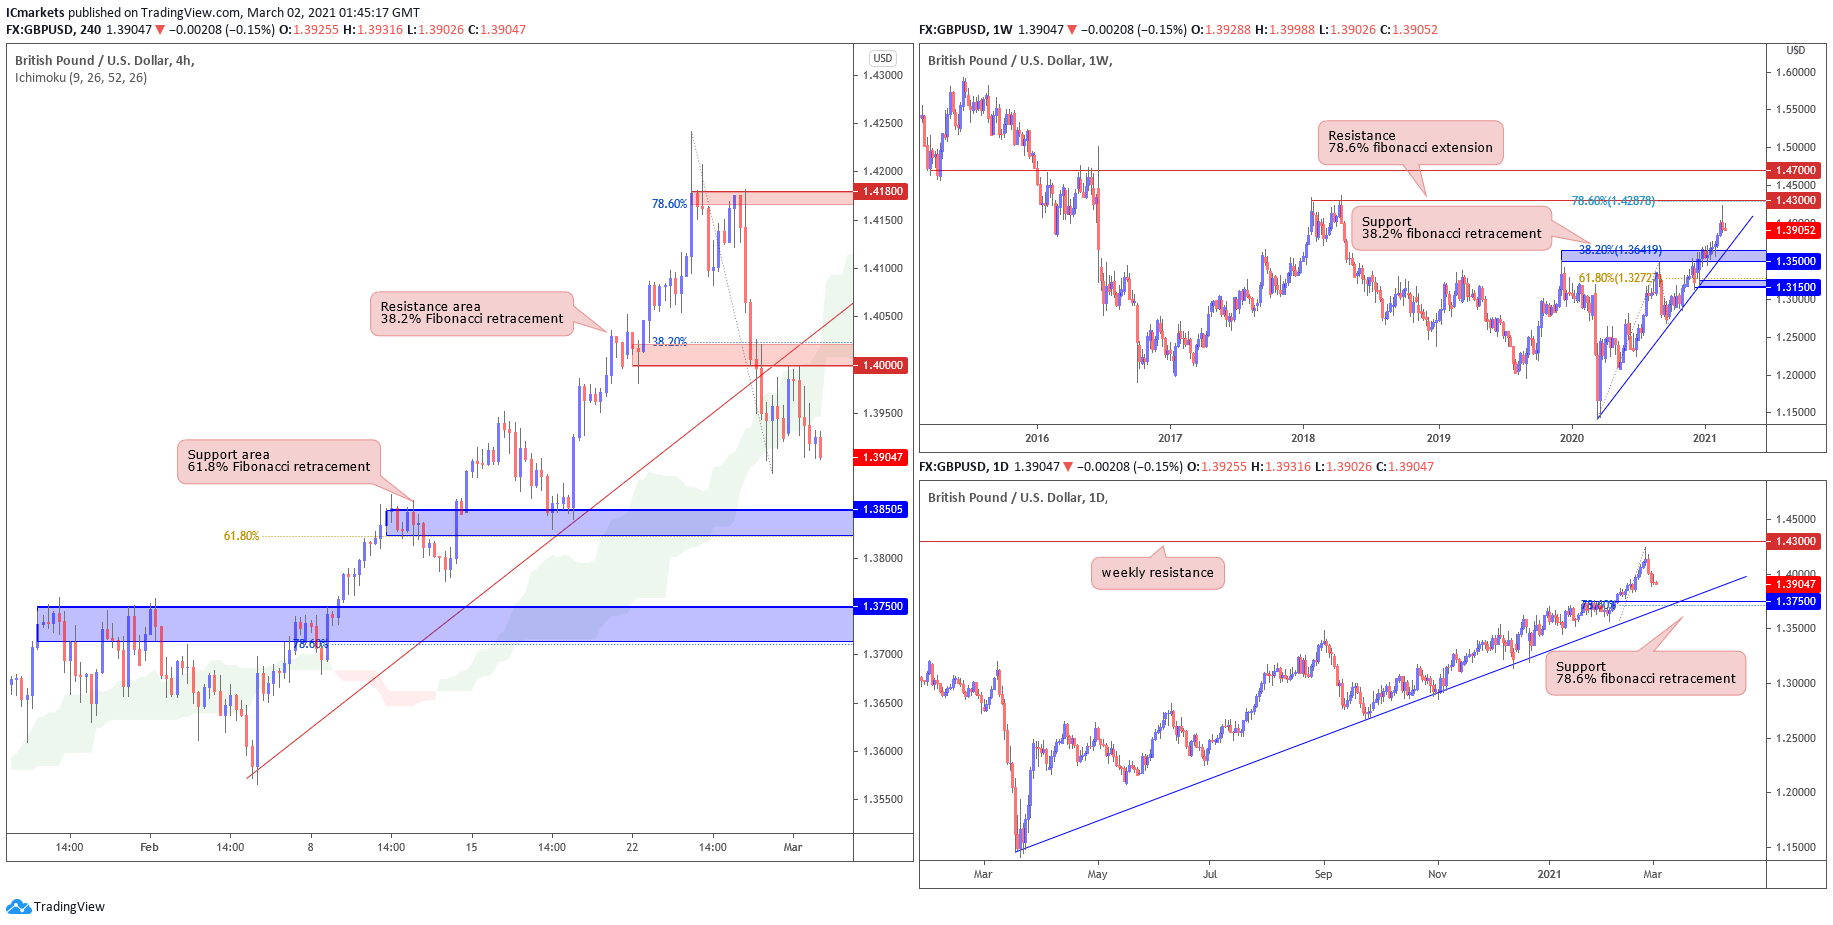
GBP/USD:
Looking at the weekly chart, we can see that prices are approaching our ascending trend line and weekly support area at 1.35000 where we could see a further downside before it reaches our support level, in line with the graphical pullback support area and 38.2% Fibonacci retracement. On the daily time frame, our support area at 1.37500 coincides with the 78.6% Fibonacci retracement and ascending trend line.
On the H4 timeframe, prices are facing bearish pressure from our resistance area at 1.40000, in line with our graphical pullback resistance area and 38.2% fibonacci retracement. We could see a further drop below this level to test our next support level at 1.38505, which is in line with the horizontal overlap support level and 61.8% fibonacci retracement.
Areas of consideration:
- 40000 resistance area found on H4 time frame
- 37500 support area found on H4 timeframe
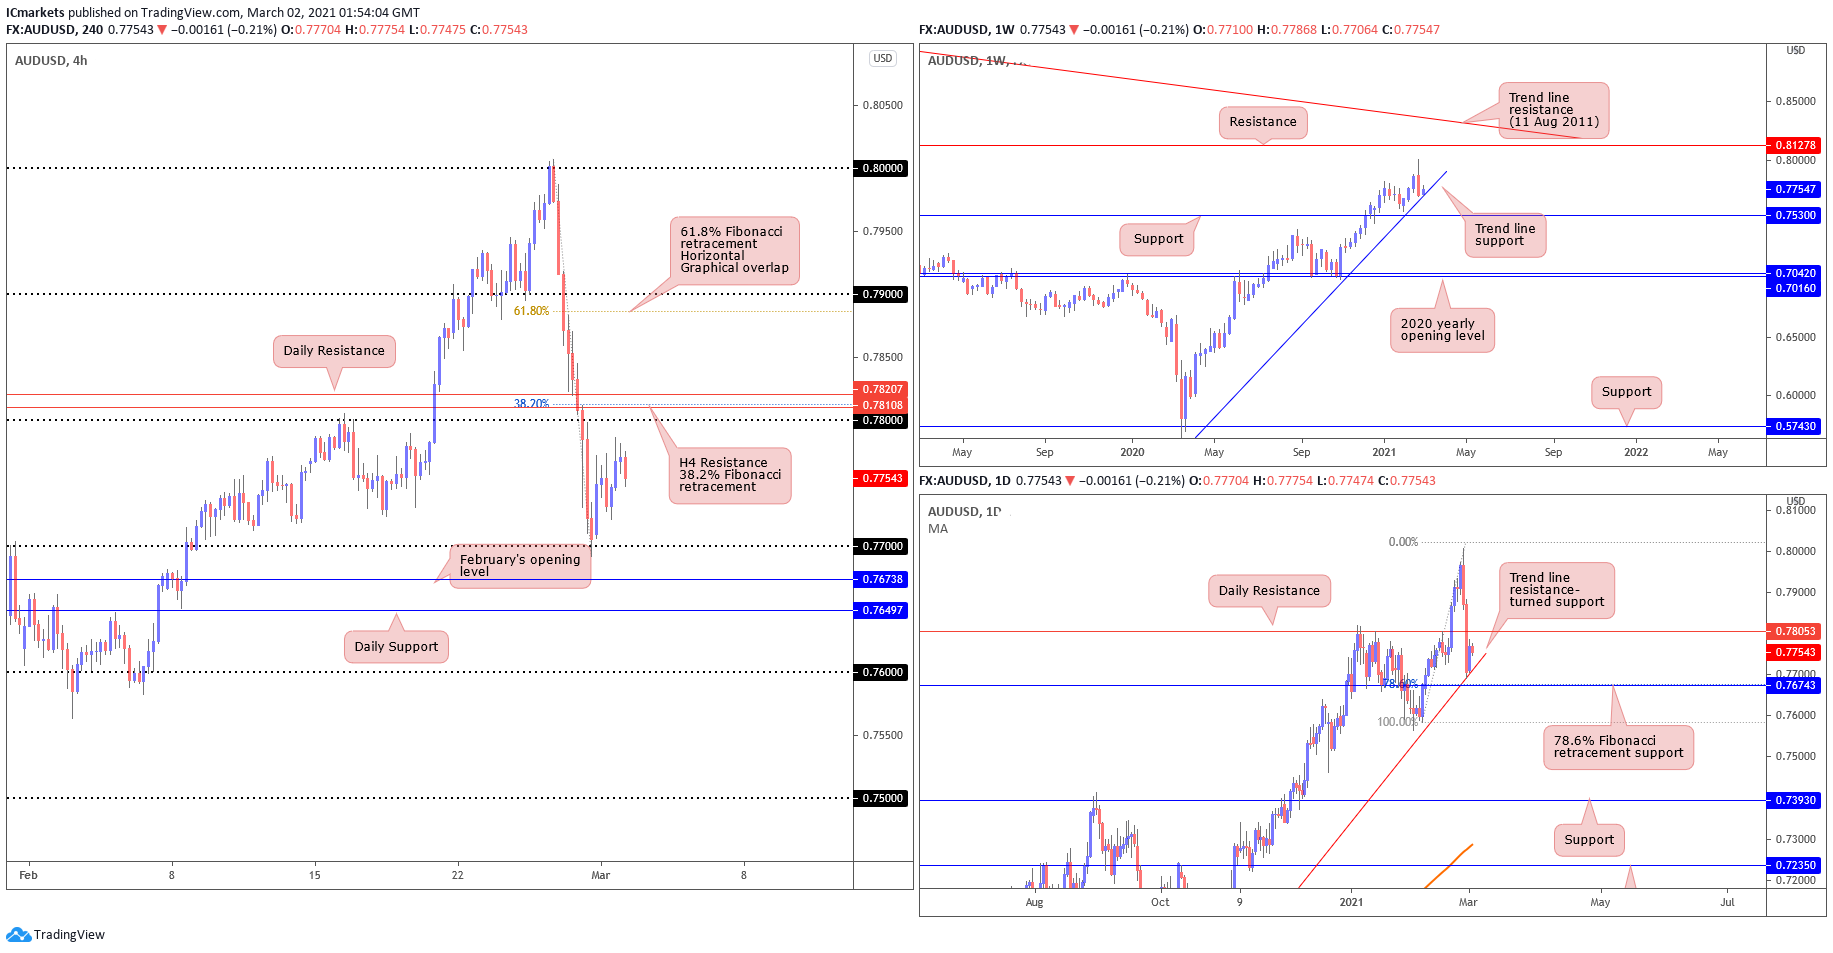
AUD/USD:
From the Weekly timeframe, we can see that the price has returned back to the ascending trendline support drawn from 9th March (2020), where we witnessed a small bounce up North away from the support. On the Daily timeframe, price has closed above the ascending trendline and may move up North to test the Daily resistance level of 0.78053. On H4, price is approaching 0.78 major level, in line with the 38.2% Fibonacci retracement and Daily resistance level. If this level manages to be broken, we may see a further push upside towards the 61.8% fibonacci retracement and horizontal graphical overlap level. Which may signify the continuation of the bullish move.
Areas of consideration:
- H4 within touching distance from profit target of 38.2% fibonacci retracement, 0.78 major figure and Daily resistance.
- Bullish momentum may push prices up higher towards the H4 fibonacci retracement level of 61.8% at 0.78866.
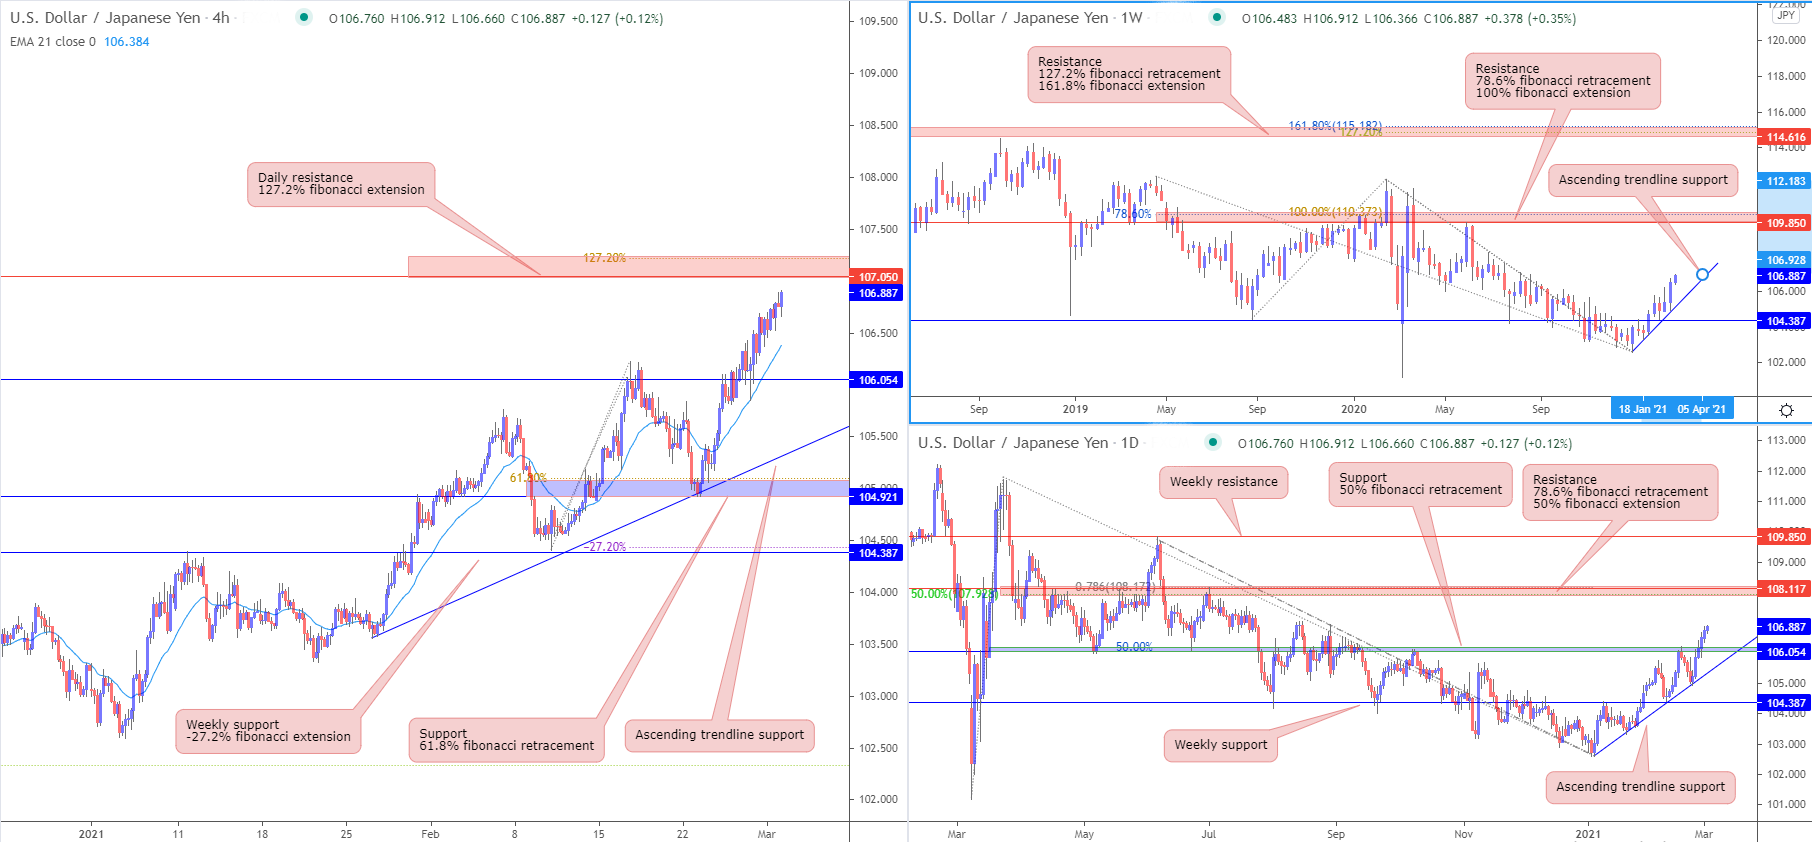
USD/JPY
From the weekly timeframe, we can see that the price is facing bullish pressure from the ascending trendline support and horizontal swing low support, towards the horizontal swing high resistance level which coincides with 78.6% fibonacci retracement and 100% fibonacci extension. On the daily time frame, prices are bouncing off from horizontal pullback support which coincides with 50% retracement level towards the horizontal swing high resistance which coincides with 50% fibonacci extension and 78.6% fibonacci retracement. On the H4, prices might push higher towards horizontal swing high resistance which coincides with the 127.2% fibonacci extension. EMA is also below prices, showing bullish pressure for price.
Areas of consideration:
- 454 support level on the daily time frame is a possible upside target
- 454 support level on daily timeframe in line with the ascending trendline support and 78.6% fibonacci retracement
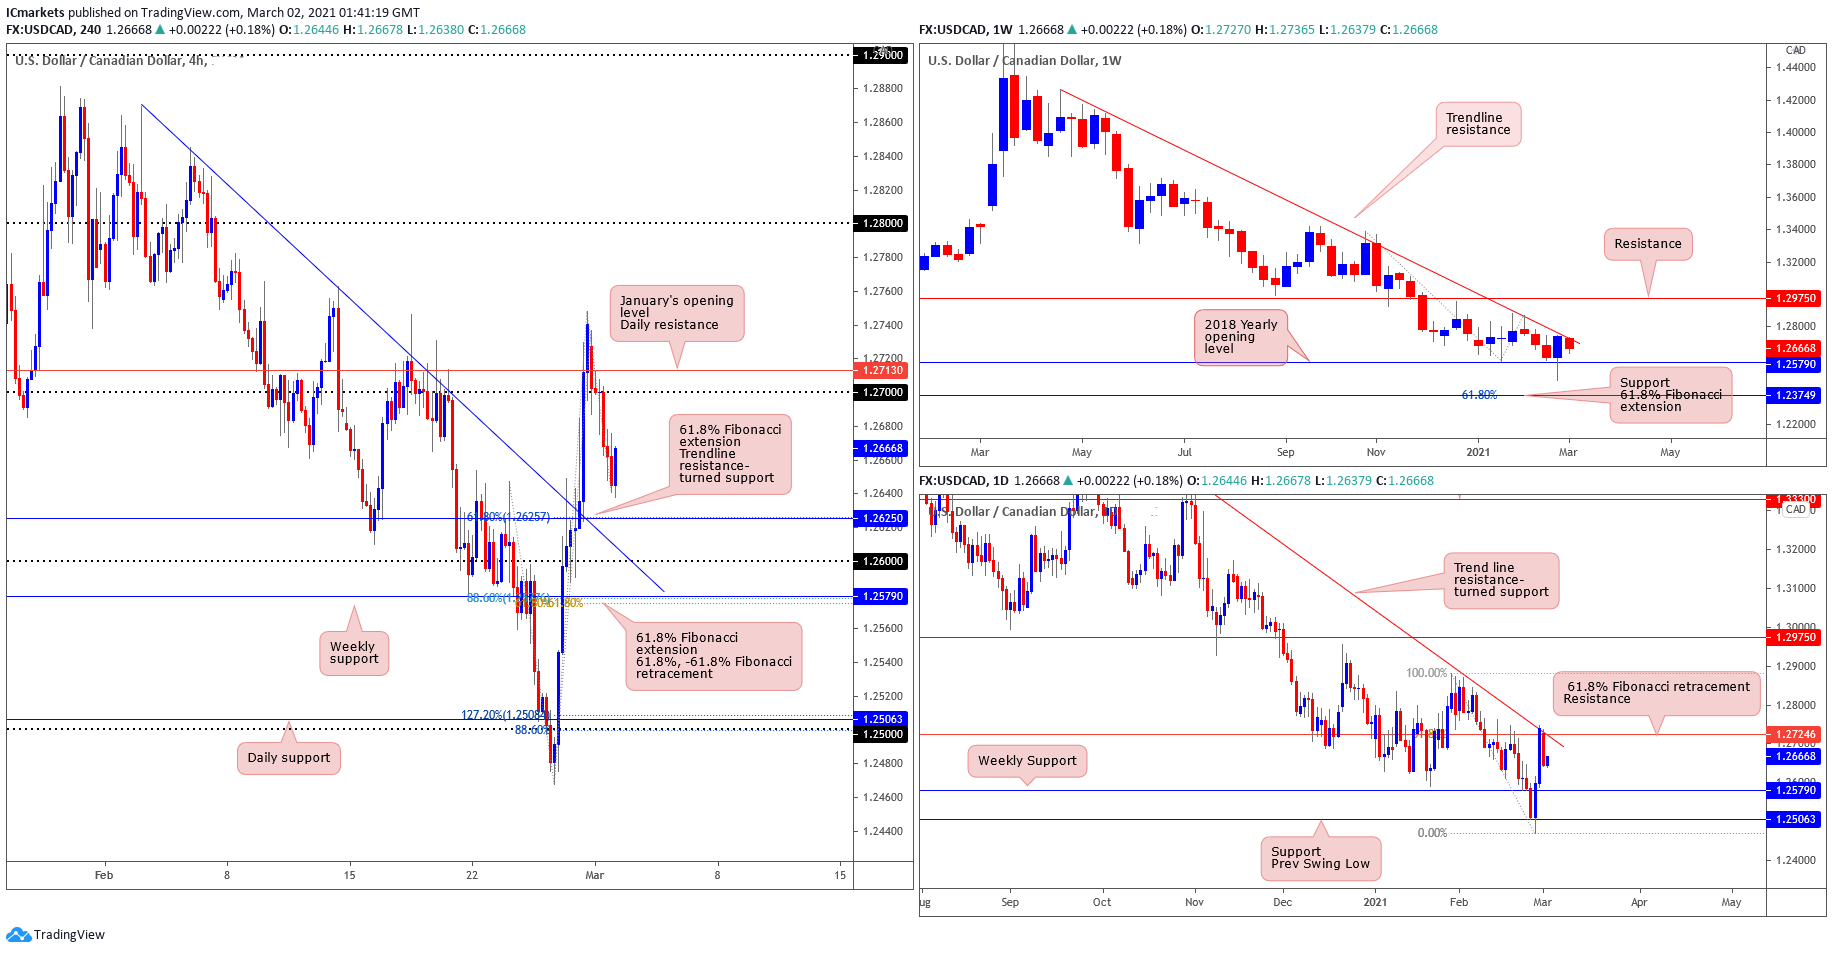
USD/CAD:
Looking at the weekly chart, price has pushed away from the descending trendline, and is still showing bearish momentum. It is important to note that the long-term picture has pointed the direction down (trend) since March (2020). In the daily time frame, price closed under the trendline resistance as well as the 61.8% fibonacci retracement value at 1.27246. We may see a further push downside towards the Weekly support level of 1.2579. And on the H4 timeframe, price is within touching distance of our profit target at 1.2625 level. We may expect a further push down South as a continuation of this bearish momentum if price manages break pass the descending trendline resistance turned- support, towards 1.2579 level where the fibonacci confluence of 61.8% Fibonacci extension, 61.8% and -61.8% Fibonacci retracement are.
Areas of consideration:
- H4 approaching profit target, may continue bearish move if 1.2625 level is broken and retested
- Next target for bearish continuation would be 2579 level where the fibonacci confluence of 61.8% Fibonacci extension, 61.8% and -61.8% Fibonacci retracement are.
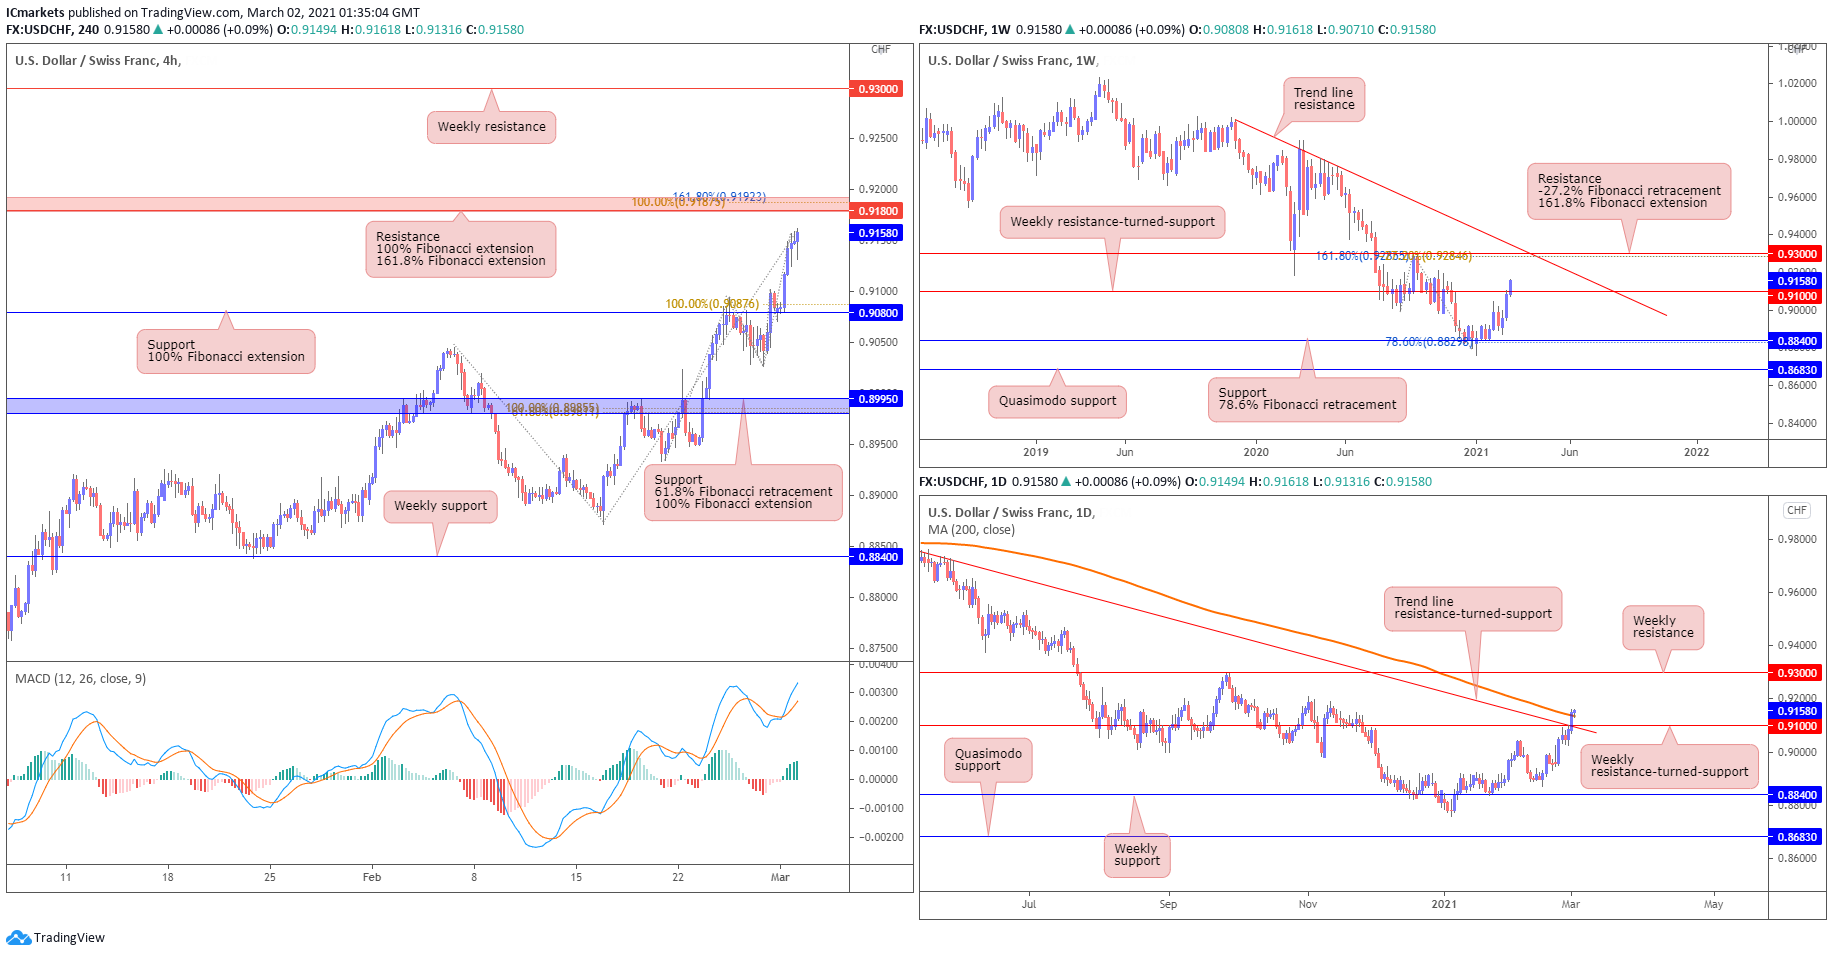
USD/CHF:
On the weekly chart, USD/CHF shows a strong break above our weekly resistance-turned-support at the 0.91000 level, where we expect a stronger pullback to the weekly trendline and the weekly 0.93000 resistance level, in line with our -27.2% Fibonacci retracement and 161.8% Fibonacci extension. The daily timeframe also shows that price broke above the 0.91000 level, daily trendline and the moving average resistances. In this scenario, it is possible to see a stronger pullback to test the 0.93000 weekly resistance level.
Looking at the H4 chart, we see that price is making a bullish move up as well. We note that the MACD is also holding above the 0 line, in line with our bullish bias on the shorter timeframe. We could potentially see price rising further to test the 0.91800 resistance level, which is in line with our 100% and 161.8% Fibonacci extension levels, as well as the 0.93000 weekly resistance level. Otherwise, should price hold below the 0.91800 level, we could see a pullback to test the 0.90800 support level, in line with our 100% Fibonacci extension level.
Areas of consideration:
- Price broke above the weekly 0.91000 resistance level, and is rising further to test the 0.93000 weekly resistance level.
- 91800 resistance level is a key level to watch on the H4 timeframe.
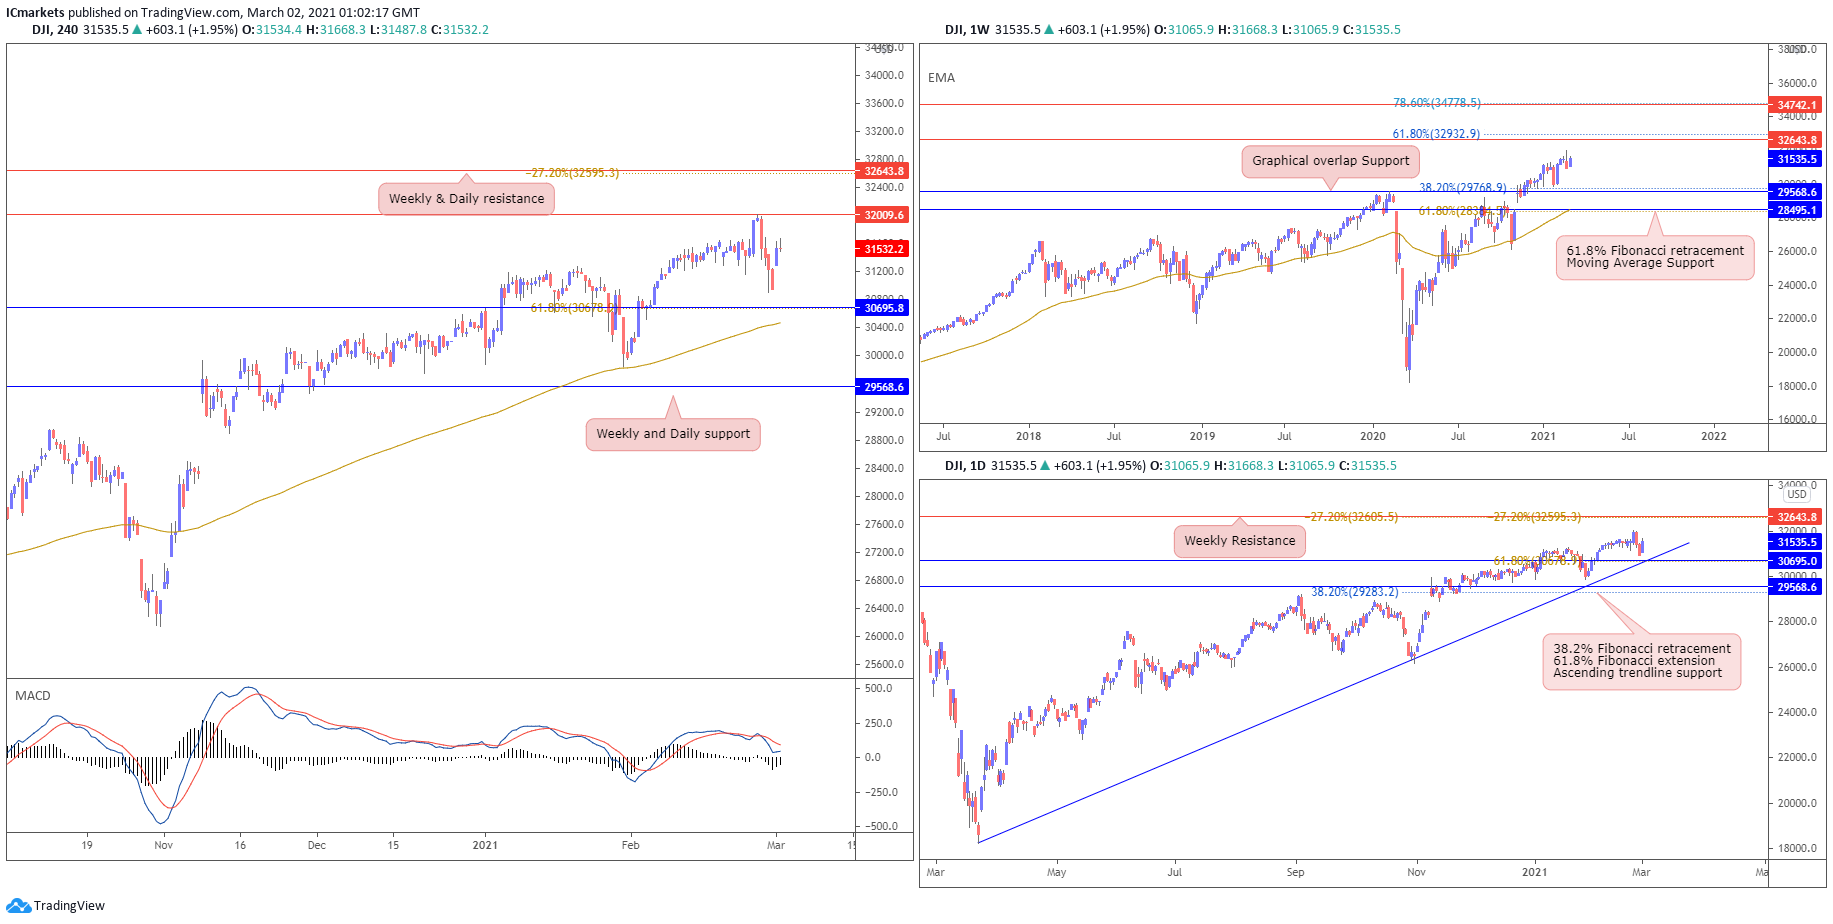
Dow Jones Industrial Average:
On the weekly chart, price edged higher, holding between 32643 resistance and 29568 support. Despite price holding above the long term moving average, there remains no strong levels for entry for now. On the Daily, price continues to hold very strongly above ascending trendline support. With price coming back to test the ascending support at 30662, it is possible that traders could see a bounce above this support and should be careful when deciding to trade any short term pullbacks as the bullish momentum still remains strong.
On the H4, price drifted back towards resistance at 32009. Despite technical indicators calling for further bullish upside, there remains no clear levels for entry on the intraday. Traders should continue to watch resistance at 32009 and support at 30695.
Areas of consideration:
- Indicators remain bullish
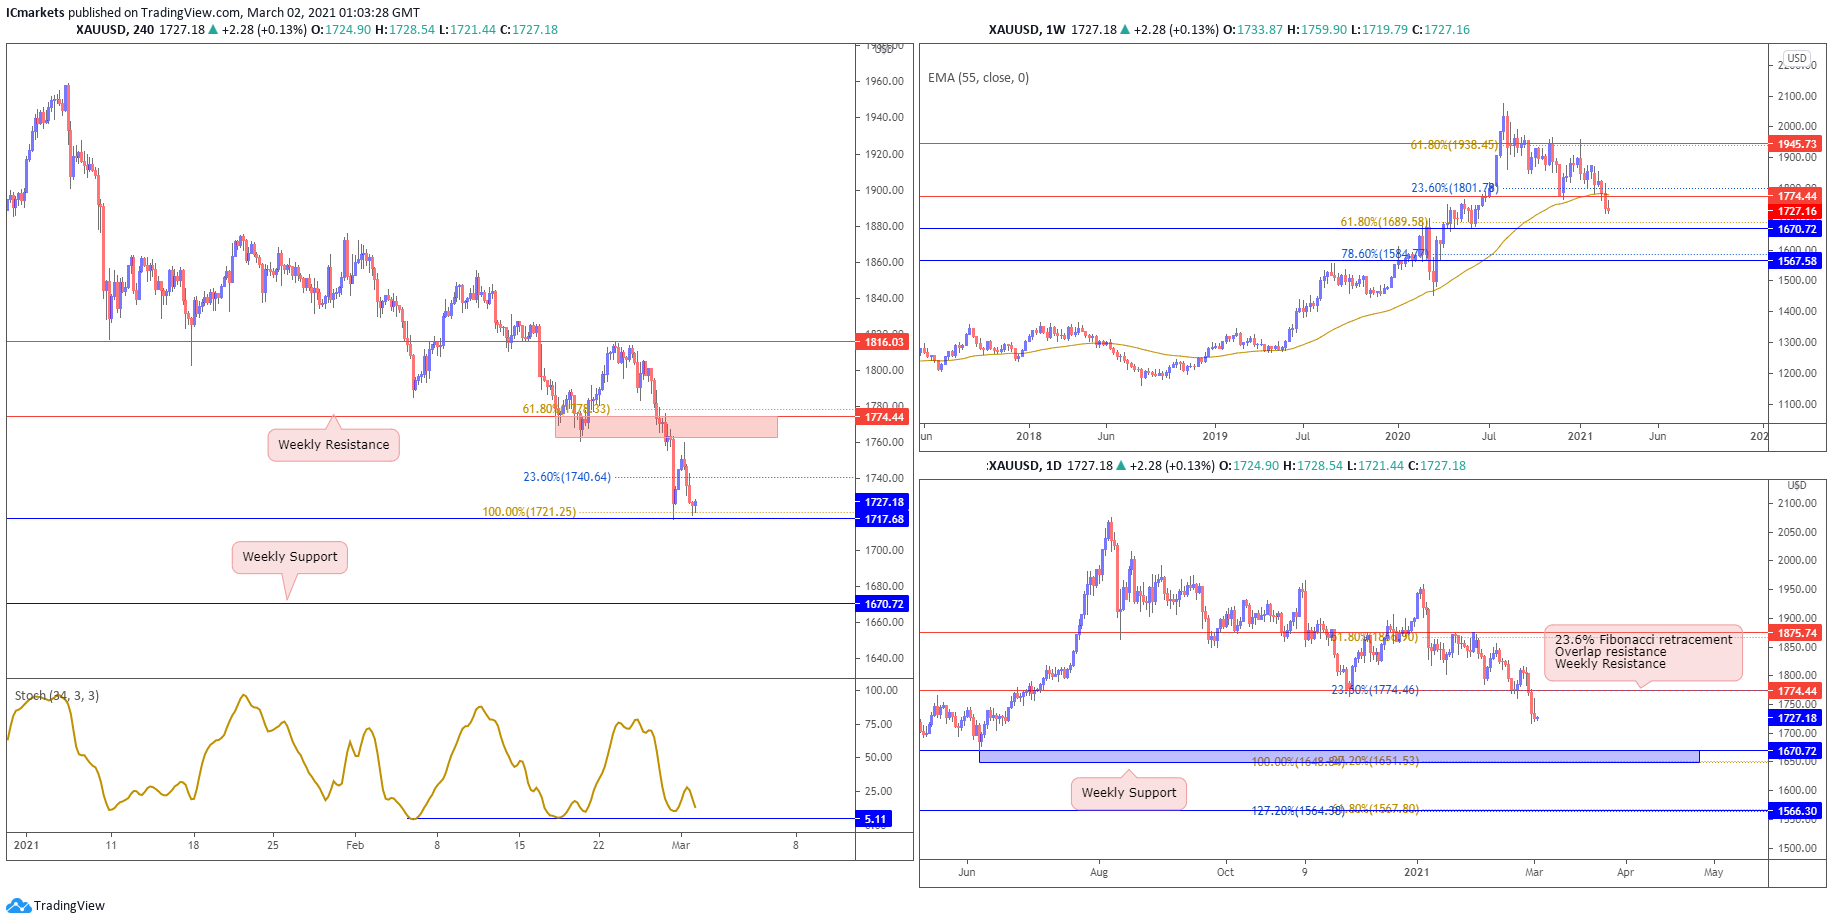
XAU/USD (GOLD):
On the weekly timeframe, gold pushed lower breaking previous supports. Price has also broken below long term moving average. Price could very well ride the bearish momentum and drift lower towards 1670 support which is in line with key 61.8% Fibonacci retracement level. On the daily chart, we see price drifting lower, and traders should look out for any pullbacks towards 1774 resistance where long term swing traders could add to their sells to push price lower towards 1670.
On the 4H timeframe price testing and holding above 1717 support which is also in line with Key 100% Fibonacci extension level. With stochastics on support where price bounced in the past, a short term intraday bounce towards 1774 weekly resistance could be likely before seeing any chance of a drop. However, should price fail to hold above 1717 support, traders can also expect price to drop towards next weekly support at 1670 level.
Areas of consideration:
- 1717 intraday support to hold short term intraday bounce
The accuracy, completeness and timeliness of the information contained on this site cannot be guaranteed. IC Markets does not warranty, guarantee or make any representations, or assume any liability regarding financial results based on the use of the information in the site.
News, views, opinions, recommendations and other information obtained from sources outside of www.icmarkets.com.au, used in this site are believed to be reliable, but we cannot guarantee their accuracy or completeness. All such information is subject to change at any time without notice. IC Markets assumes no responsibility for the content of any linked site.
The fact that such links may exist does not indicate approval or endorsement of any material contained on any linked site. IC Markets is not liable for any harm caused by the transmission, through accessing the services or information on this site, of a computer virus, or other computer code or programming device that might be used to access, delete, damage, disable, disrupt or otherwise impede in any manner, the operation of the site or of any user’s software, hardware, data or property.


