
Key risk events today:
Australia Current Account; RBA Cash Rate and Rate Statement.
(Previous analysis as well as outside sources – italics).
EUR/USD:
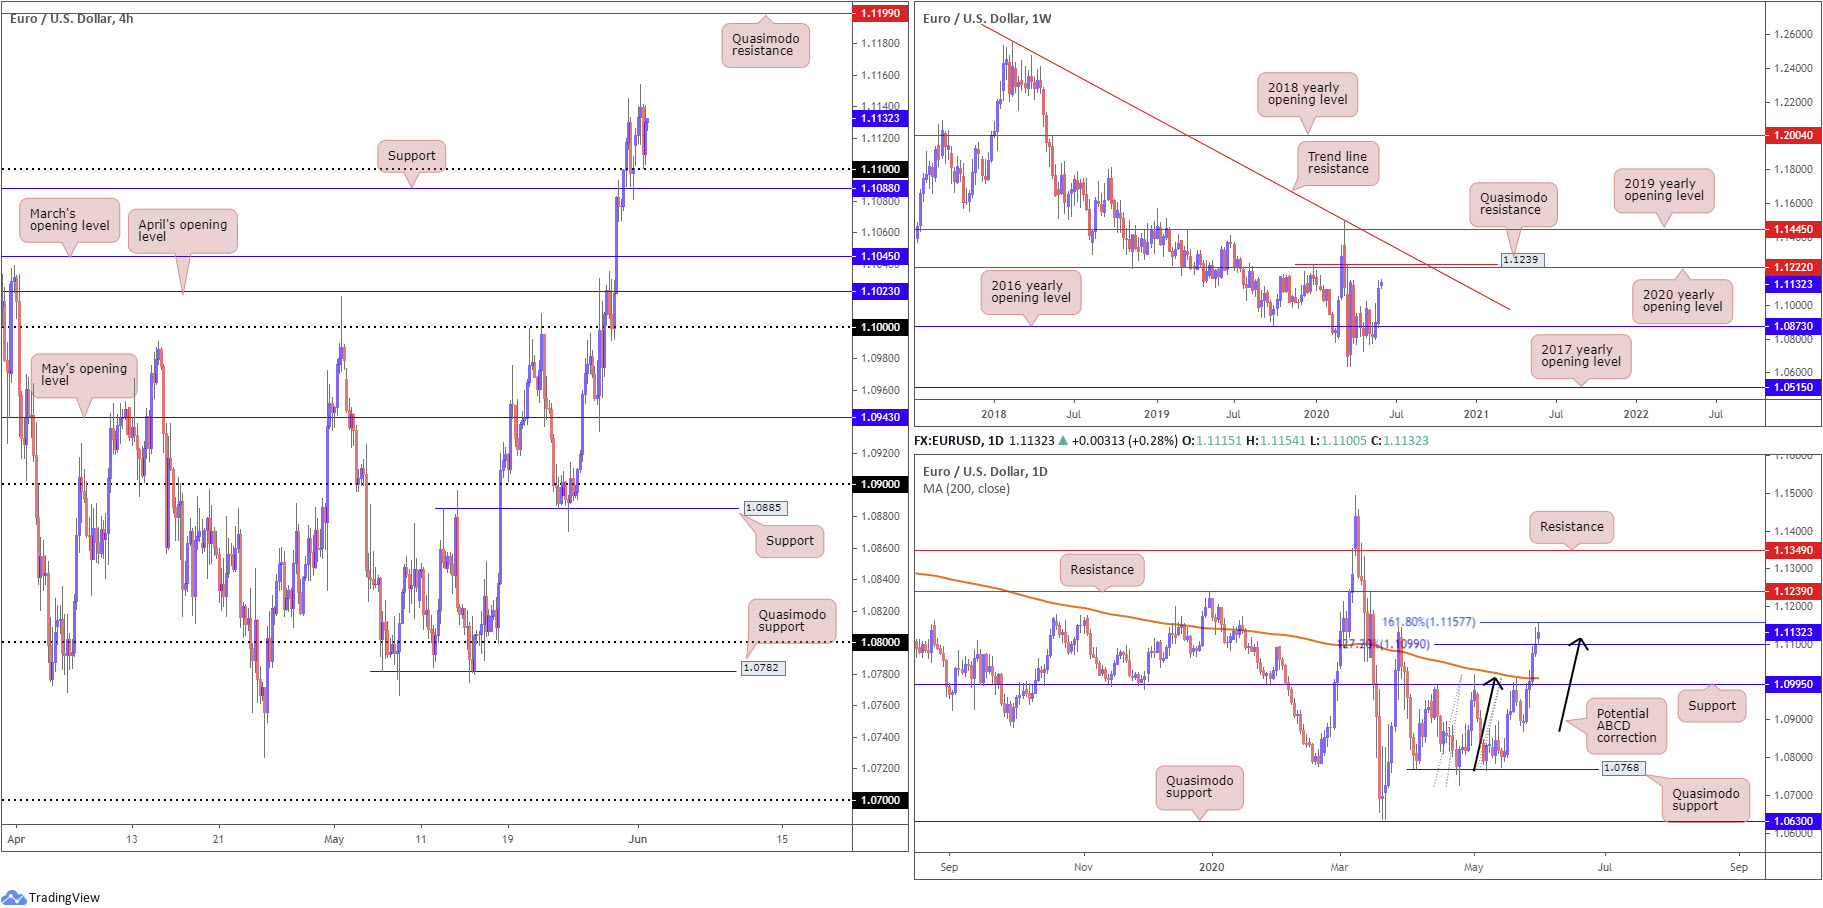
Aided via the headline US manufacturing ISM miss, the US dollar kicked off the week defensively, brushing aside the 98.00 handle and clocking lows at 97.82. EUR/USD held off 1.11, bolstered closely by H4 support at 1.1088, a prior Quasimodo resistance level. Aside from the 1.1147 March 27 high, which entered play yesterday, along with the 1.1189 March 17 high, Quasimodo resistance rests as the next upside target from 1.1199 on the H4 timeframe. Space under 1.1088, nevertheless, has March’s opening level at 1.1045 in sight, closely followed by April’s opening level at 1.1023.
The story on the weekly timeframe continues to echo an enthusiastic tone north of the 2016 yearly opening level at 1.0873, positioning the 2020 yearly opening level at 1.1222 (regarded as strong resistance) in striking distance, closely followed by Quasimodo resistance at 1.1239. With respect to the long-term trend, the pair has remained under pressure since topping in early February 2018.
Contrary to the weekly timeframe’s position, after resistance at 1.0995 and the 200-day SMA (orange – 1.1010) collapsed last week, price challenged an interesting area of resistance at 1.1157-1.1099 (comprised of a 161.8% Fibonacci extension point at 1.1157, a 127.2% Fibonacci extension point at 1.1099 and a ABCD correction pattern [black arrows] at 1.1115). Despite Monday’s advance, a turn from 1.1157/1.1099 places 1.0995 on the hit list as support; alternatively, additional upside has resistance at 1.1239 calling for attention (essentially the same base as weekly QM).
Areas of consideration:
A pullback from daily resistance between 1.1157/1.1099 is still not out of the question, given upside momentum appears to be slowing. The pull from the weekly timeframe to 1.1222, though, may weigh on sellers.
Bearish strategies, therefore, remain an option sub 1.1088 on the H4 timeframe, targeting March’s opening level at 1.1045, April’s opening level at 1.1023 and the 1.10 key figure (converges closely with daily support at 1.0995).
Alternatively, those long from 1.11 on the H4 may seek Quasimodo resistance at 1.1199 as an initial upside target, followed by weekly resistance (2020 yearly opening level) at 1.1222. That is assuming we get past the 1.1147 March 27 high and the 1.1189 March 17 high.
GBP/USD:
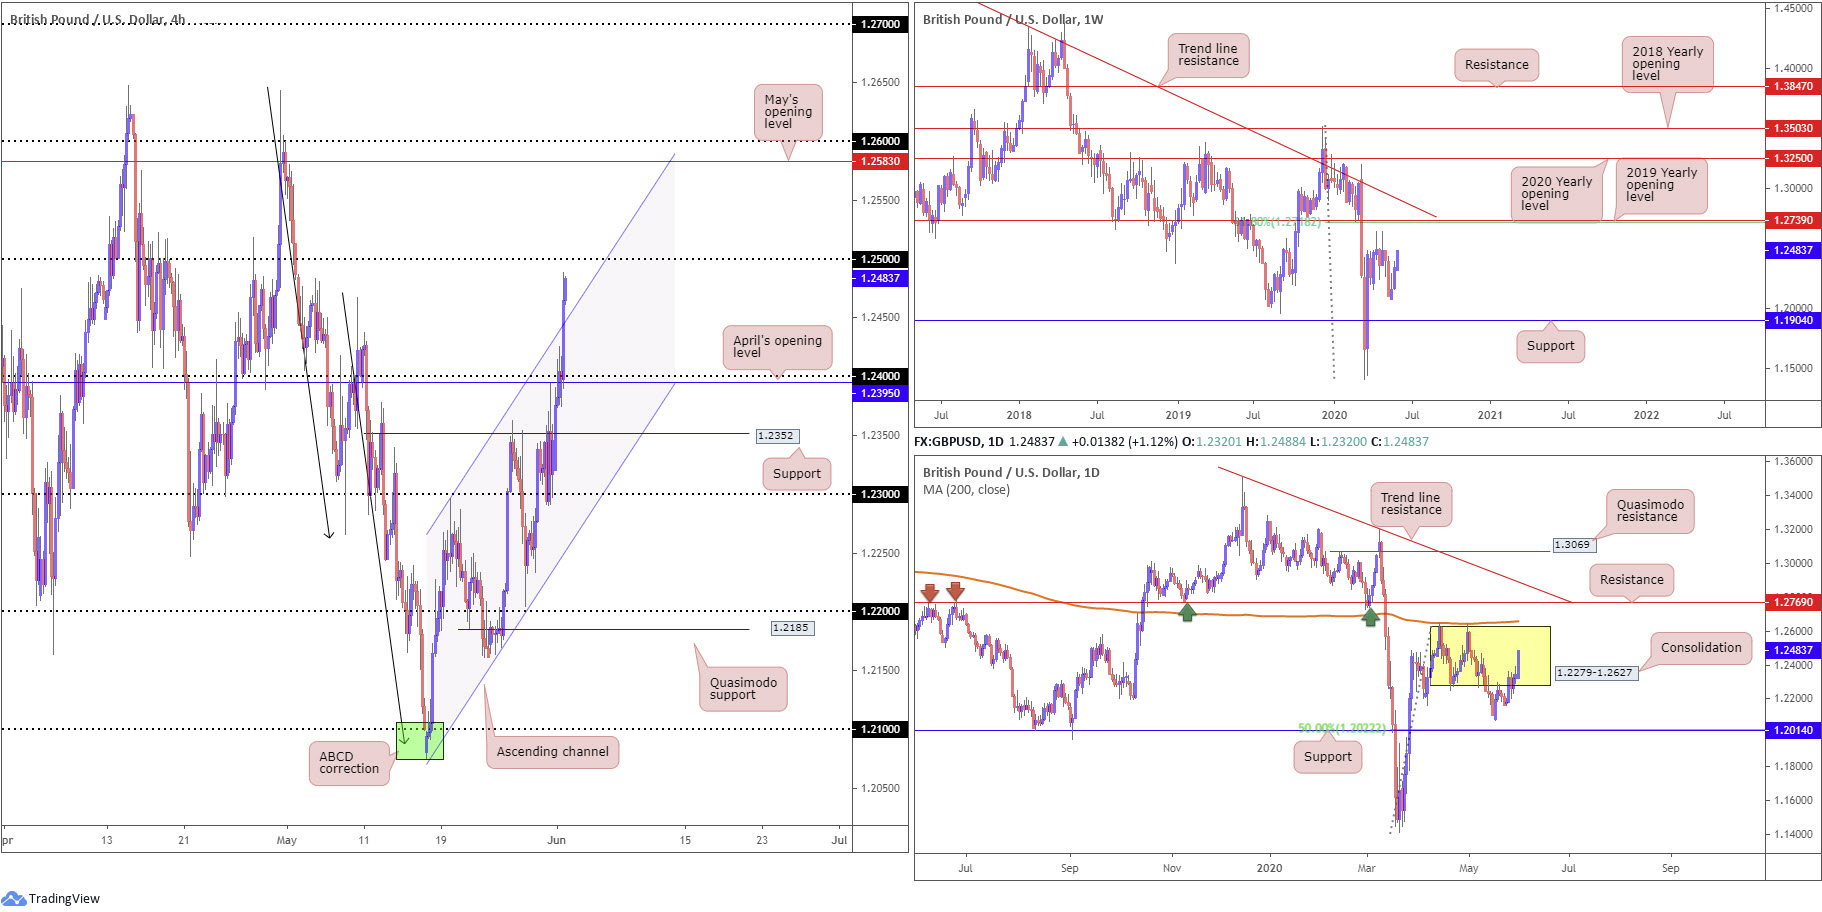
The British pound came into the new week swinging against the US dollar amidst shifts in market positioning ahead of Brexit negotiations and persistent USD selling.
Overrunning a number of key resistances on the H4 timeframe Monday, including the 1.24 handle and channel resistance, taken from the high 1.2296, we’re now sited within a stone’s throw away from the 1.25 handle. A break of this level exposes May’s opening level at 1.2583, closely followed by 1.26.
Viewing GBP/USD from the higher timeframes, we can see weekly price extending recovery gains. Support on the weekly timeframe positions itself at 1.1904, assuming price engulfs 1.2075. Resistance, on the other hand, falls in at 1.2739, the 2019 yearly opening level, and a 61.8% Fibonacci retracement ratio at 1.2718, sited a handful of pips under trend line resistance, extended from the high 1.5930.
Price action on the daily timeframe has the unit exploring higher ground within a familiar range between 1.2279-1.2627. Note the 200-day SMA (orange – 1.2658) circles the upper base of the said range, with a break shining the spotlight on resistance drawn from 1.2769.
Areas of consideration:
1.25 is an obvious resistance point to be aware of on the H4 timeframe today, though selling from this base could be hampered by channel resistance-turned support (1.2296). A break of 1.25, nonetheless, could signal breakout buying strategies to 1.26ish, followed by daily range peaks at 1.2627. Conservative traders may seek a retest at 1.25 prior to pulling the trigger. This helps avoid fakeouts and unnecessary losses.
AUD/USD:
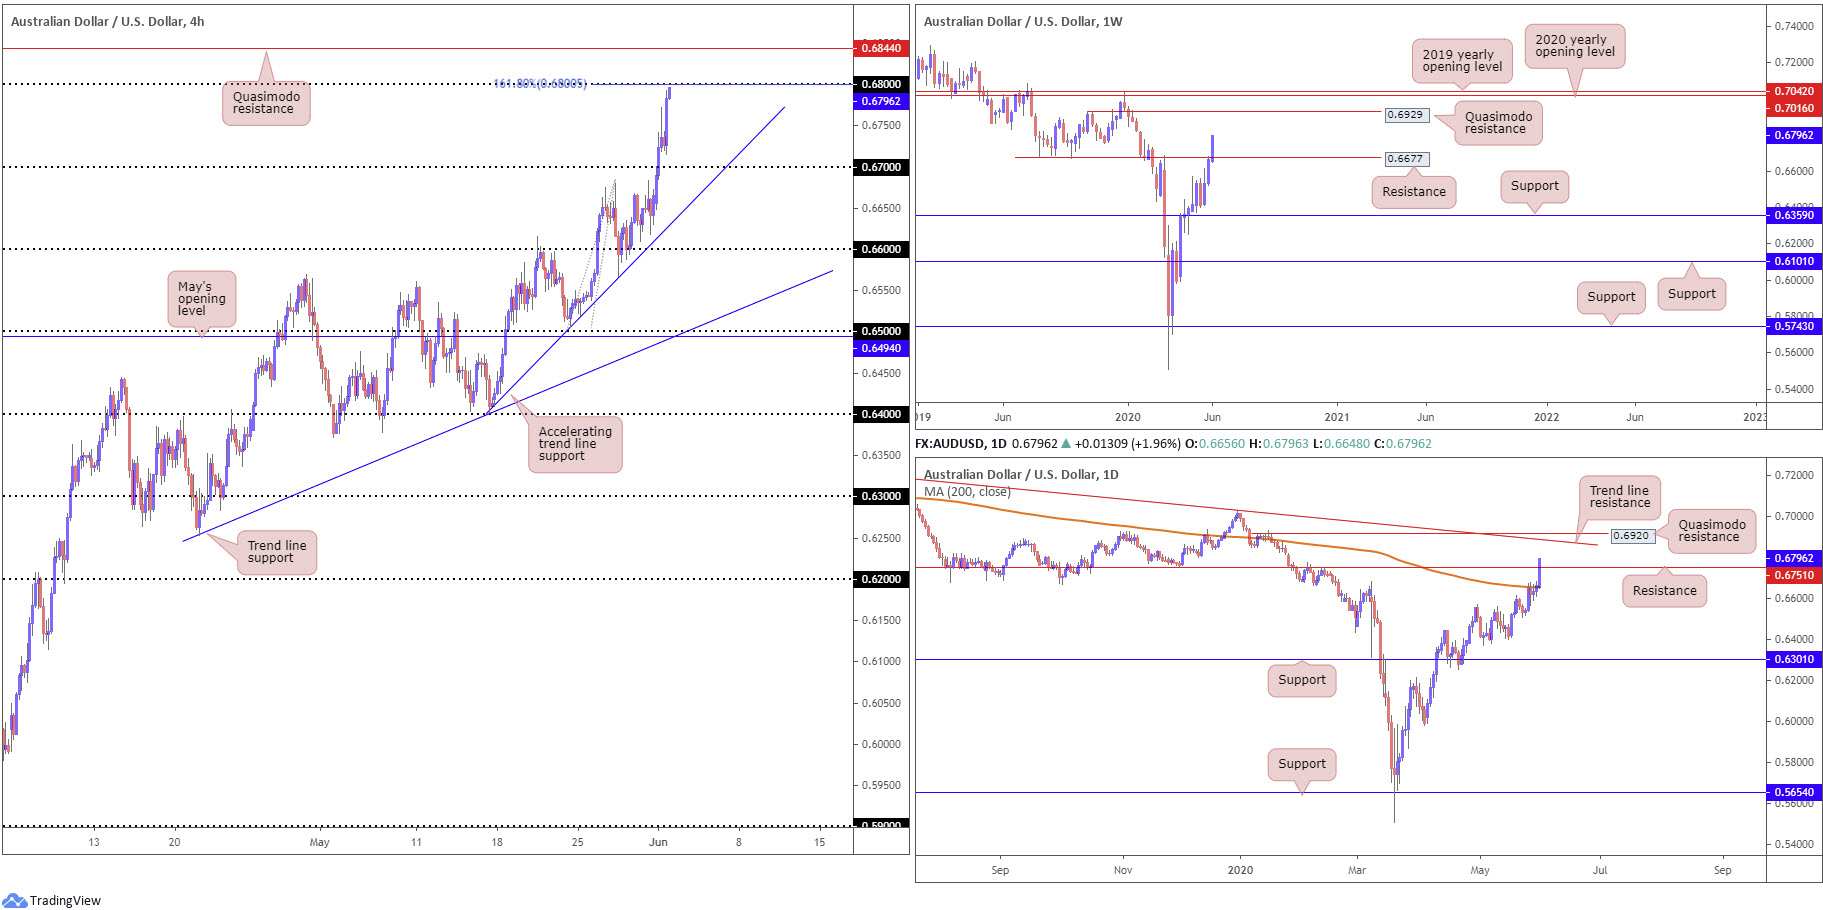
The Australian dollar outperformed vs. the US dollar Monday amid improved global risk sentiment.
Up nearly 2% at the close of trade, the 0.67 handle put up little fight as a resistance on the H4 timeframe, leaving price free to approach 0.68. The noted round number, as can be seen from the chart, merges with a 161.8% Fibonacci extension point, followed by Quasimodo resistance seated at 0.6844.
Further afield on the weekly timeframe, resistance at 0.6677 offered little on Monday, consequently throwing Quasimodo resistance at 0.6929 in the pot as a feasible upside hurdle this week. In conjunction with the weekly timeframe, we have daily price also establishing a footing north of the 200-day SMA (orange – 0.6654) and resistance at 0.6751. This invites the possibility of further buying towards trend line resistance, extended from the high 0.7393, and Quasimodo resistance plotted at 0.6920.
Areas of consideration:
While countertrend traders, particularly intraday players, may find 0.68 an appealing resistance owing to its relationship with a H4 161.8% Fibonacci extension point, both weekly and daily timeframes suggest higher levels are on the menu. Therefore, a rejection off 0.68 could come to fruition, though may not be anything to write home about.
A H4 close above 0.68 will appeal to buyers, targeting H4 Quasimodo resistance at 0.6844 as an initial port of call, followed by 0.69 and maybe, with a little oomph, higher-timeframe resistances.
USD/JPY:
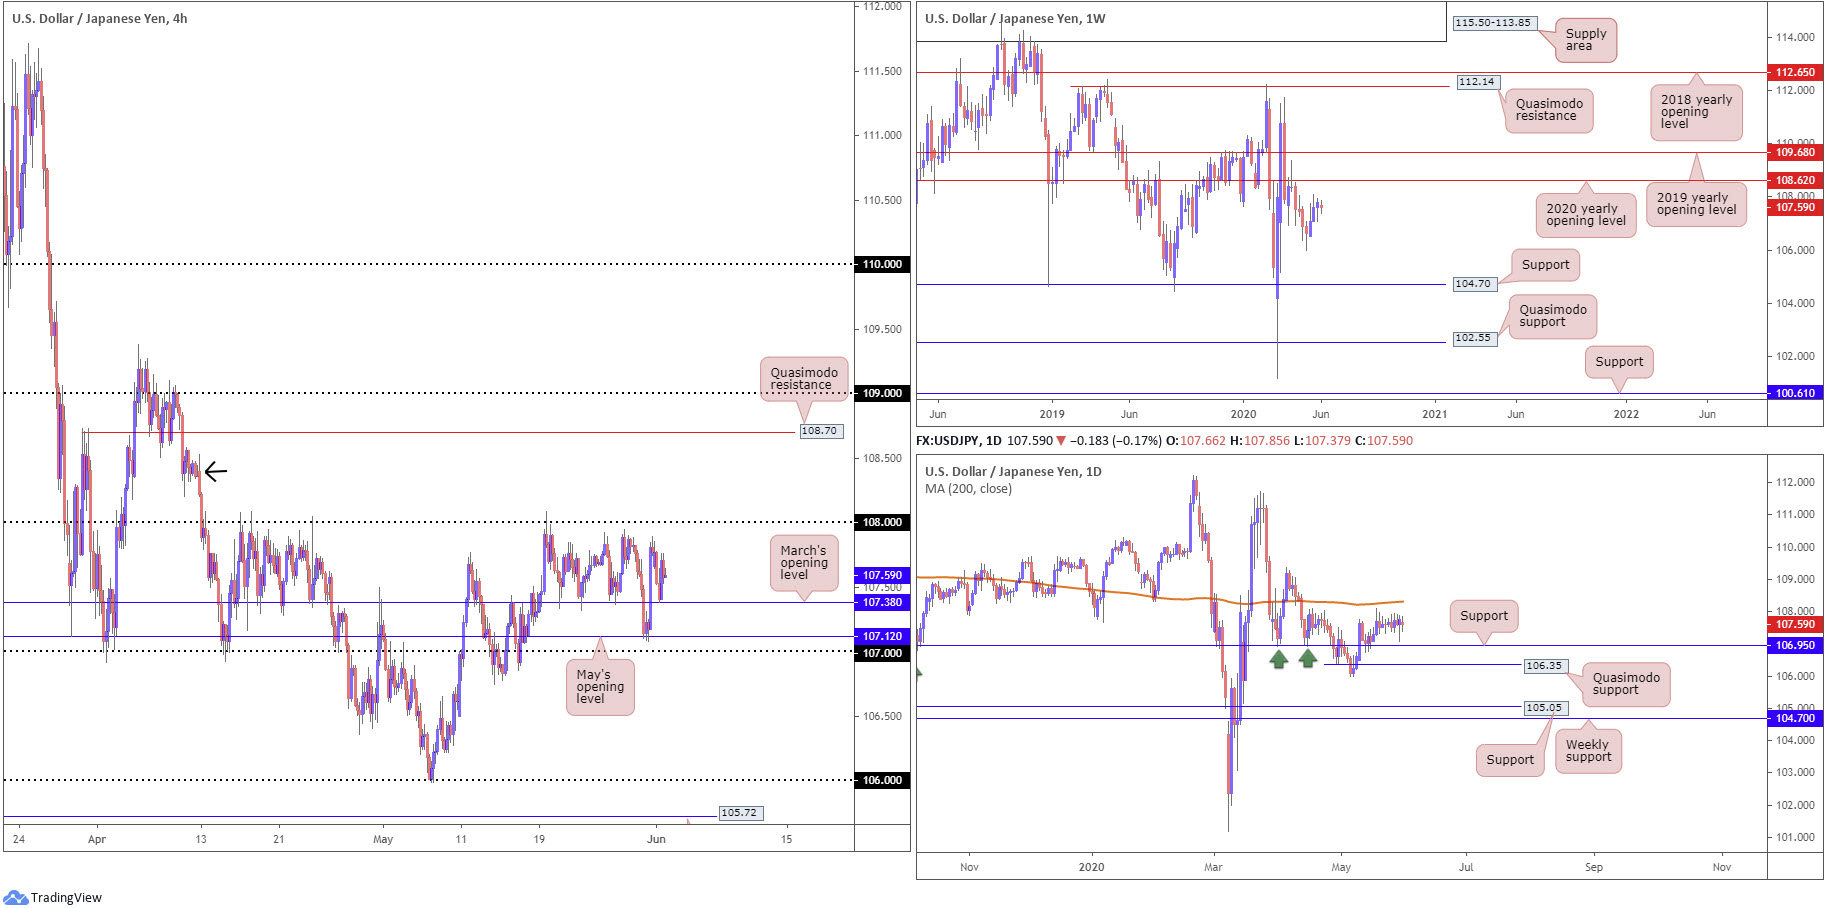
USD/JPY prices concluded Monday pretty much unmoved, despite improved global risk sentiment. As a result, much of the following will echo thoughts put forward in Monday’s technical briefing.
From the weekly timeframe, we can see last week finished eking out a third consecutive weekly gain, swimming in close proximity to the 2020 yearly opening level at 108.62, a notable port of resistance. Ousting sellers at 108.62 shoves the 2019 yearly opening level at 109.68 into sight. A rotation to the downside from current price, nevertheless, has the 105.98 May 6 low in view, followed by support at 104.70.
Candle action, albeit relatively stationary, maintains a bid north of daily support at 106.95, hovering within striking distance of the 200-day SMA (orange – 108.31), followed by the 109.38 April 6 high. Quasimodo support at 106.35 represents a reasonably significant ‘floor’ in the event we tunnel through 106.95, with a violation shining the limelight on support at 105.05.
Sell-stops south of March’s opening level at 107.38 on the H4 timeframe were filled Friday after knocking on May’s opening level at 107.12 heading into London. Buyers came out swinging as we transitioned into US hours, however, reclaiming 107.38+ status and closing the week within reaching distance of 108. Monday witnessed a brief retest at 107.38, which held as support. Above 1.08, aside from the possibility of supply emerging from 108.50ish (black arrow), Quasimodo resistance is visible at 108.70.
Areas of consideration:
A fakeout through 108 into the 200-day SMA at 108.31 is a potential scenario possibly interesting sellers. Buy-stops contained above 108 may provide enough fuel to sell. Conservative traders, however, may seek a H4 close back beneath 108 before committing.
The H4 Quasimodo resistance at 108.70 remains an interesting point, positioned close by the weekly resistance at 108.62 (the 2020 yearly opening level).
To the downside, 107 also remains a particularly interesting support given its relationship with daily support at 106.95.
USD/CAD:
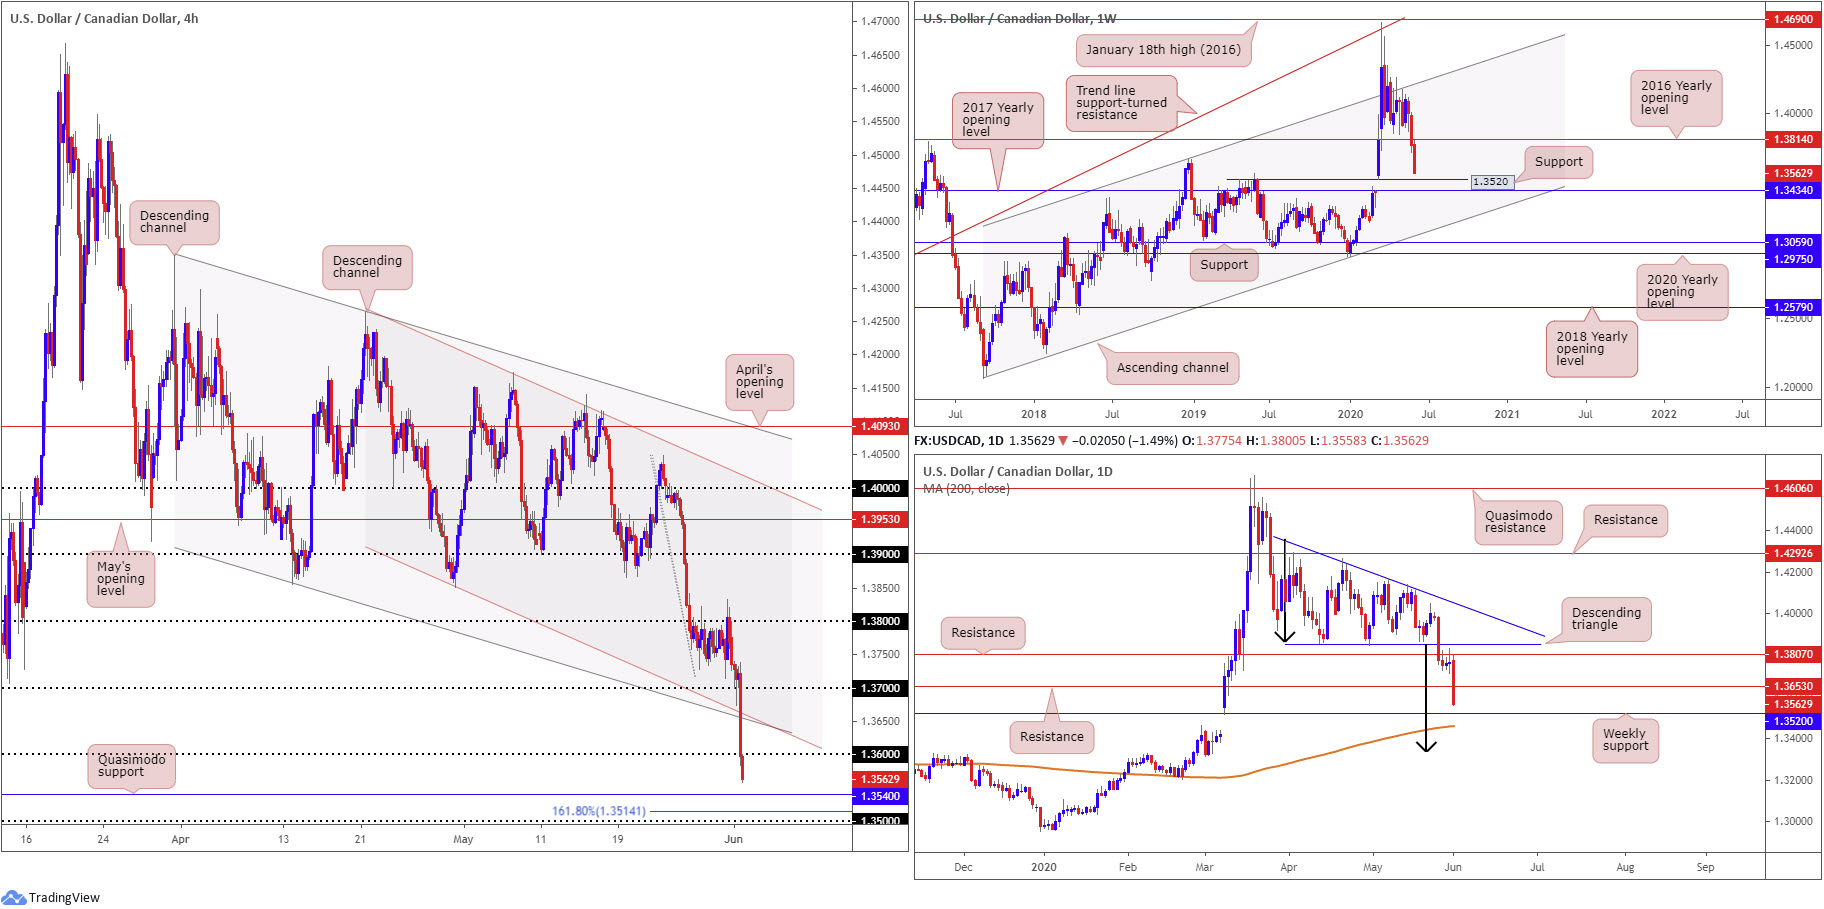
Led by broad USD losses, USD/CAD sunk to levels not seen since March 9 on Monday, down 1.50% in the shape of a near-full-bodied daily bearish candle.
Technically, H4 action overthrew 1.37, two channel supports, taken from lows 1.3855 and 1.3850, and in recent hours the 1.36 handle. This has revealed possible support in the shape of a Quasimodo formation at 1.3540, closely connected with a 161.8% Fibonacci extension point at 1.3514 and the 1.35 handle.
Further out on the weekly timeframe, after engulfing the 2016 yearly opening level at 1.3814, price appears poised to approach support at 1.3520 (prior Quasimodo resistance level), a base sited just above the 2017 yearly opening level at 1.3434.
The story on the daily timeframe shows, since April, price action has been carving out a descending triangle pattern between 1.4349 and 1.3855, with last Tuesday breaking out to the downside in impressive fashion and also taking on nearby support at 1.3807, which served well as resistance Friday. Monday swung through support at 1.3653, consequently highlighting weekly support mentioned above at 1.3520. Under here we also have the 200-day SMA (1.3459) as well as the descending triangle’s take-profit base at 1.3332 (black arrows) on the radar.
Areas of consideration:
For traders who read Monday’s technical briefing you may recall the following (italics):
Assuming buyers take a back seat at the 2016 yearly opening level drawn from 1.3814, sellers may remain in the driving seat this week.
The retest at 1.38 as resistance could be sufficient to tempt sellers towards 1.37, as well as the two H4 channel supports, taken from lows 1.3855 and 1.3850.
Beyond H4 targets, daily support at 1.3653 warrants attention.
Well done to any readers who managed to short sub 1.38.
Going forward, technical action emphasises the possibility of a recovery off weekly support at 1.3520, joined closely with H4 Quasimodo support at 1.3540, a 161.8% H4 Fibonacci extension point at 1.3514 and the 1.35 handle.
USD/CHF:
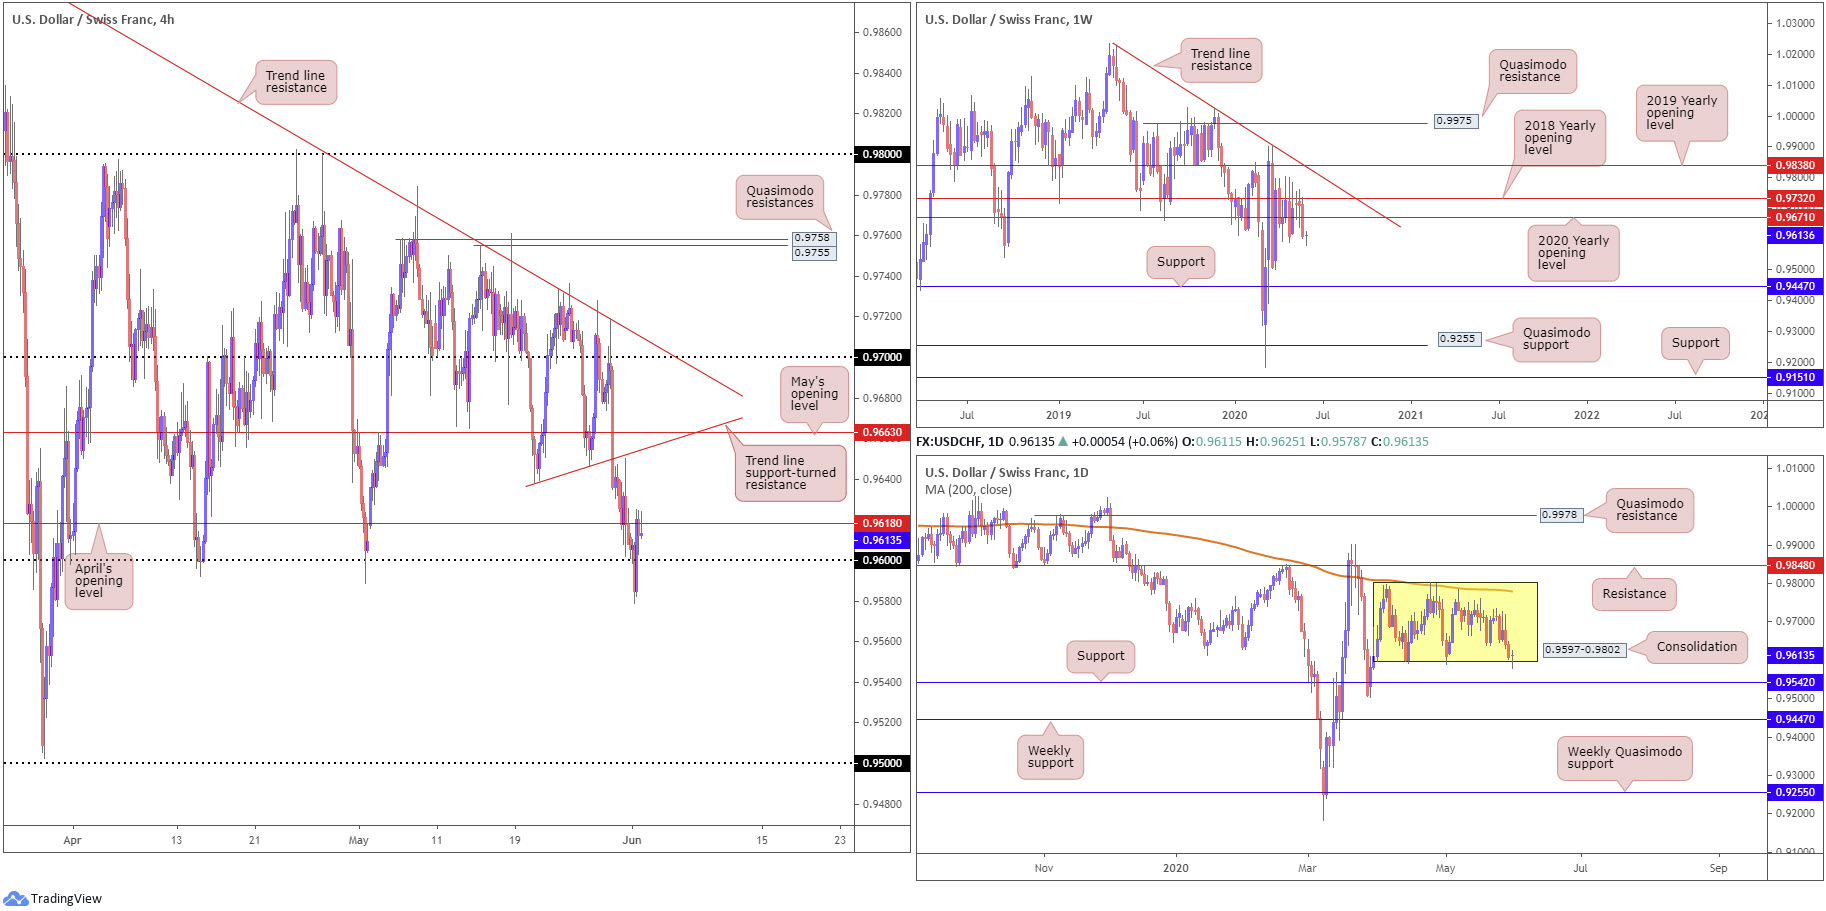
Monday witnessed a clear-cut bear trap form on the H4 timeframe, running through orders at the 0.96 handle to lows at 0.9579. Not only did this move trap breakout sellers, it also filled a large portion of protective stop-loss orders from buyers fading 0.96. As of writing, however, upside is contained by April’s opening level at 0.9618. Should buyers keep their head above water (0.96), there’s potential for further upside north of 0.9618 towards May’s opening level at 0.9663 and a local trend line support-turned resistance, taken from the low 0.9638. In the event we turn lower and retake 0.96, daily support is seen at 0.9542 and then the 0.95 handle on the H4.
Moving things across to the weekly timeframe, last week observed a vigorous push to the downside, a move which ran through the 2020 yearly opening level at 0.9671, after failing to close above nearby resistance at 0.9732, the 2018 yearly opening level. Should we remain starved of support, this could eventually draw the candles to a point of support at 0.9447.
Since early April, price action on the daily timeframe has consolidated between 0.9802/0.9597, with Monday shaking hands with the lower boundary of the range and closing strongly off worst levels. Traders may also want to acknowledge the 200-day SMA (orange – 0.9779) joins the upper border of the aforementioned consolidation. Outside, traders will note resistance rests at 0.9848 and support from 0.9542.
Areas of consideration:
The broader focus, thanks to weekly price unseating the 2020 yearly opening level at 0.9671, places sellers in the brighter light. However, before sellers can stretch their legs, engulfing 0.96 on the H4 and daily range lows at 0.9597 is required. Bearish strategies under 0.96, therefore, remain a consideration. Conservative players may opt to wait for a retest at 0.96ish before engaging. This helps avoid a fakeout scenario, similar to the one seen yesterday.
On the other hand, a H4 close back above April’s opening level at 0.9618 could appeal to intraday buyers, targeting May’s opening level at 0.9663 as an initial target.
Dow Jones Industrial Average:
Major US benchmarks ended modestly higher across the board Monday. The Dow Jones Industrial Average climbed 91.91 points, or 0.36%; the S&P 500 added 11.42 points, or 0.38%, and the tech-heavy Nasdaq 100 concluded higher by 43.36 points, or 0.45%.
Technically, change was mild yesterday.
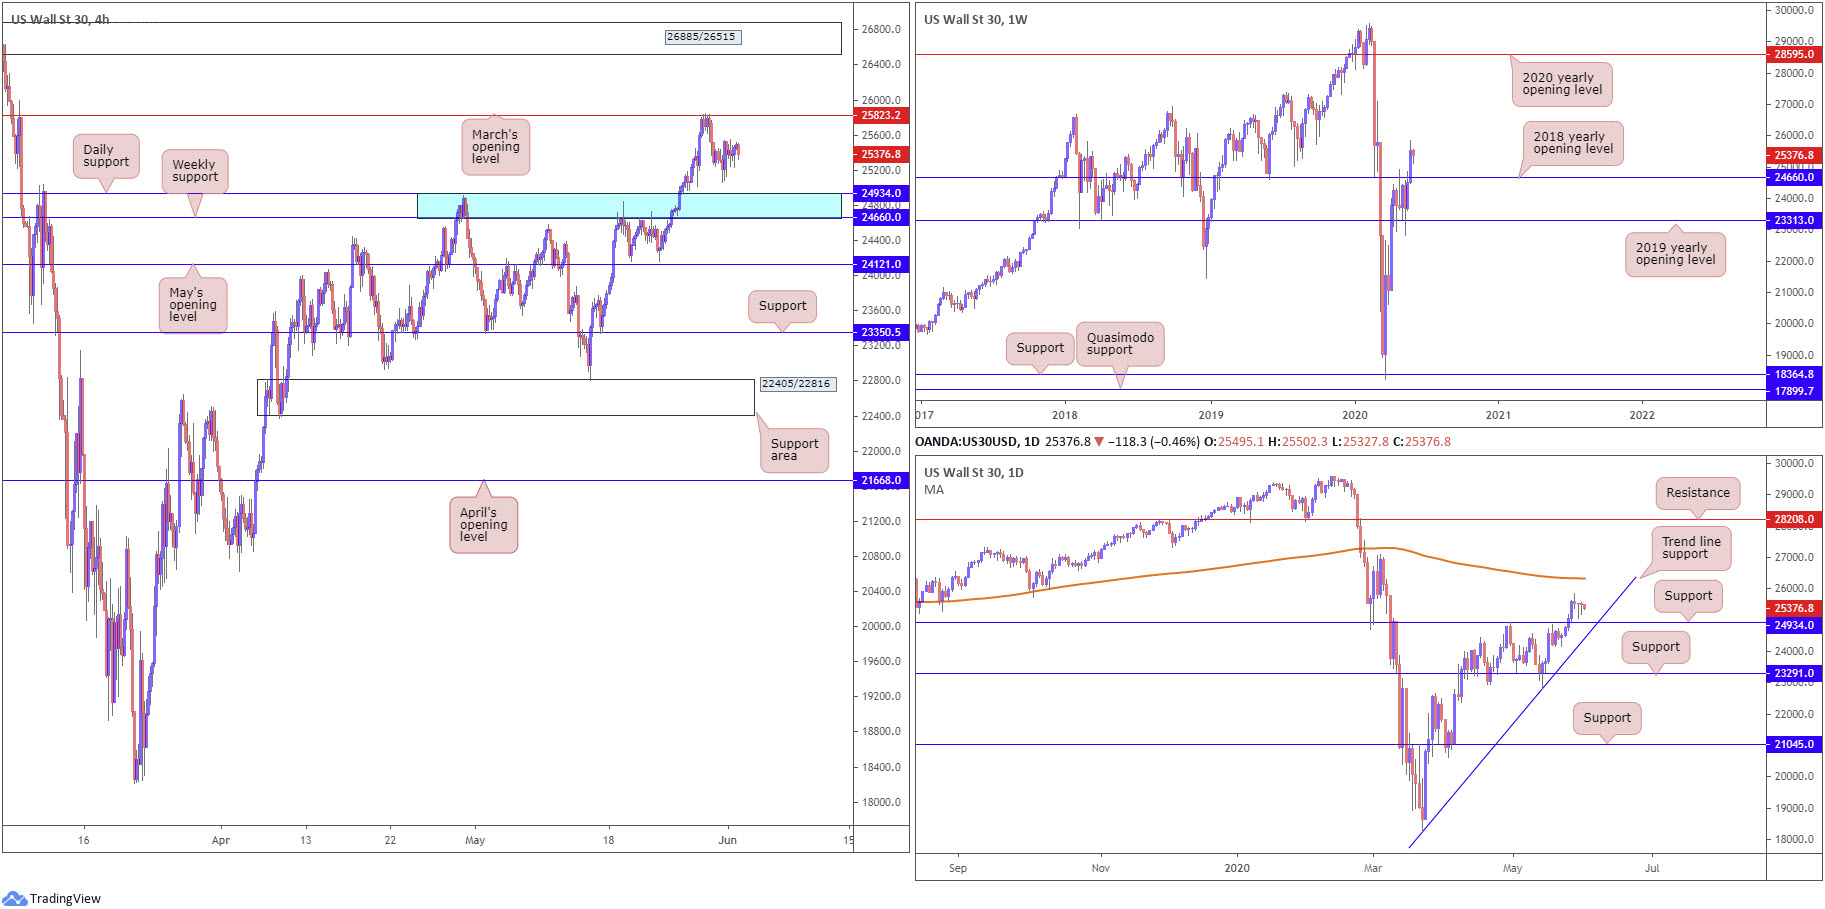
From the weekly timeframe, price, after buyers stepped in from the 2019 yearly opening level at 23313, has put up two near-full-bodied weekly bullish candles, a move that conquered the 2018 yearly opening level at 24660 and reached a weekly peak at 25846. Sustained upside could eventually have the 2020 yearly opening level at 28595 emerge.
A closer reading of price action on the daily timeframe has the unit holding north of support at 24934.
Interestingly, Both Friday and Monday formed back-to-back hammer candlestick patterns. The 200-day SMA (orange – 26328) is seen as the next upside target.
After overwhelming orders at a resistance zone plotted between 24934/24660 on the H4 timeframe, an area comprised of a daily support level at 24934 and the 2018 yearly opening level on the weekly timeframe at 24660 (blue), March’s opening level at 25823 made an appearance last Thursday. This guided the candles to lows at 25058 Friday before staging a mild comeback into the close.
Areas of consideration:
24934/24660, now representing support, is in position for a possible retest play on the H4 timeframe, with particular emphasis placed on daily trend line support, extended from the low 18213.
Having seen both weekly and daily price in position to climb this week, it’s unlikely we’ll see much selling occur off March’s opening level at 25823 on the H4 timeframe. Buying north of the level, therefore, could be an option, targeting a resistance area at 26885/26515, a zone located just above the 200-day SMA.
XAU/USD (GOLD):
Although the greenback entered the week on the defensive, upbeat risk sentiment limited bullion’s upside.
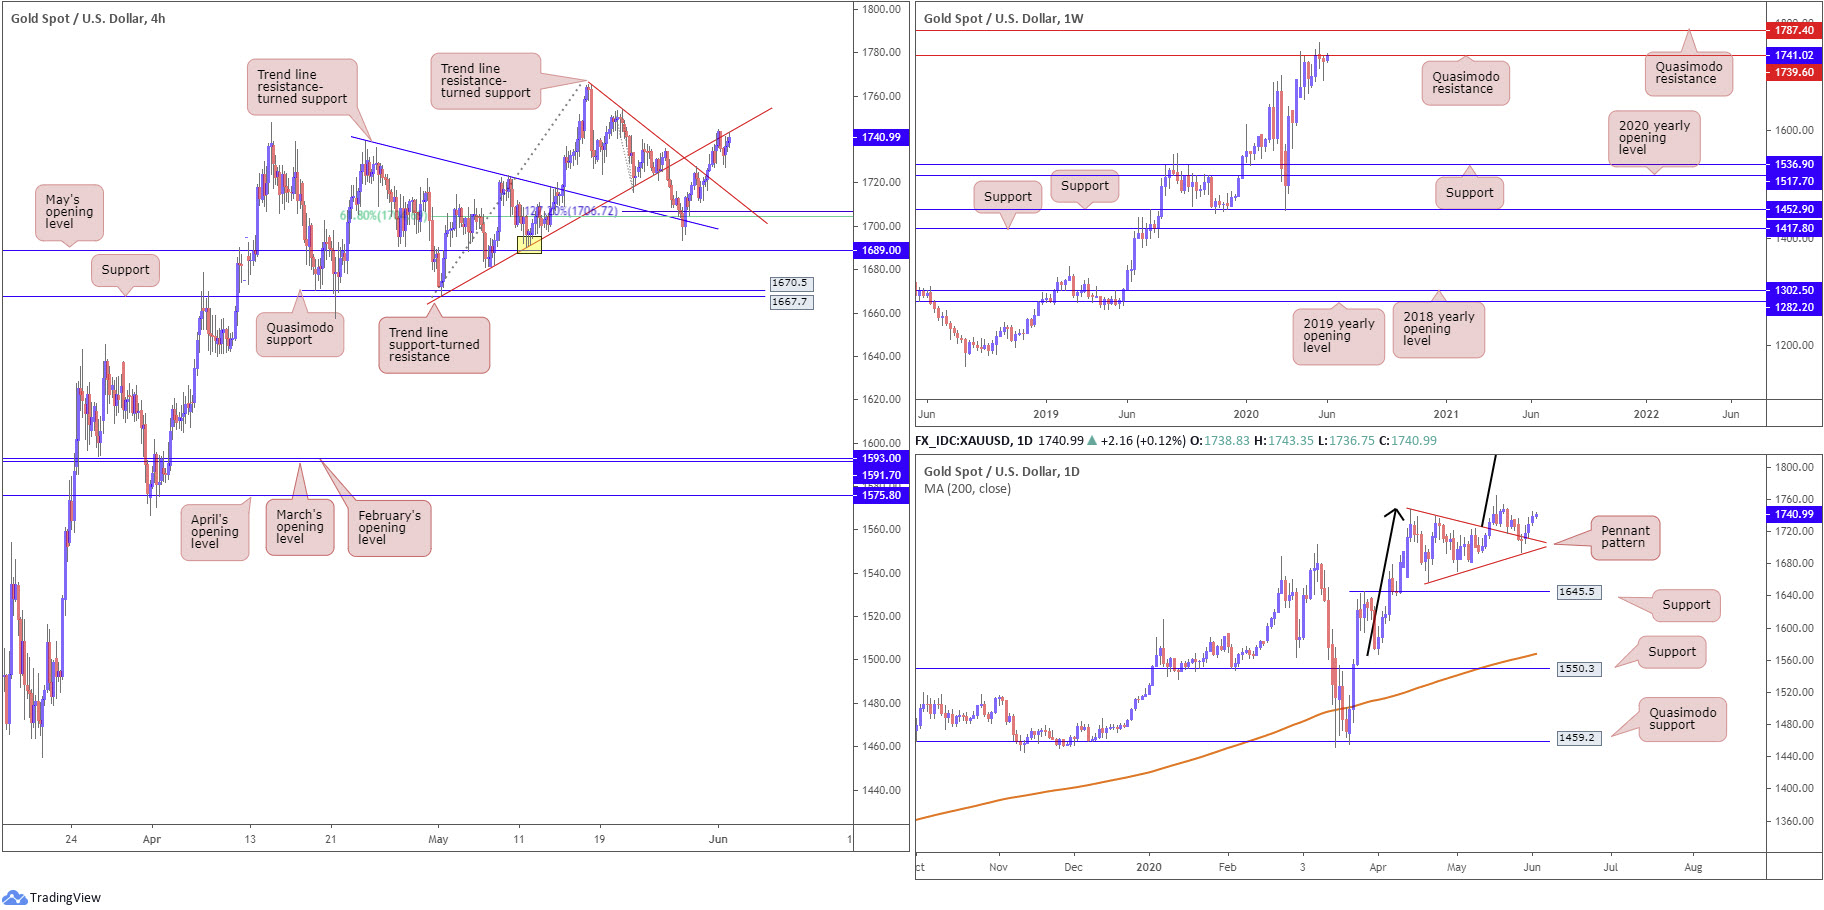
Technical action has weekly price crossing swords with Quasimodo resistance at 1739.6, a level that’s capped upside from mid-April. Should clearance of 1739.6 take shape, this will underline another layer of Quasimodo resistance at 1787.4. It may also interest some traders to note the trend on gold has faced a northerly trajectory since 2016.
The bullish pennant configuration on the daily timeframe, established from a high of 1747.7 and a low coming in from 1658.1, remains in play. Last week had price retest the pattern’s upper edge as support. Though dipping to lows at 1693.9, buyers are seen attempting to make a comeback here, with bullion registering its third consecutive daily gain on Monday. Take-profit targets out of pennant patterns are measured by taking the preceding move and adding the value to the breakout point (black arrows). This offers a sizeable take-profit, coming in at 1909.4.
As evident from the H4 chart, we have crossed through H4 trend line resistance from 1765.1 and tested trend line support-turned resistance, taken from the low 1668.0. This is an interesting trend line as it merges with the weekly Quasimodo resistance at 1739.6.
Areas of consideration:
Traders long above the H4 trend line resistance (1765.1) have likely reduced risk to breakeven at the next layer of H4 trend line resistance (1668.0).
It would not be a surprise to see sellers make a dominant showing at current price, having weekly action testing Quasimodo resistance at 1739.6. Though, at the same time, we also have a daily bullish pennant in motion, too.
Fresh buyers will likely commit this week should we print a daily close above weekly Quasimodo resistance at 1739.6, targeting weekly Quasimodo resistance at 1787.4.
The accuracy, completeness and timeliness of the information contained on this site cannot be guaranteed. IC Markets does not warranty, guarantee or make any representations, or assume any liability regarding financial results based on the use of the information in the site.
News, views, opinions, recommendations and other information obtained from sources outside of www.icmarkets.com.au, used in this site are believed to be reliable, but we cannot guarantee their accuracy or completeness. All such information is subject to change at any time without notice. IC Markets assumes no responsibility for the content of any linked site.
The fact that such links may exist does not indicate approval or endorsement of any material contained on any linked site. IC Markets is not liable for any harm caused by the transmission, through accessing the services or information on this site, of a computer virus, or other computer code or programming device that might be used to access, delete, damage, disable, disrupt or otherwise impede in any manner, the operation of the site or of any user’s software, hardware, data or property.


