
DXY:
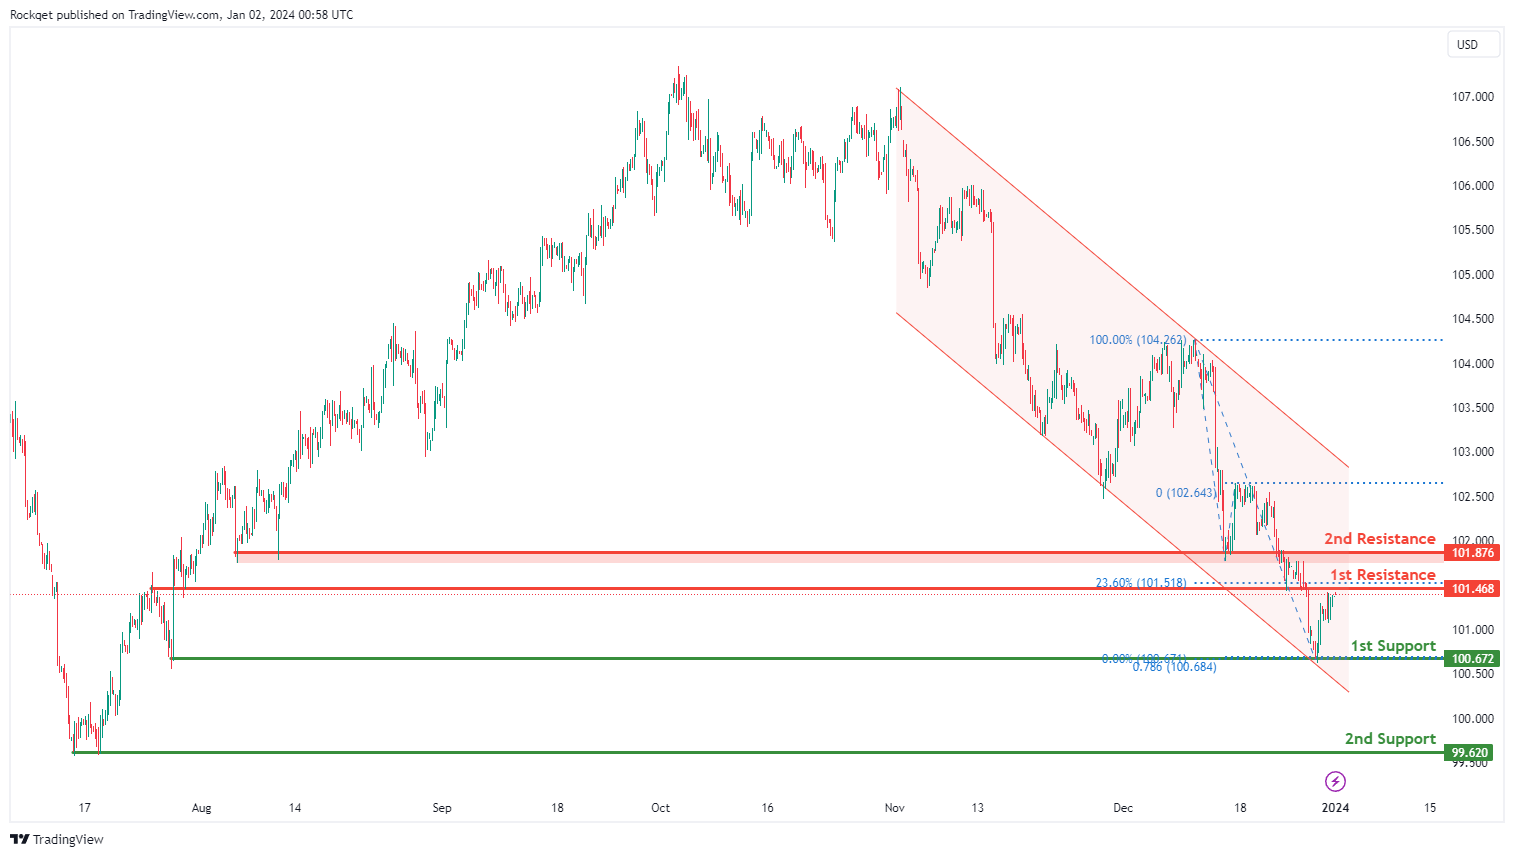
The DXY (US Dollar Index) chart currently shows an overall bearish momentum. However, there is a potential for price to make a bullish rise towards the 1st resistance.
The 1st resistance level at 101.46 is identified as an overlap resistance that aligns with the 23.60% Fibonacci retracement level. Higher up, the 2nd resistance level at 101.87 is also marked as an overlap resistance, suggesting a potential barrier for further upside movement.
To the downside, the 1st support level at 100.67 is identified as a swing-low support that aligns with the 78.60% Fibonacci projection level. Further below, the 2nd support level at 99.62 is noted as pullback support, further reinforcing its importance as a potential key support level.
EUR/USD:
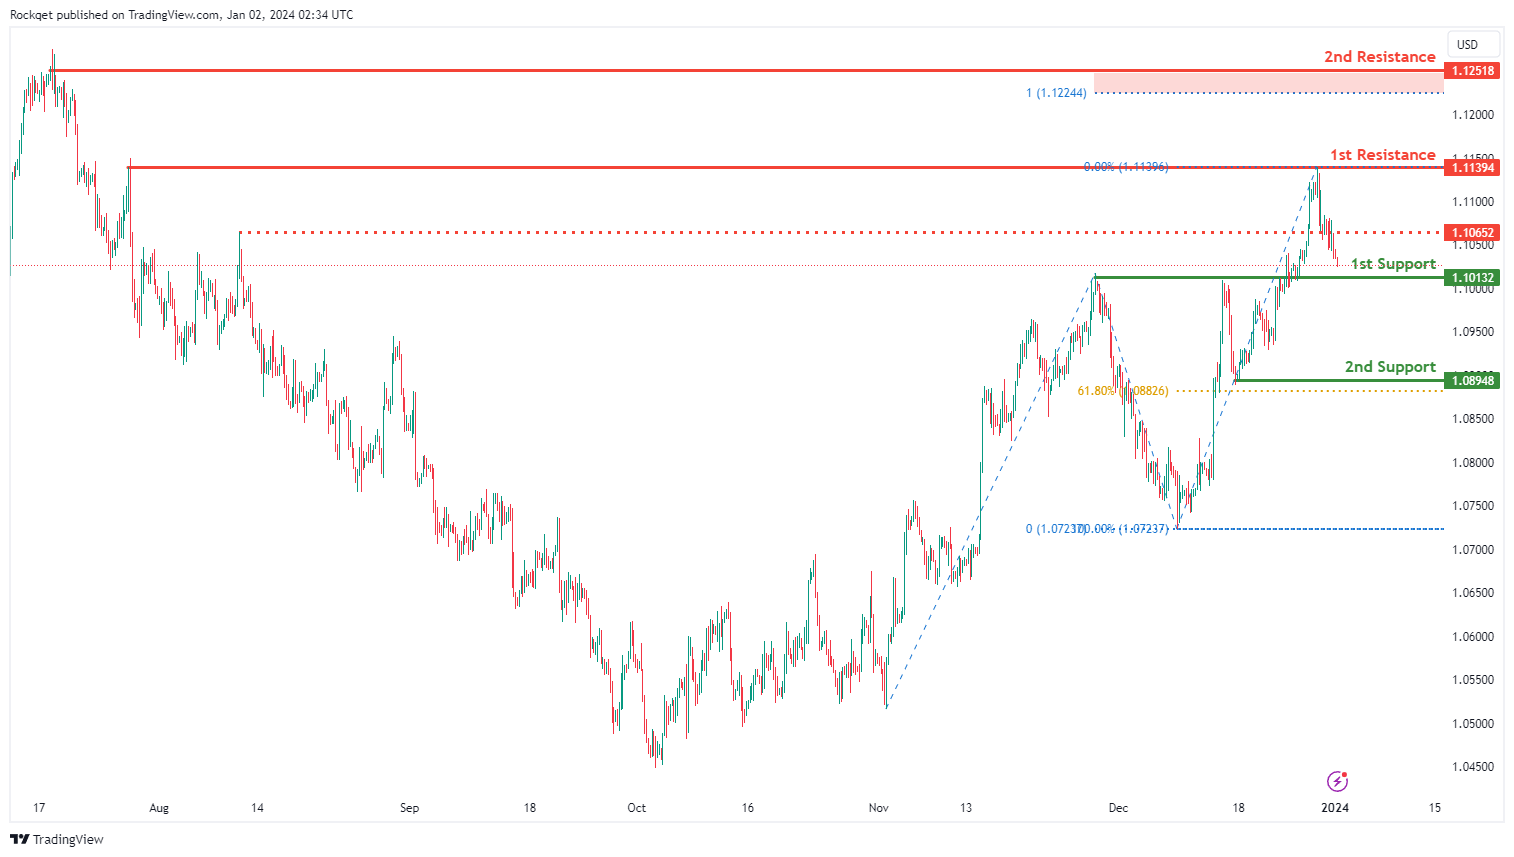
The EUR/USD chart currently exhibits an overall bullish momentum. However, there is a potential scenario for price to drop towards the 1st support and make a bullish bounce off this level.
The 1st support level at 1.1013 is identified as an overlap support. Further below, the 2nd support level at 1.0894 is marked as a pullback support that aligns with the 61.80% Fibonacci retracement level, further reinforcing its importance as a potential key support level.
To the upside, the intermediate resistance level at 1.1065 is identified as a pullback resistance while the 1st resistance level at 1.1139 is noted as a multi-swing-high resistance. Higher up, the 2nd resistance level at 1.1251 is marked as a swing-high resistance that aligns close to the 100.00% Fibonacci projection level, suggesting a potential barrier for further upside movement.
EUR/JPY:
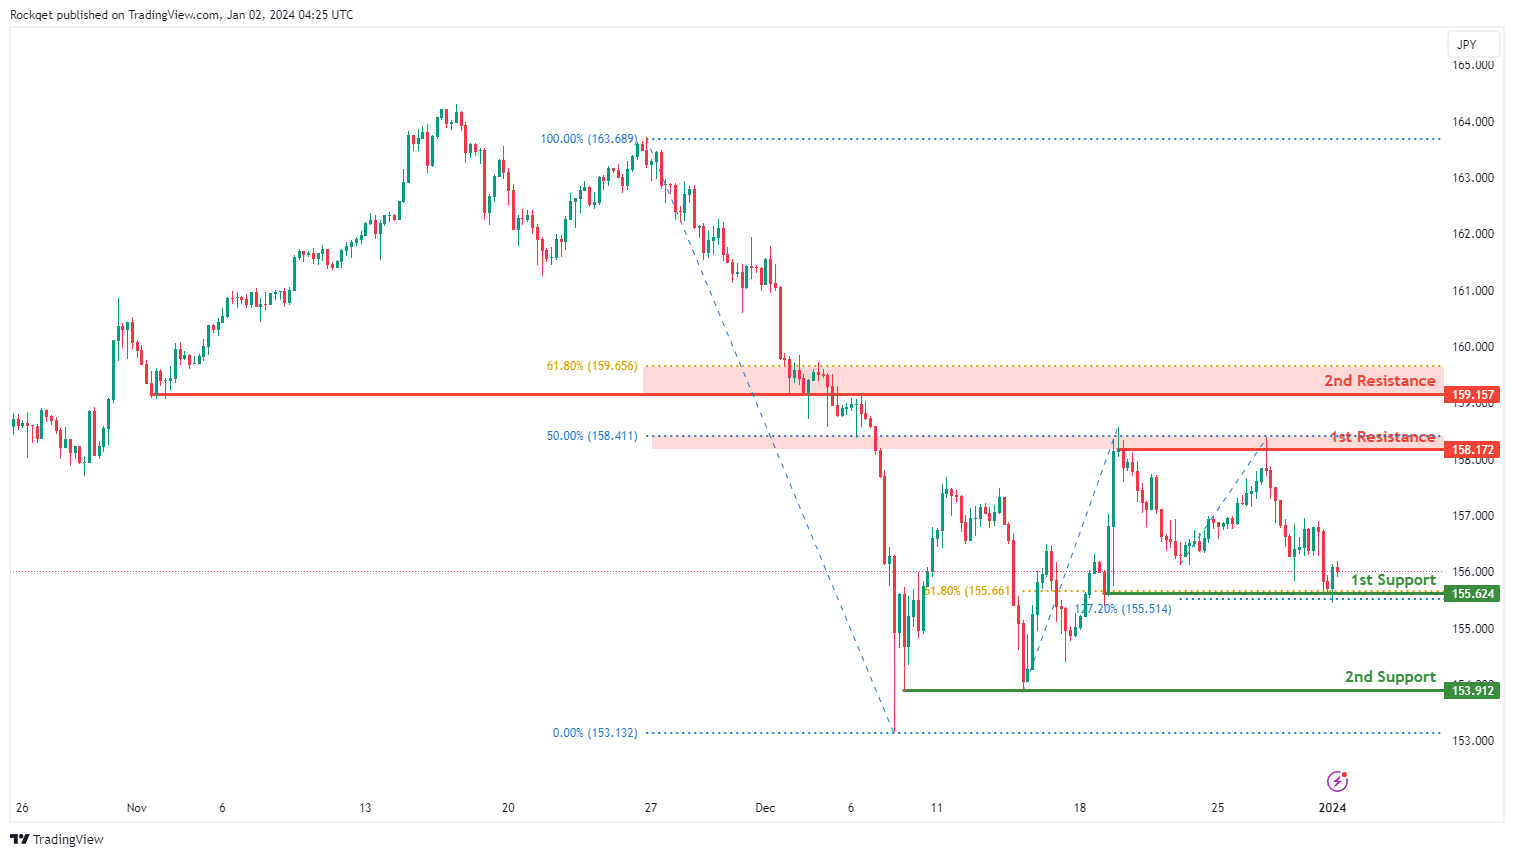
The EUR/JPY chart currently displays a neutral bias. In this context, there is a potential scenario for price to fluctuate between the 1st resistance and the 1st support.
The 1st support at 155.62 is considered as a pullback support that aligns with the 61.80% Fibonacci retracement level. Additionally, the 2nd support at 153.91 is identified as a multi-swing low support, providing an additional layer of potential support.
On the resistance side, the 1st resistance at 158.17 is linked to a pullback resistance that aligns with the 50.00% Fibonacci retracement level. Furthermore, the 2nd resistance at 159.15 is associated with an overlap resistance that aligns with the 61.80% Fibonacci retracement level, adding an extra layer of potential resistance.
EUR/GBP:
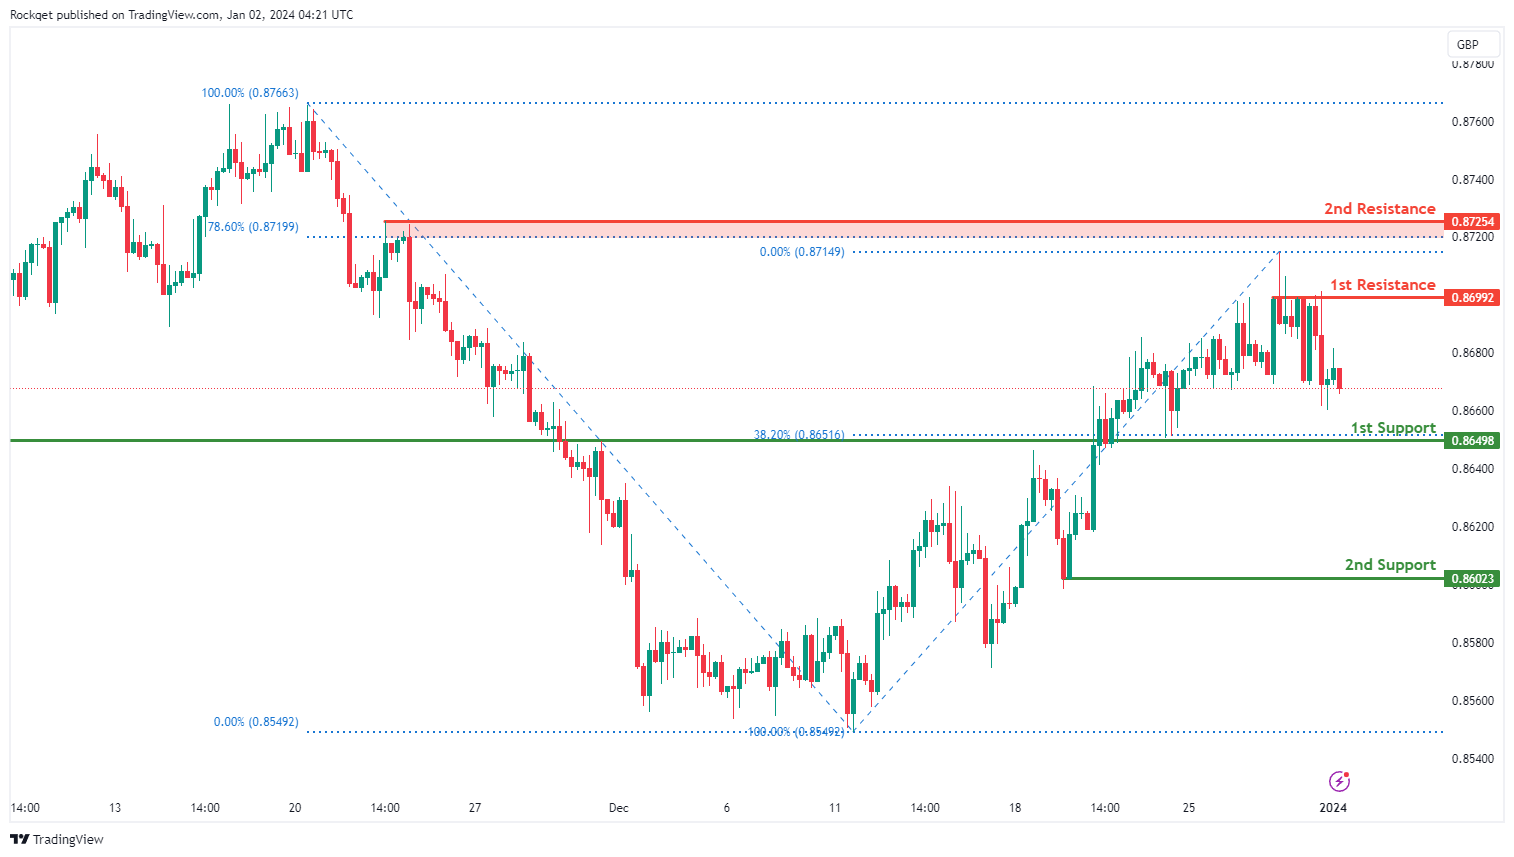
The EUR/GBP chart currently exhibits an overall bearish momentum. In this context, there is a potential scenario for price to make a bearish continuation towards the 1st support.
The 1st support at 0.8649 is considered an overlap support that aligns with the 38.20% Fibonacci retracement level. Additionally, the 2nd support at 0.8602 is identified as a pullback support.
On the resistance side, the 1st resistance at 0.8699 is linked to a pullback resistance. Furthermore, the 2nd resistance at 0.8725 also represents a pullback resistance that aligns with the 78.60% Fibonacci retracement level, suggesting a level where selling interest could intensify.
GBP/USD:
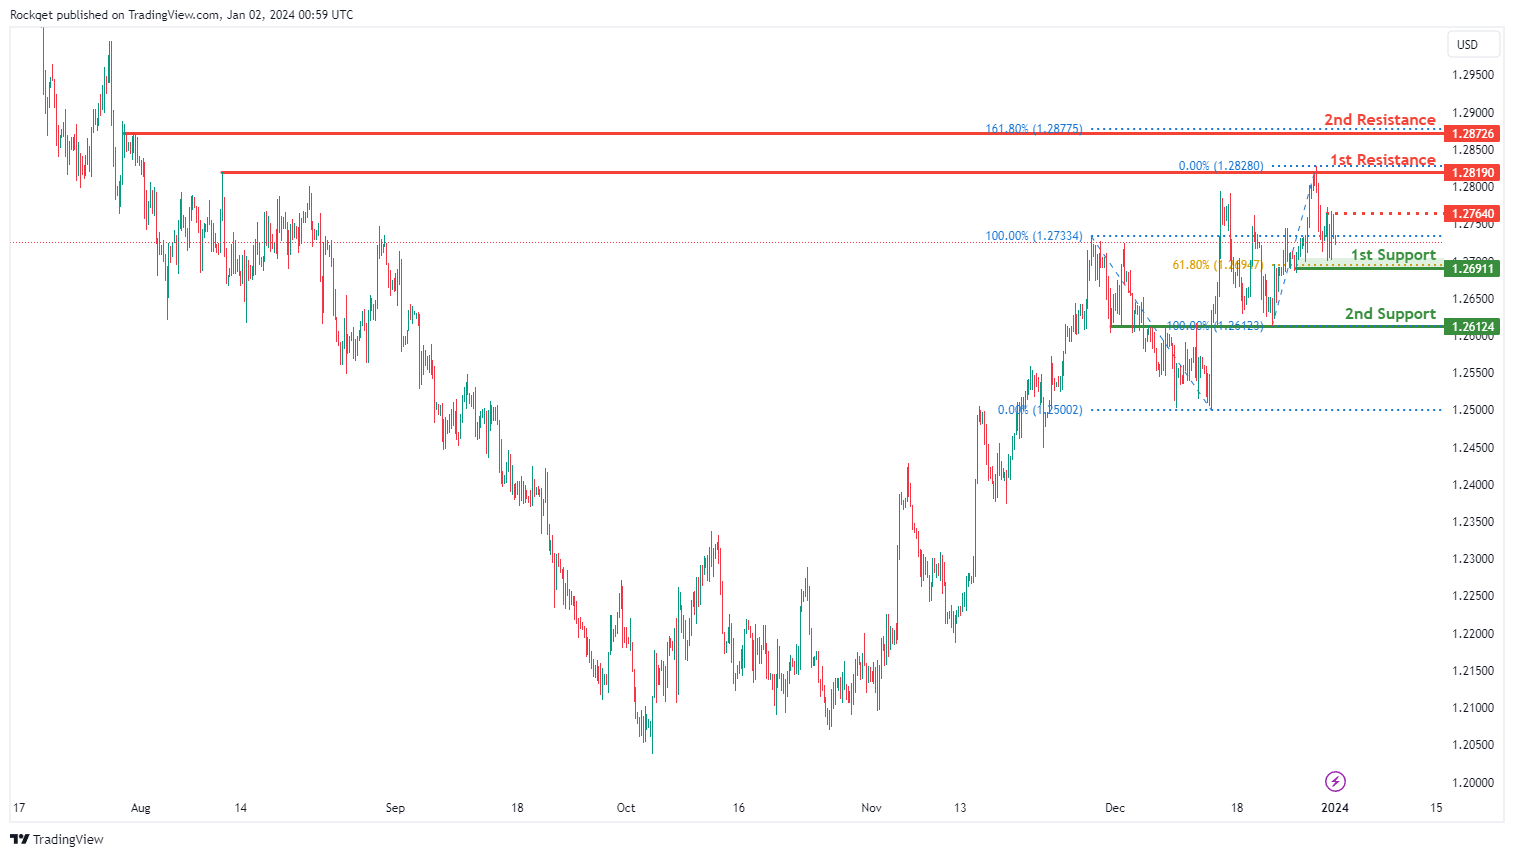
The GBP/USD chart currently exhibits a neutral bias. In this context, there is a potential scenario for price to fluctuate between the 1st resistance and the 1st support.
The intermediate resistance level at 1.2764 is identified as a pullback resistance while the 1st resistance level at 1.2819 is marked as a pullback resistance. Higher up, the 2nd resistance level at 1.2872 is also noted as a pullback resistance that aligns with the 161.80% Fibonacci extension level, suggesting a potential barrier for further upside movement.
To the downside, the 1st support level at 1.2691 is identified as a pullback support that aligns with the 61.80% Fibonacci retracement level. Further below, the 2nd support level at 1.2612 is noted as an overlap support, further reinforcing its importance as a potential key support level.
GBP/JPY:
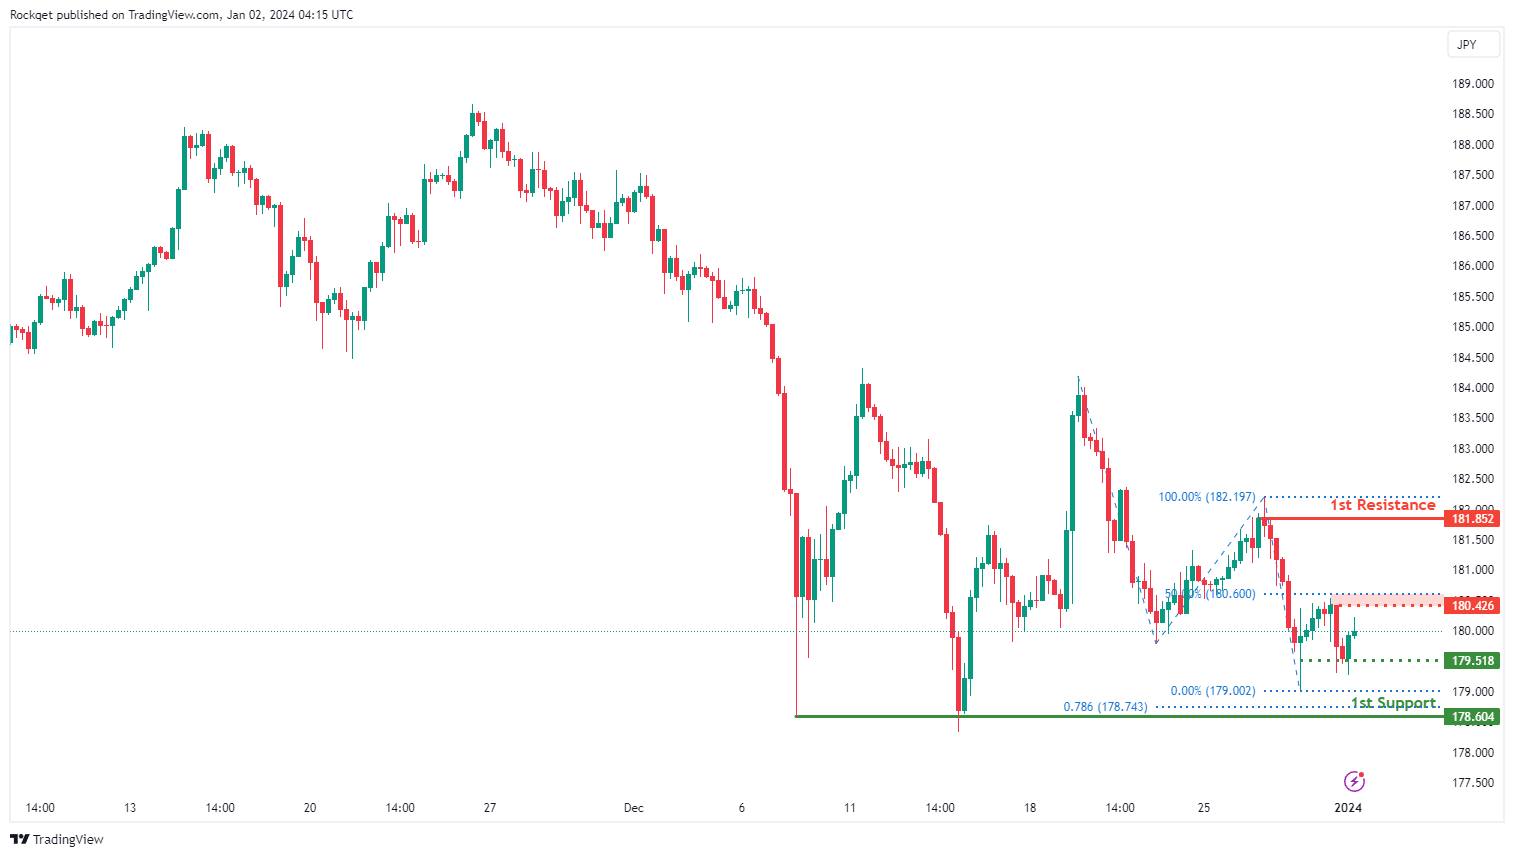
The GBP/JPY chart currently exhibits a neutral bias, suggesting a potential scenario for price to fluctuate between the intermediate resistance and the intermediate support.
The intermediate support at 179.51 is considered as a pullback low support. Additionally, the 1st support at 178.60 is identified as a multi-swing low support, providing an additional layer of potential support for the currency pair.
On the resistance side, the intermediate resistance at 180.42 is associated with a pullback resistance that aligns close to the 50.00% Fibonacci retracement level. Furthermore, the 1st resistance at 181.85 also represents a pullback resistance, indicating a level where selling interest could intensify.
USD/CHF:
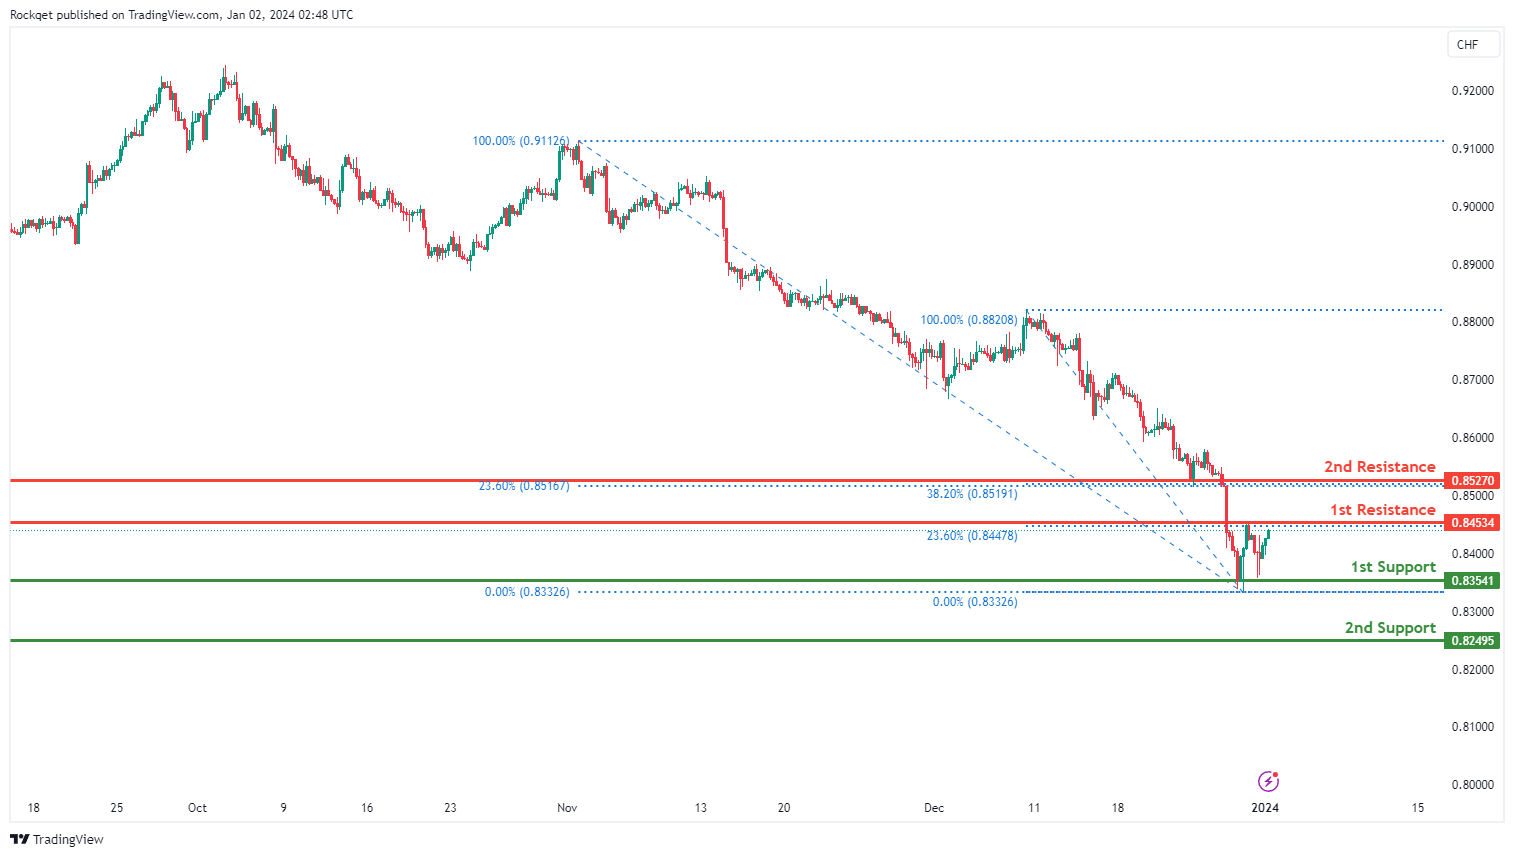
The USD/CHF chart currently exhibits an overall bearish momentum. However, there is a potential scenario for price to rise towards the 1st resistance.
The 1st resistance level at 0.8453 is identified as a pullback resistance that aligns with the 23.60% Fibonacci retracement level. Higher up, the 2nd resistance level at 0.8527 is also also marked as a pullback resistance that aligns with a confluence of Fibonacci levels i.e. the 23.60 and the 38.20% Fibonacci retracement levels, suggesting a potential barrier for further upside movement.
To the downside, the 1st support level at 0.8354 is identified as a pullback support. Further below, the 2nd support level at 0.8249 is noted as a pullback support, further reinforcing its importance as a key support level.
USD/JPY:
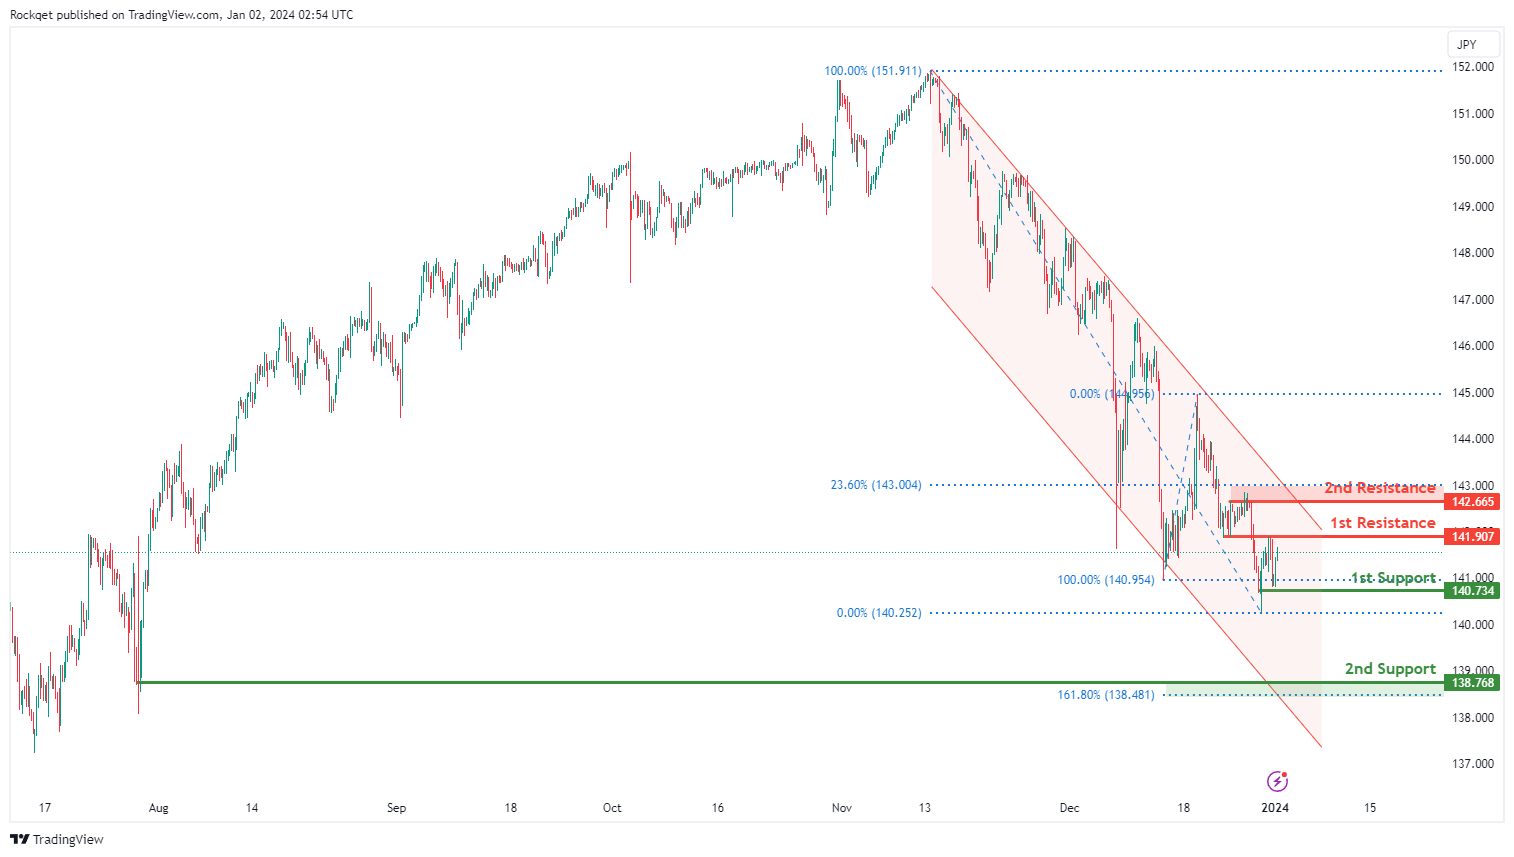
The USD/JPY chart currently exhibits an overall bearish momentum. However, there is a potential for price to rise towards the 1st resistance.
The 1st resistance level at 141.90 is identified as an overlap resistance. Higher up, the 2nd resistance level at 142.66 is marked as a pullback resistance that aligns close to the 23.60% Fibonacci retracement level, suggesting a potential barrier for further upside movement.
To the downside, the 1st support level at 140.73 is identified as a pullback support. Further below, the 2nd support level at 138.76 is noted as a swing-low support that aligns close to the 161.80% Fibonacci extension level, further reinforcing its importance as a key support level.
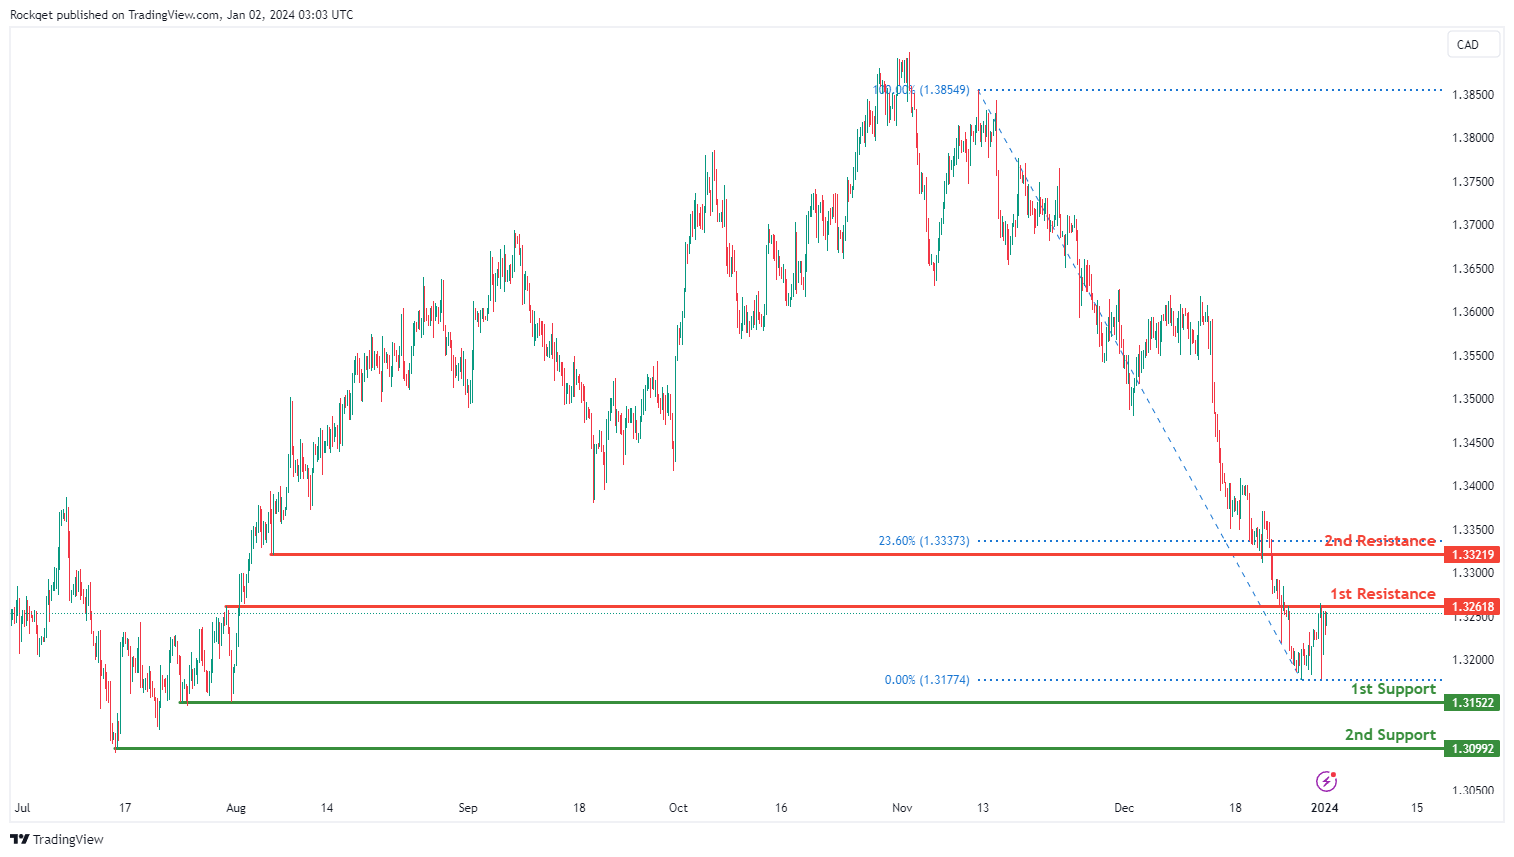
USD/CAD:
The USD/CAD chart currently exhibits an overall bearish momentum. In this context, there is a potential scenario for price to make a bearish reversal off the 1st resistance and drop towards the 1st support.
The 1st resistance level at 1.3261 is identified as an overlap resistance. Higher up, the 2nd resistance level at 1.3321 is marked as a pullback resistance that aligns with the 2360% Fibonacci retracement level, suggesting a potential barrier for further upside movement.
To the downside, the 1st support level at 1.3152 is identified as a pullback support. Further below, the 2nd support level at 1.3099 is noted as a swing-low support, further reinforcing its importance as a key support level.
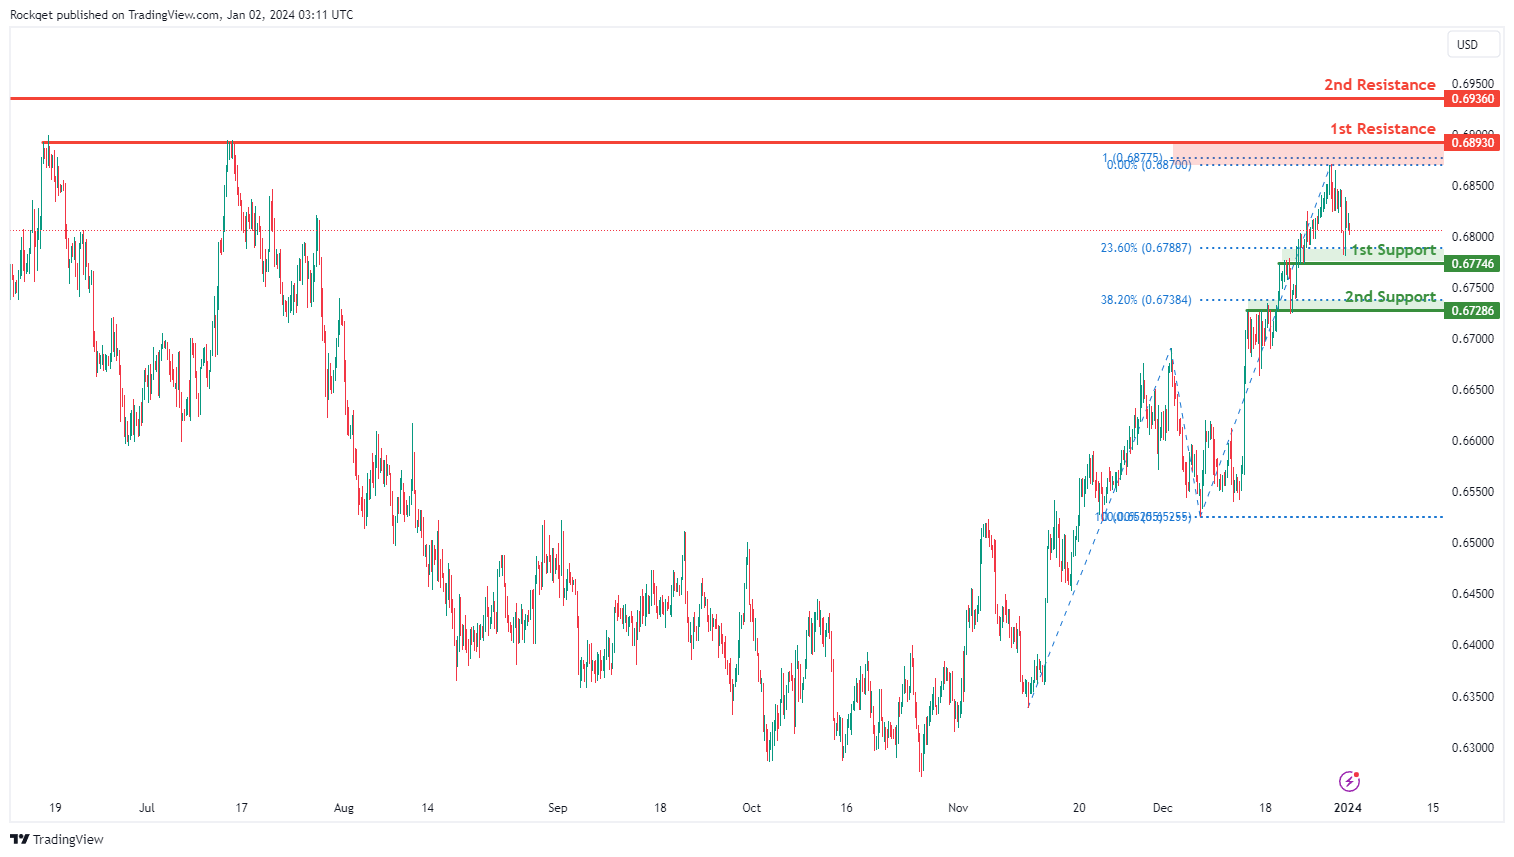
AUD/USD:
The AUD/USD chart currently exhibits an overall bullish momentum. However, there is a potential scenario for price to drop towards the 1st support,
The 1st support level at 0.6774 is identified as an overlap support that aligns close to the 23.60 Fibonacci retracement level. Further below, the 2nd support level at 0.6728 is also marked as an overlap support that aligns close to the 38.20 Fibonacci retracement level, further reinforcing its importance as a key support level.
To the upside, the 1st resistance level at 0.6893 is identified as a multi-swing-high resistance that aligns close to the 100.00% Fibonacci projection level. Higher up, the 2nd resistance level at 0.6936 is noted as a pullback resistance, indicating its potential significance as a barrier for further upward movement.
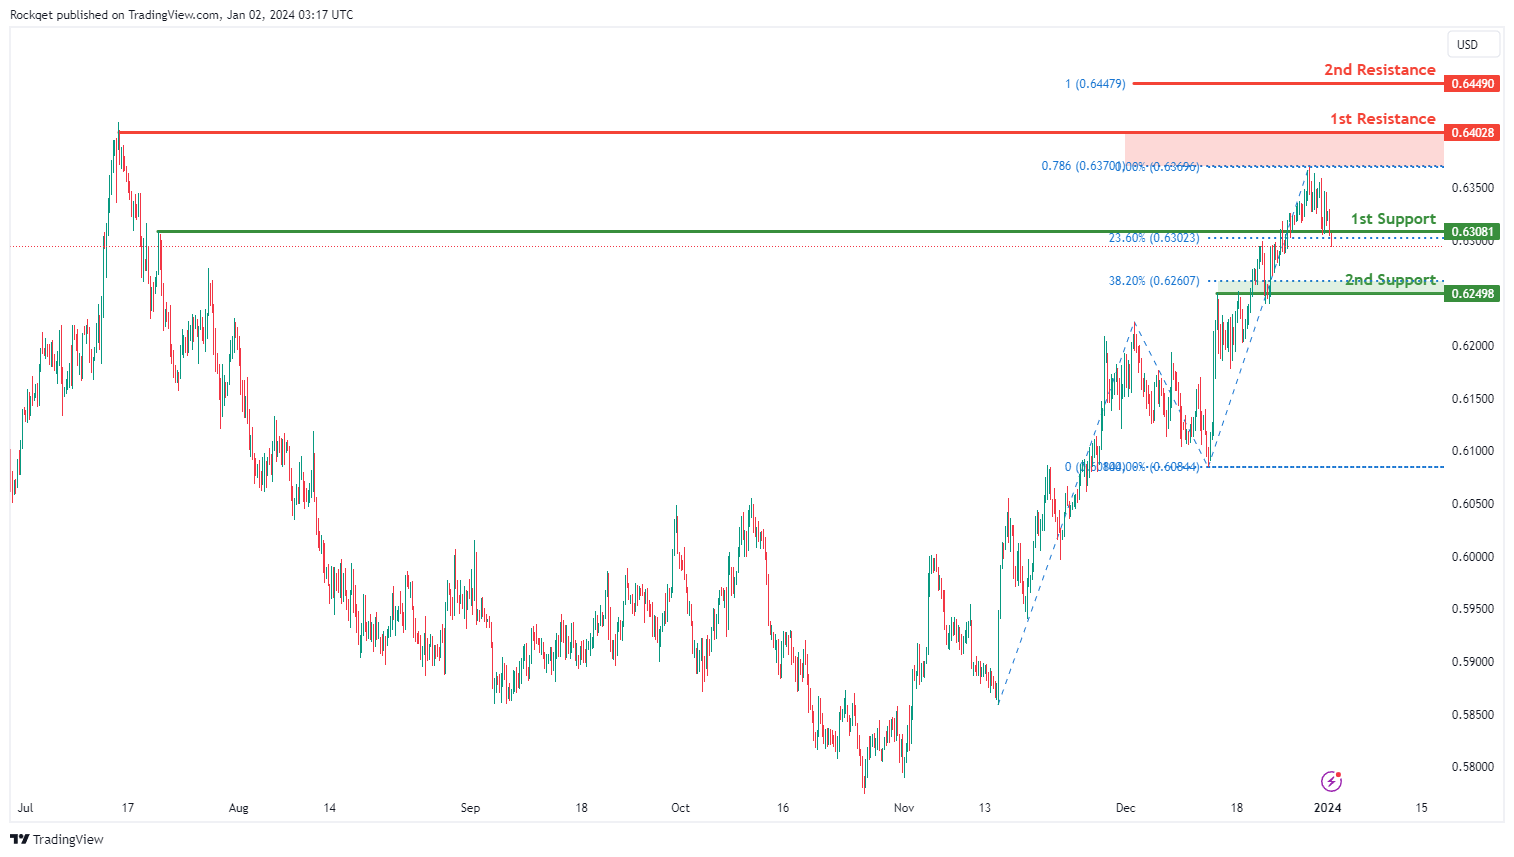
NZD/USD
The NZD/USD chart currently exhibits an overall bullish momentum. However, there is a potential scenario for price to break below the 1st support and fall towards the 2nd support to mark the start of a bearish downward trend.
The 1st support level at 0.6308 is identified as an overlap support that is close to the 23.60% Fibonacci retracement level. Further below, the 2nd support level at 0.6246 is also noted as an overlap support that is close to with the 38.20% Fibonacci retracement level, further reinforcing its importance as a key support level.
To the upside, the 1st resistance level at 0.6402 is identified as a swing-high resistance that aligns close to the 78.60% Fibonacci projection level. Higher up, the 2nd resistance level at 0.6449 is marked as a resistance that aligns with the 100.00% Fibonacci projection level, indicating its potential significance as a barrier for further upward movement.
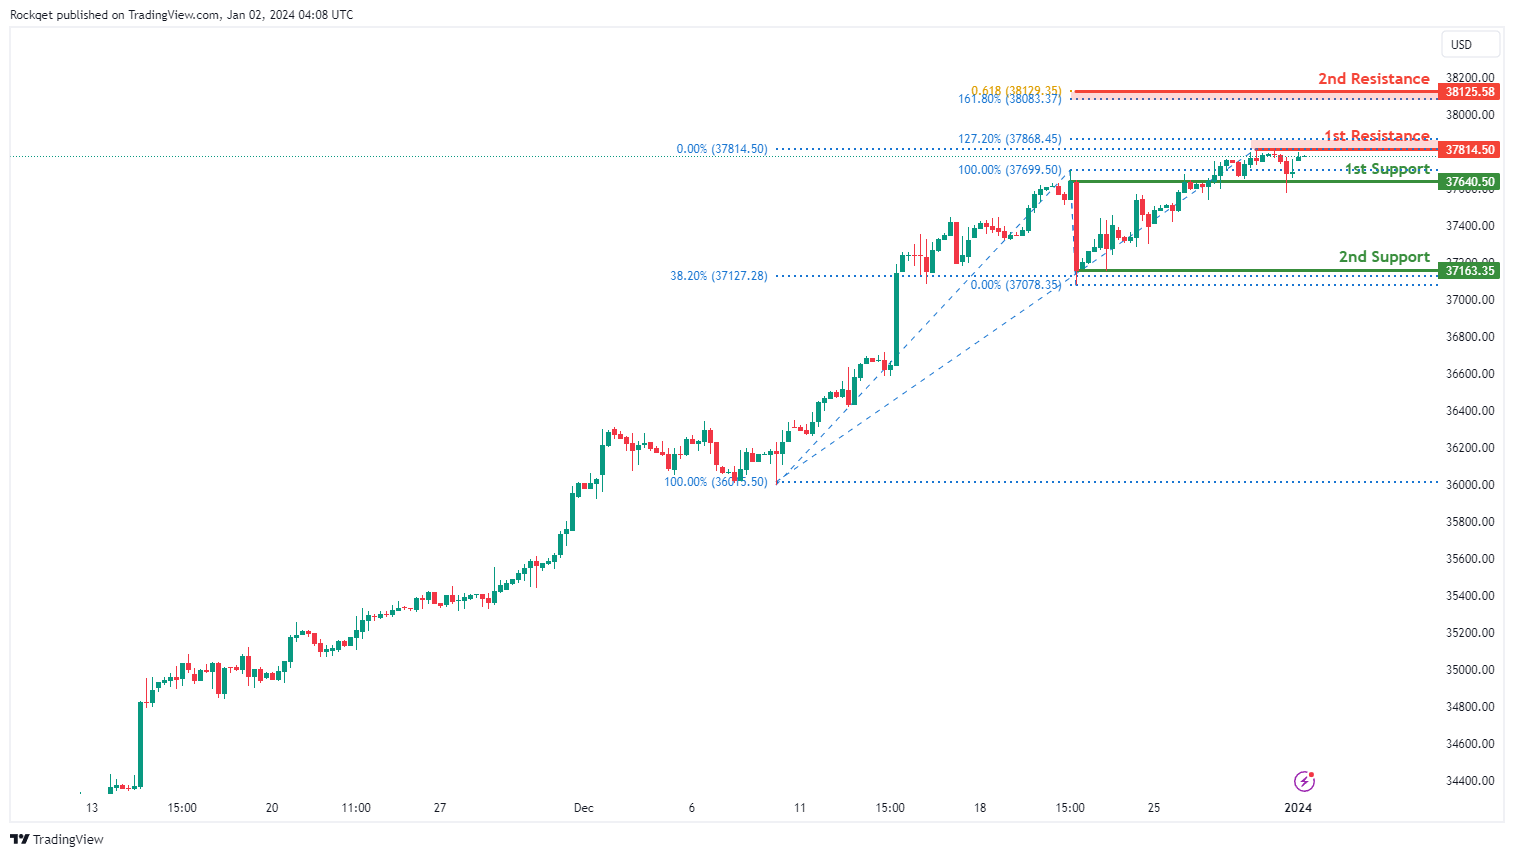
DJ30:
The DJ30 chart currently exhibits a bullish overall momentum. However, there is a potential for price to fluctuate between the 1st resistance and the 1st support.
The 1st resistance at 37,814.50 is associated with a pullback resistance that aligns with the 127.20% Fibonacci extension level. Furthermore, the 2nd resistance at 38,125.58 represents a resistance that aligns with a confluence of Fibonacci levels i.e. the 161.80% extension and the 61.80% projection levels, indicating a level where selling interest could intensify.
To the downside, the 1st support at 37,640.50 is considered as an overlap support. Additionally, the 2nd support at 37,163.35 is identified as a swing-low support that aligns with the 38.20% Fibonacci retracement level, providing an additional layer of potential support.
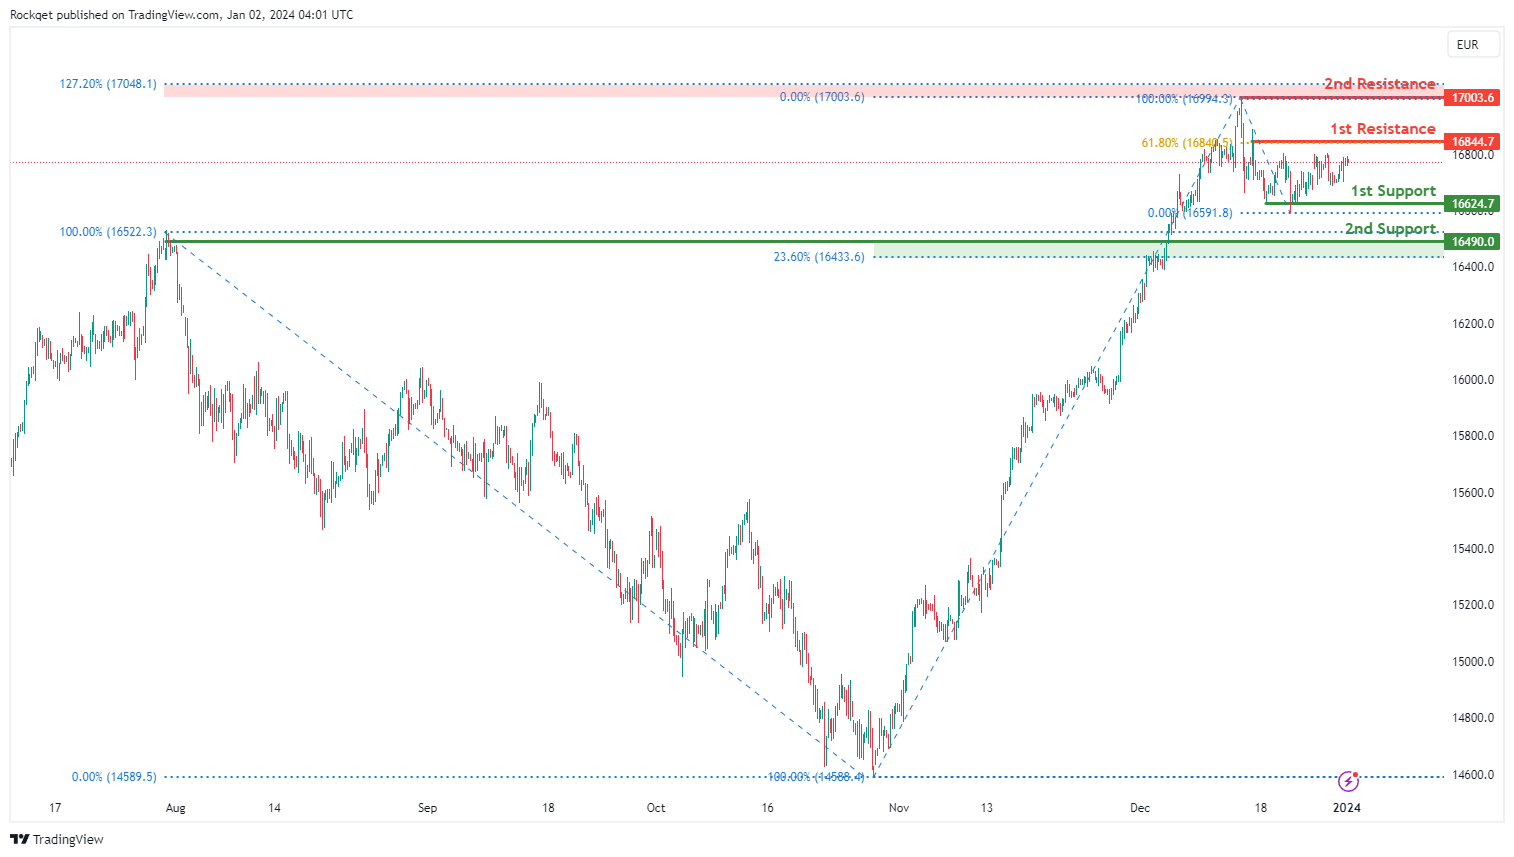
GER40:
The GER40 chart currently exhibits a bullish overall momentum. However, there is a potential for price to fluctuate between the 1st resistance and the 1st support.
The 1st resistance at 16,844.70 is associated with a pullback resistance that aligns with the 61.80% Fibonacci retracement level. Furthermore, the 2nd resistance at 17,003.60 represents a swing-high resistance that aligns with the 127.20% Fibonacci extension level, indicating a level where selling interest could intensify.
To the downside, the 1st support at 16,624.70 is considered as a pullback support. Additionally, the 2nd support at 16,490.00 is also identified as a pullback support that aligns with the 23.60% Fibonacci retracement level, providing an additional layer of potential support.
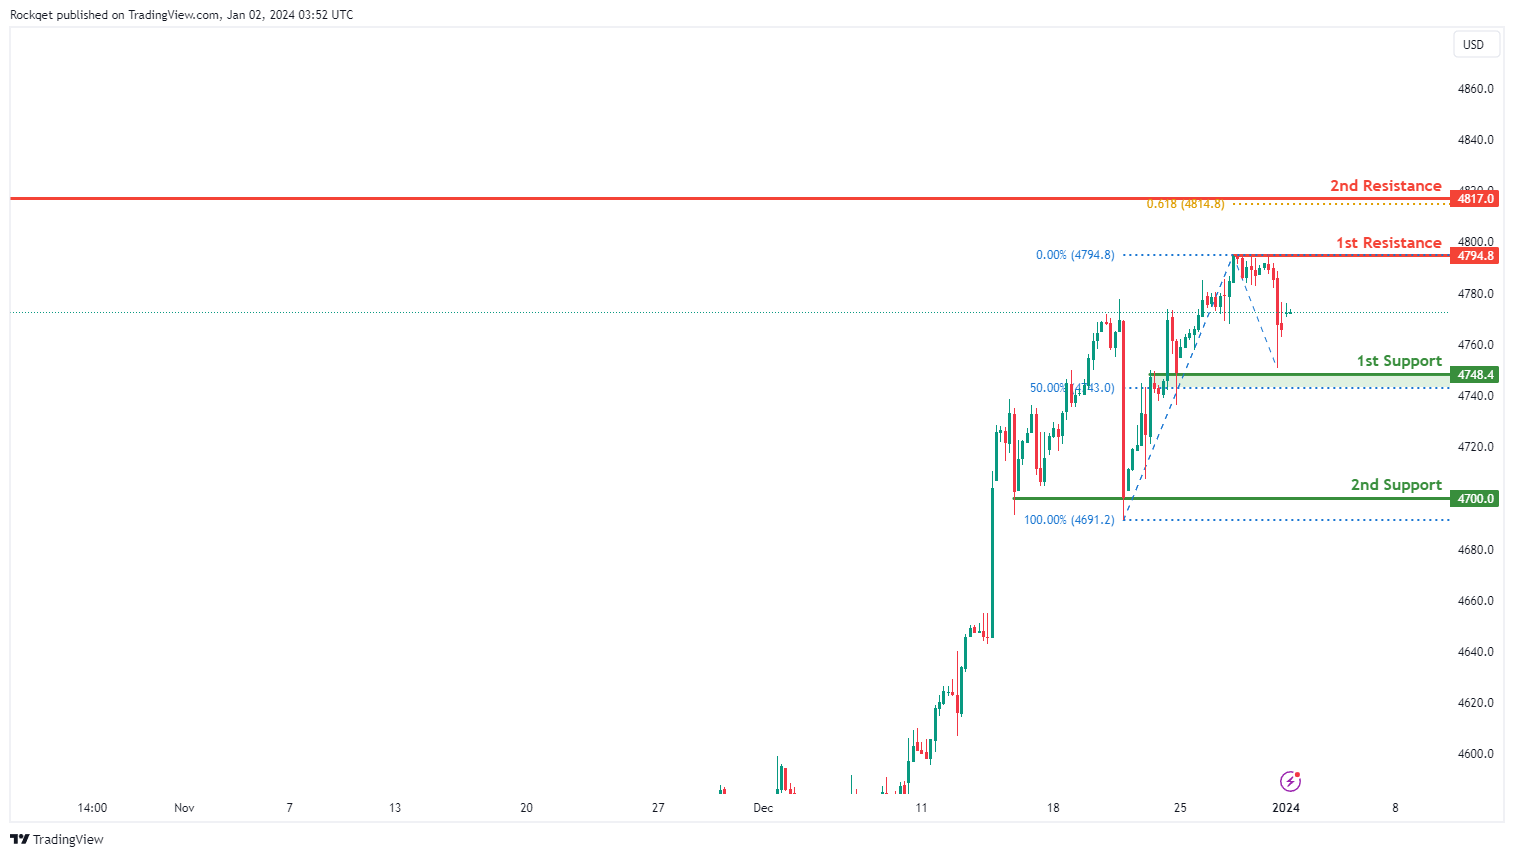
US500:
The US500 chart currently maintains an overall bullish momentum. However, there is a potential for price to fluctuate between the 1st resistance and the 1st support.
The 1st resistance at 4,794.80 is associated with a pullback resistance. Furthermore, the 2nd resistance at 4,817.00 represents a swing-high resistance that aligns with the 61.80% Fibonacci projection level, indicating a level where selling interest could intensify.
To the downside, the 1st support at 4,748.40 is considered as an overlap support that aligns with the 50.00% Fibonacci retracement level. Additionally, the 2nd support at 4,700.00 is identified as a pullback support, providing an additional layer of potential support.
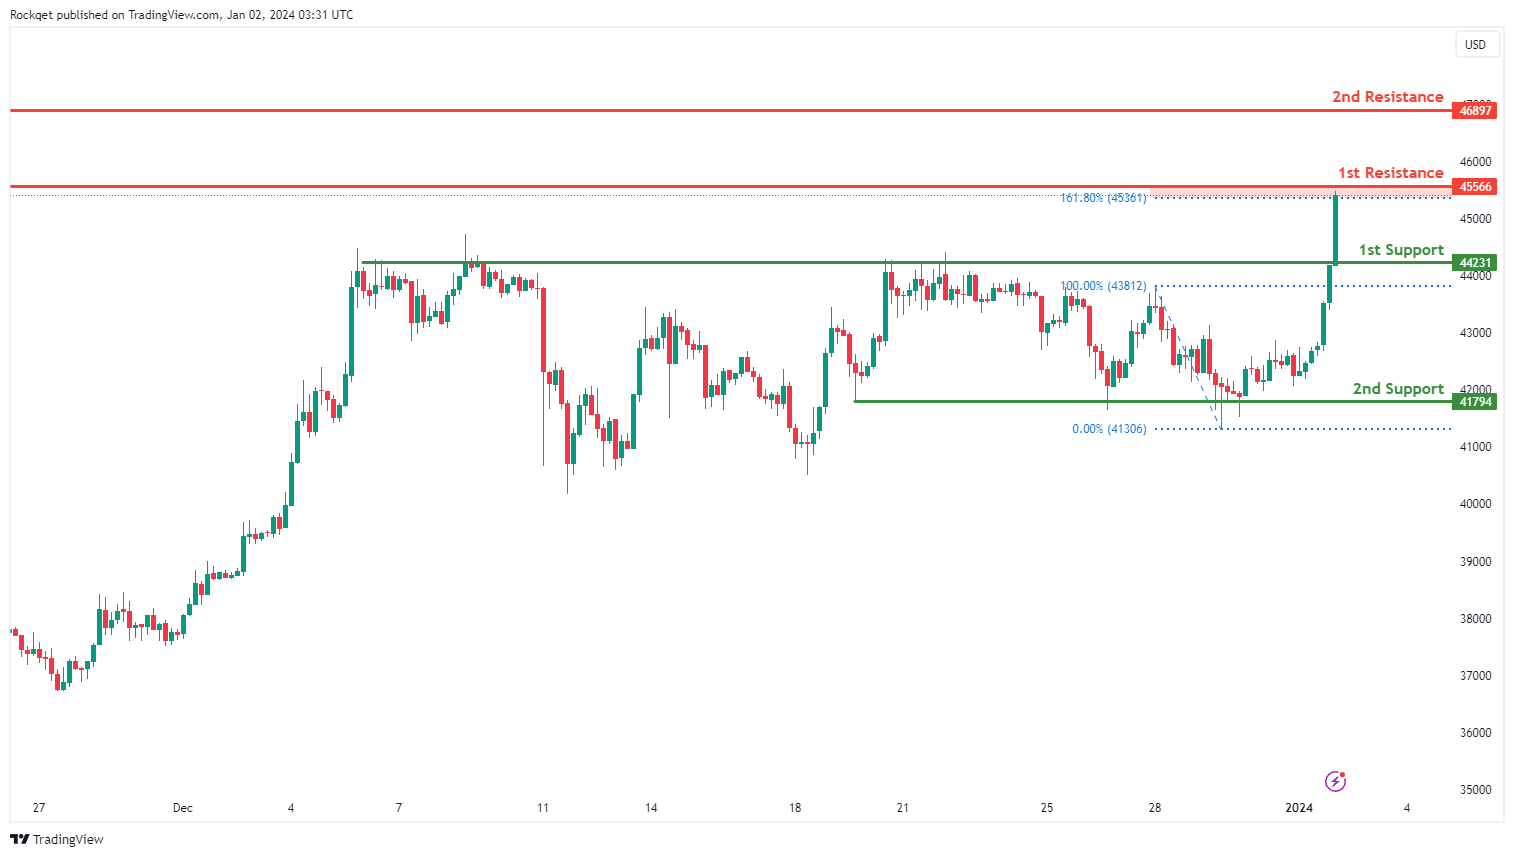
BTC/USD:
The BTC/USD chart currently displays an overall bullish momentum, suggesting a potential scenario for price to make a bullish continuation towards the 1st resistance.
The 1st resistance at 45,566 is associated with a pullback resistance that aligns close to the 161.80% Fibonacci extension level. Furthermore, the 2nd resistance at 46,897 represents an overlap resistance, indicating a level where selling interest could intensify.
To the downside, the 1st support at 44,231 is considered as a pullback support. Additionally, the 2nd support at 41,794 is also identified as a pullback support, providing an additional layer of potential support.
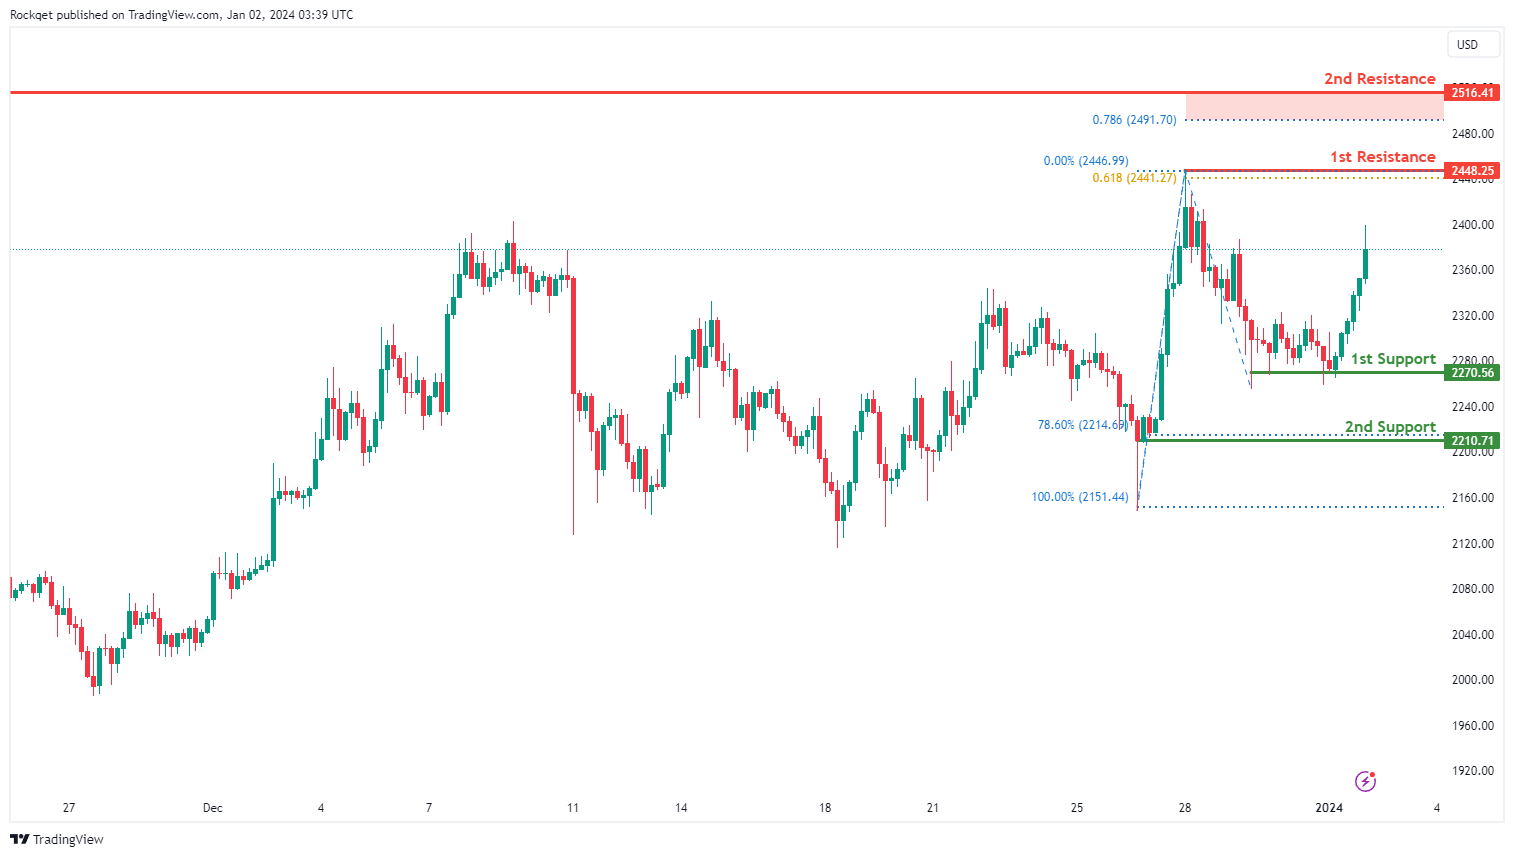
ETH/USD:
The ETH/USD chart currently exhibits an overall bullish momentum, suggesting a potential scenario for price to make a bullish continuation towards the 1st resistance.
The 1st resistance at 2,4448.25 is associated with a swing high resistance that aligns with the 61.80% Fibonacci projection level. Furthermore, the 2nd resistance at 2,516.41 represents a pullback resistance that aligns close to the 78.60% Fibonacci projection level, indicating a level where selling interest could intensify.
To the downside, the 1st support at 2,270.56 is considered as a pullback support that aligns with the 61.80% Fibonacci retracement level. Additionally, the 2nd support at 2,210.71 is identified as a swing-low support that aligns with the 78.60% Fibonacci retracement level, providing an additional layer of potential support.
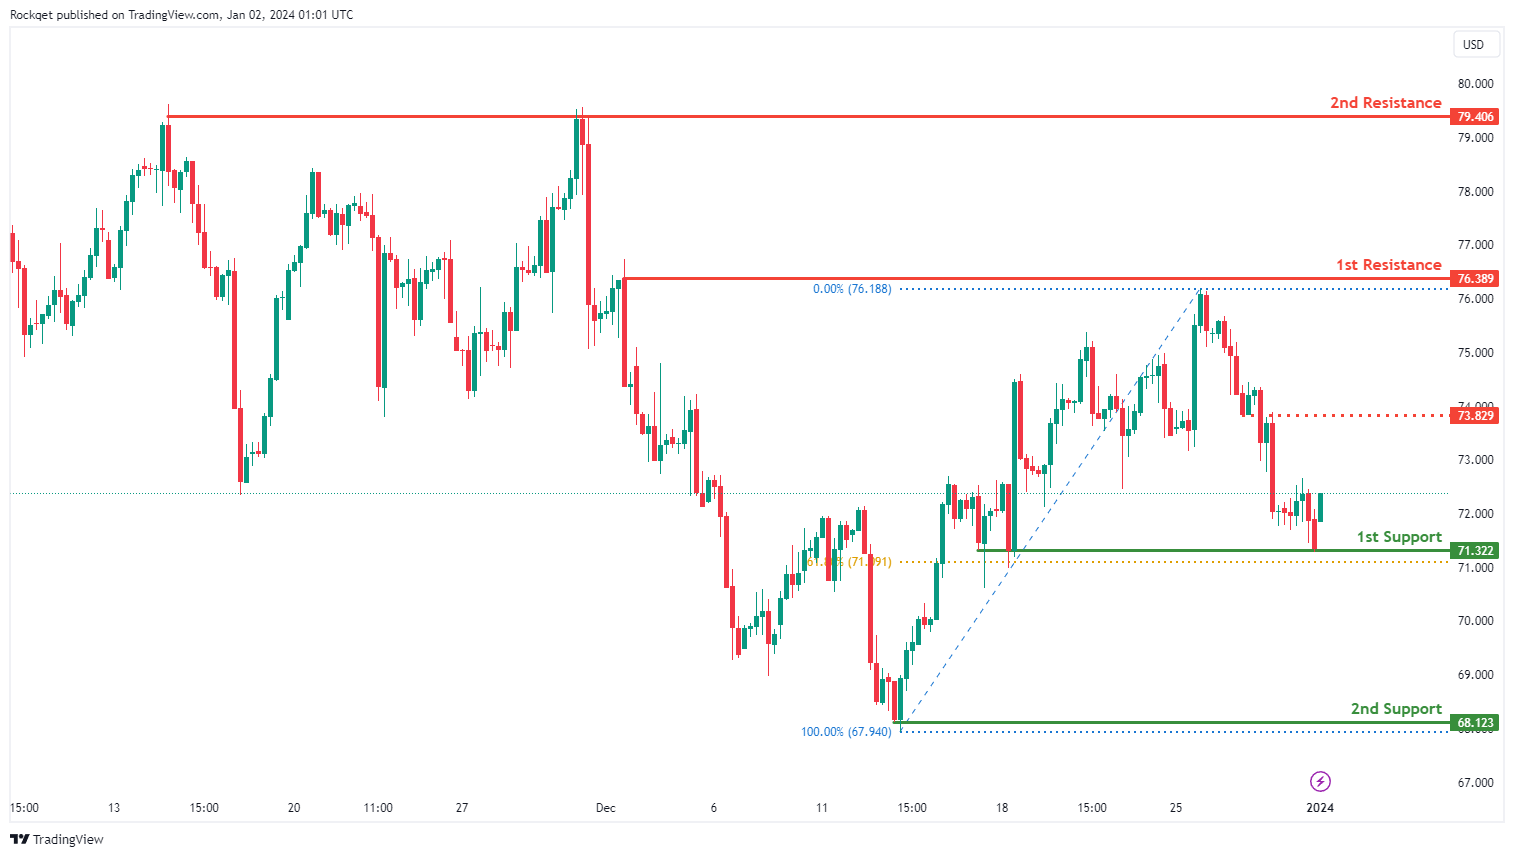
WTI/USD:
The WTI chart currently exhibits an overall bearish momentum. However, there is a potential scenario for price to rise towards the 1st resistance should it break above the intermediate resistance.
The intermediate resistance level at 73.82 is identified as an overlap resistance while the 1st resistance level at 76.38 is identified as a pullback resistance. Higher up, the 2nd resistance level at 79.40 is noted as a multi-swing-high resistance, further indicating its potential significance as a barrier for further upward movement.
To the downside, the 1st support level at 71.32 is identified as a pullback support that aligns close to the 61.80% Fibonacci retracement level. Further below, the 2nd support level at 68.12 is marked as a swing-low support, reinforcing its importance as a key support level.
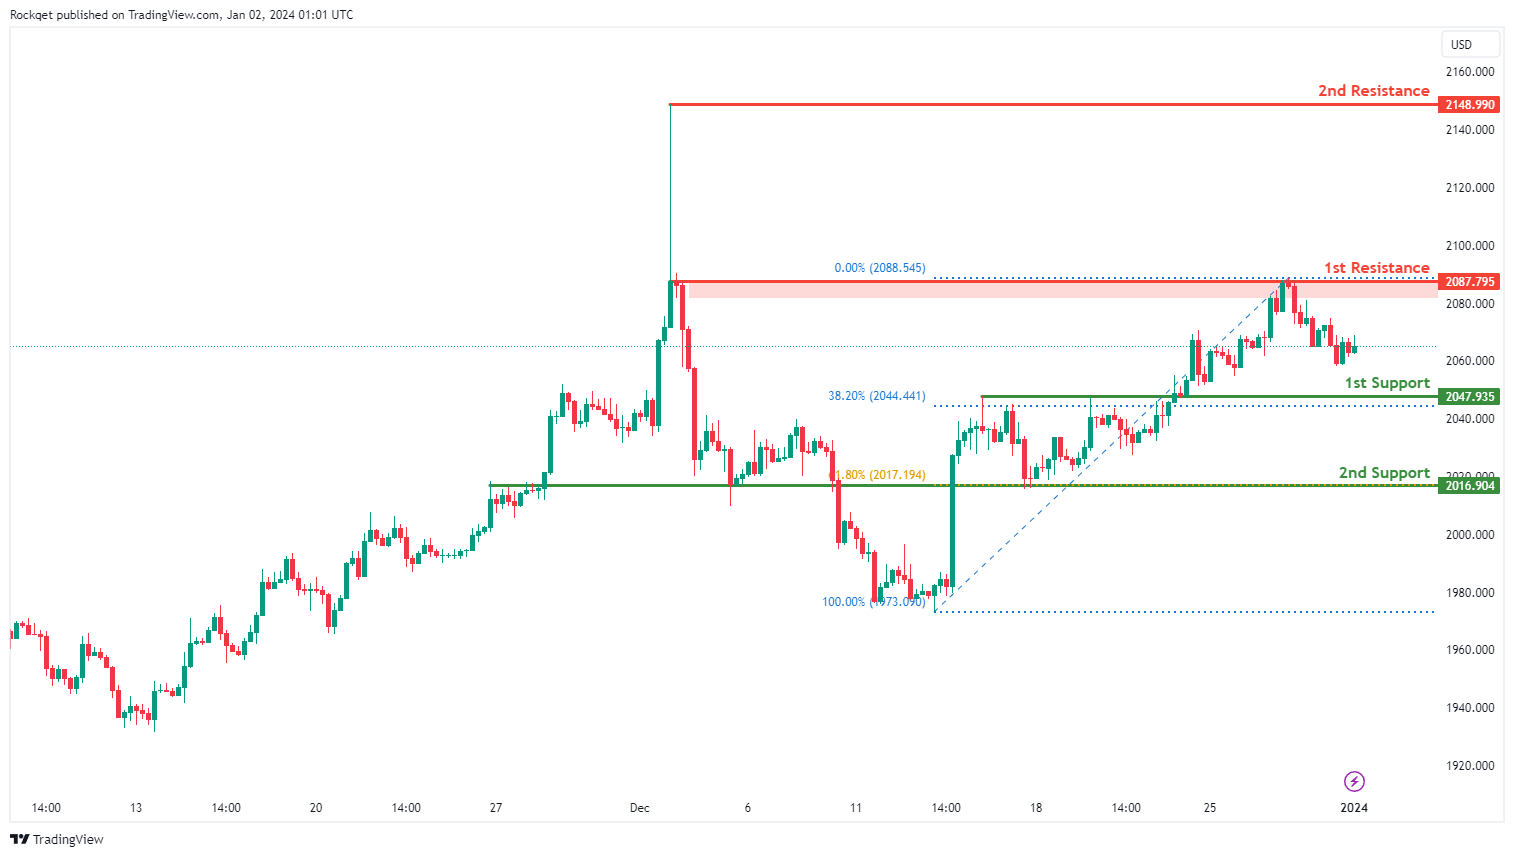
XAU/USD (GOLD):
The XAU/USD chart currently demonstrates a bullish momentum, indicating a potential for price to make a bullish continuation towards the 1st resistance.
The 1st resistance level at 2,087.79 is identified as a pullback resistance. Higher up, the 2nd resistance level at 2,148.99 is marked as a swing-high resistance, further indicating its potential significance as a barrier for further upward movement.
To the downside, the 1st support level at 2,047.93 is identified as a pullback support that aligns close to the 38.20% Fibonacci retracement level. Further below, the 2nd support level at 2,016.90 is noted as an overlap support that aligns with the 61.80% Fibonacci retracement level, reinforcing its importance as a key support level.
The accuracy, completeness and timeliness of the information contained on this site cannot be guaranteed. IC Markets does not warranty, guarantee or make any representations, or assume any liability regarding financial results based on the use of the information in the site.
News, views, opinions, recommendations and other information obtained from sources outside of www.icmarkets.com, used in this site are believed to be reliable, but we cannot guarantee their accuracy or completeness. All such information is subject to change at any time without notice. IC Markets assumes no responsibility for the content of any linked site.
The fact that such links may exist does not indicate approval or endorsement of any material contained on any linked site. IC Markets is not liable for any harm caused by the transmission, through accessing the services or information on this site, of a computer virus, or other computer code or programming device that might be used to access, delete, damage, disable, disrupt or otherwise impede in any manner, the operation of the site or of any user’s software, hardware, data or property.


