
A note on lower timeframe confirming price action…
Waiting for lower timeframe confirmation is our main tool to confirm strength within higher timeframe zones, and has really been the key to our trading success. It takes a little time to understand the subtle nuances, however, as each trade is never the same, but once you master the rhythm so to speak, you will be saved from countless unnecessary losing trades. The following is a list of what we look for:
- A break/retest of supply or demand dependent on which way you’re trading.
- A trendline break/retest.
- Buying/selling tails/wicks – essentially we look for a cluster of very obvious spikes off of lower timeframe support and resistance levels within the higher timeframe zone.
- Candlestick patterns. We tend to only stick with pin bars and engulfing bars as these have proven to be the most effective.
We search for lower timeframe confirmation between the M15 the H1 timeframes, since most of our higher-timeframe areas begin with the H4. Stops are usually placed 5-10 pips beyond confirming structures.
EUR/USD:
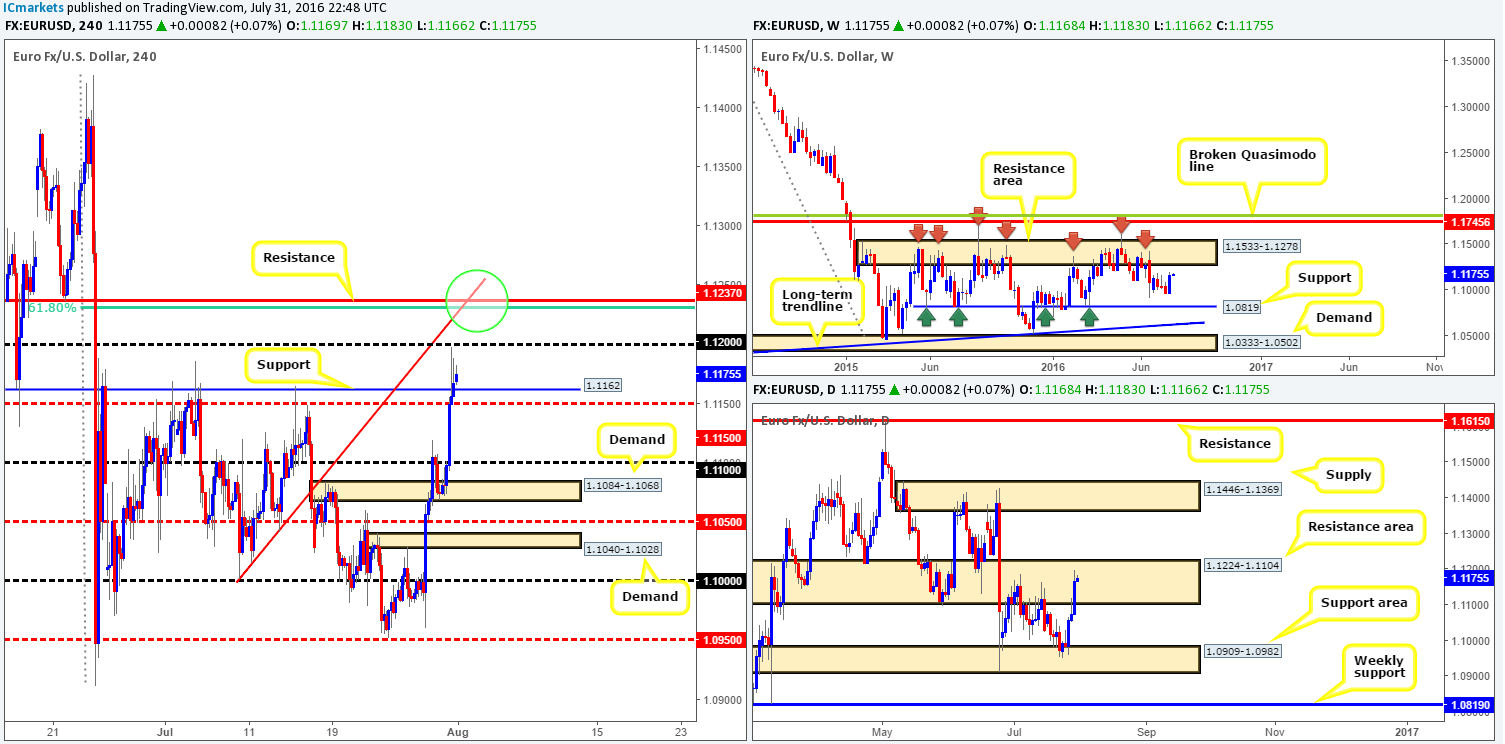
Despite yesterday’s US ISM manufacturing data coming in lower than expected, the single currency remained trading within a narrow range of around thirty pips. As can be seen from the H4 chart, price remains hovering just ahead of the H4 mid-way figure 1.1150, which is likely to be tested today given that daily action occupies a daily resistance area coming in at 1.1224-1.1104. Should this come to fruition, buying from this line is not something we’d stamp high probability. A close below followed by a retest and a lower timeframe sell signal (see the top of this report), however, is something that would catch our eye since the path south would likely be clear down to at least the 1.11 handle, followed closely by H4 demand at 1.1084-1.1068.
Another level of interest comes in at 1.1237. A H4 resistance line strengthened by a H4 61.8% Fib at 1.1231 along with a H4 trendline swap taken from the low 1.1069 (green circle). A bounce is likely from this region should price cut through offers at the 1.12 handle. Why only a bounce? Well, this H4 level is positioned ABOVE the aforementioned daily resistance area, and sits BELOW a long-term weekly resistance zone at 1.1533-1.1278. Therefore, price will likely be attracted to the weekly offers above our H4 line, hence why we’re really only looking for a small intraday bounce!
Levels to watch/live orders
- Buys: Flat (Stop loss: N/A).
- Sells: 1.1237 region [Tentative – confirmation required] (Stop loss: dependent on where one confirms this area). Watch for price to close below the 1.1150 level and look to trade any retest seen thereafter (lower timeframe confirmation required).
GBP/USD:
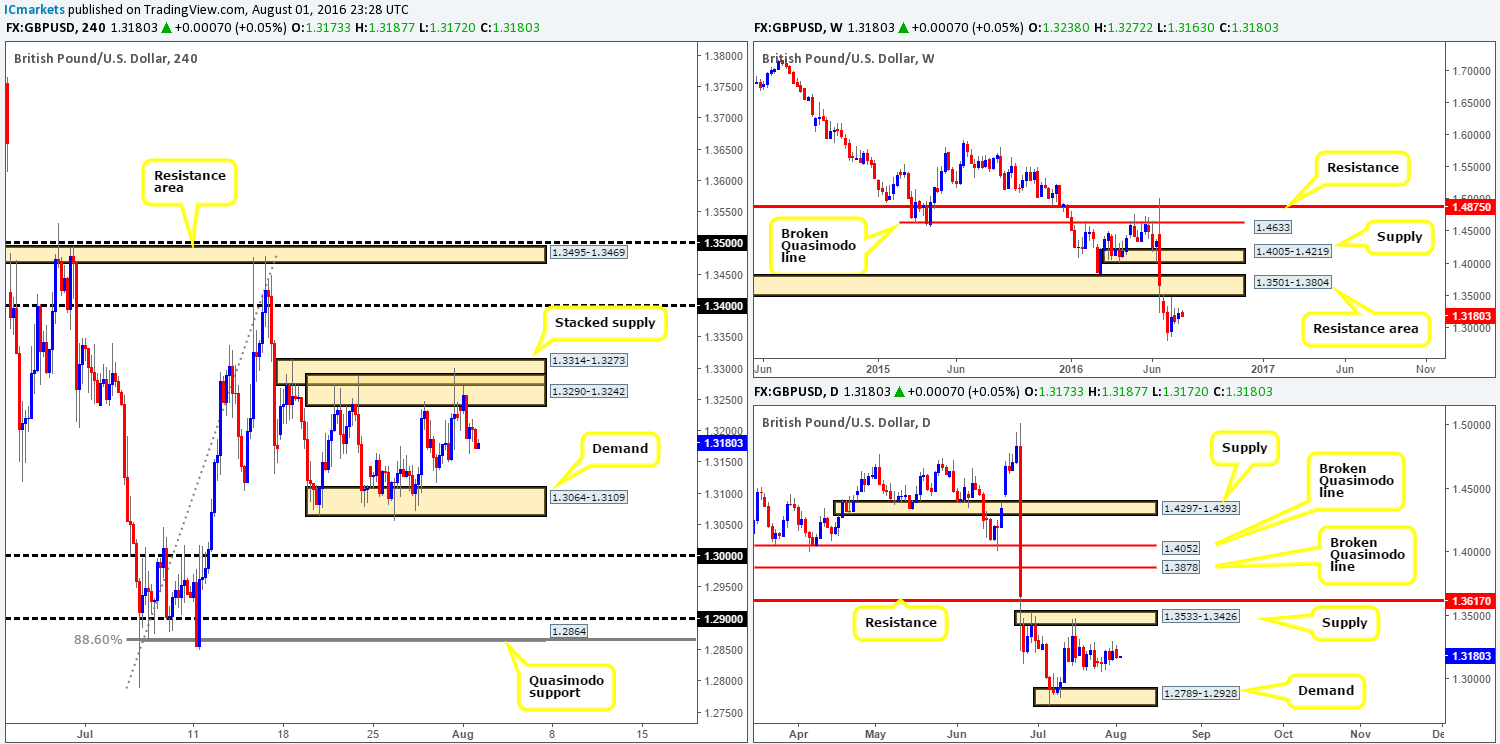
Bolstered by lower than expected UK manufacturing data, cable tumbled lower from a H4 stacked supply formation composed of 1.3290-1.3242/ 1.3314-1.3273. The pair, as you can see, managed to reach lows of 1.3163 on the day and is now, at least from our perspective, trading mid-range between the above said H4 supplies, and a H4 demand at 1.3064-1.3109.
Looking over to the daily chart, the candles are also currently seen loitering mid-range between a daily supply zone at 1.3533-1.3426 and a daily demand barrier at 1.2789-1.2928. With the trend predominantly pointing south and considering the fact that the daily supply is glued to the underside of a weekly resistance area at 1.3501-1.3804, this will be a difficult barrier for the bulls to breach in our opinion. As such a break to the downside is the more favored route.
Our suggestions: One could look to trade the edges of the current H4 range today. However, knowing that there’s little higher-timeframe confluence surrounding this zone, our team has humbly decided to pass. If you’re analysis deems this zone tradable, you might want to consider waiting for lower timeframe price action to confirm bullish or bearish intent (see the top of this report) before risking capital.
For our team here, unless we see price strike the 1.35/1.34 region or break below the key figure 1.30, we have absolutely no interest in trading this pair today.
Levels to watch/live orders:
- Buys: Flat (Stop loss: N/A).
- Sells: Flat (Stop loss: N/A).
AUD/USD:
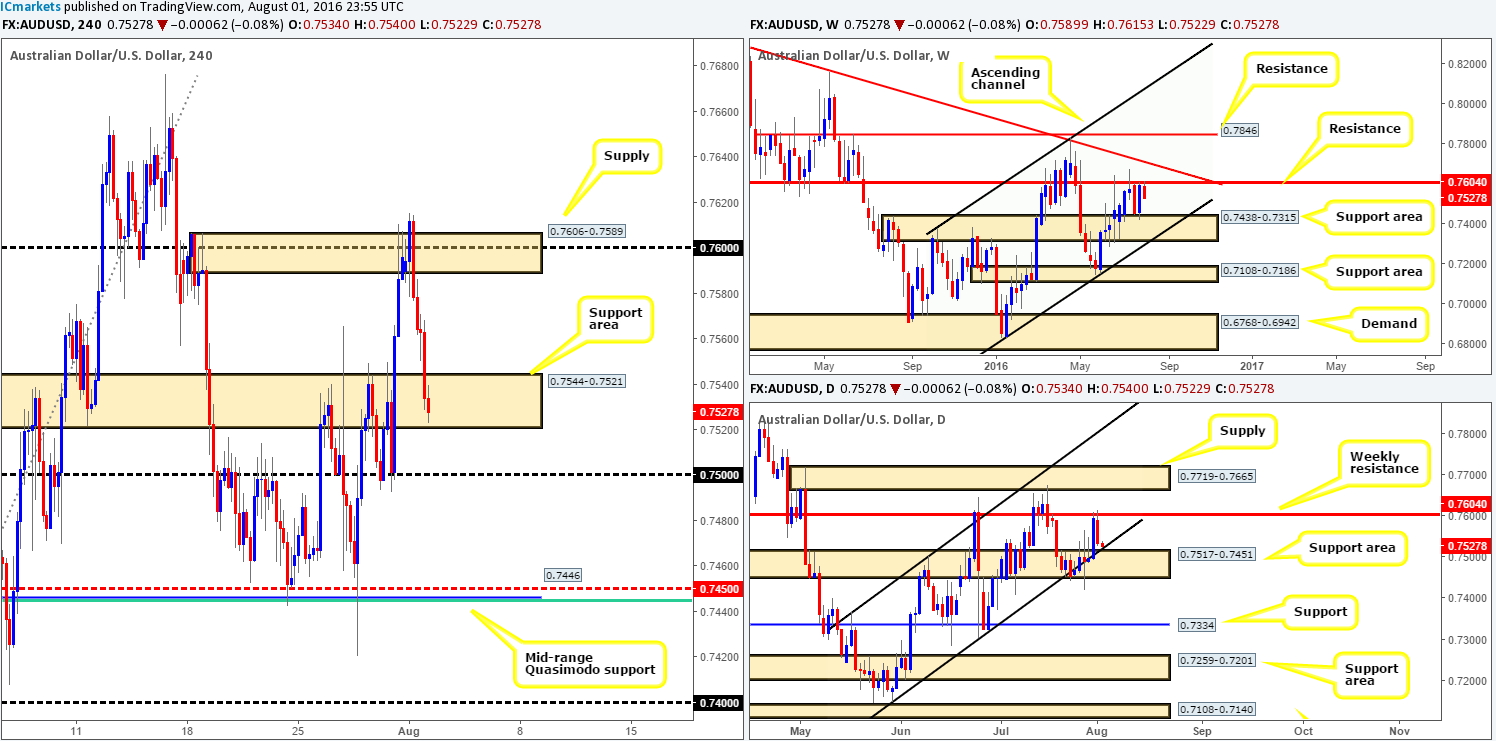
For those who read our previous report (see link below) you may recall we mentioned that our team entered short at 0.7589, with a stop placed above the H4 supply (0.7606-0.7589) at 0.7611. As can be seen from the H4 chart, the trade worked out beautifully and hit our take-profit area going into the American afternoon session: the H4 support zone at 0.7544-0.7521. Well done to any of our readers who jumped aboard this train!
Now, going forward, we can see that weekly price shows room to continue lower down to the weekly support area coming in at 0.7438-0.7315. On the other hand, down on the daily chart the market is now seen testing a daily channel support line extended from 0.7148, which is bolstered by a daily support area seen at 0.7517-0.7451.
Our suggestions: With the daily and weekly charts not exactly seeing eye-to-eye at the moment (see above), buying from the current H4 support area (against weekly flow) is not something our team would sign off on as being a high-probability trade.
A break below the H4 support zone (while this move would be supported by weekly flow) would also place you toe-to-toe with daily buyers and the 0.75 handle! Therefore, opting to stand on the sidelines here may very well be the best path to take, as let’s not forget that traders will also likely be taking a cautious stance ahead of today’s RBA monetary policy decision.
Levels to watch/live orders:
- Buys: Flat (Stop loss: N/A).
- Sells: Flat (Stop loss: N/A).
USD/JPY:
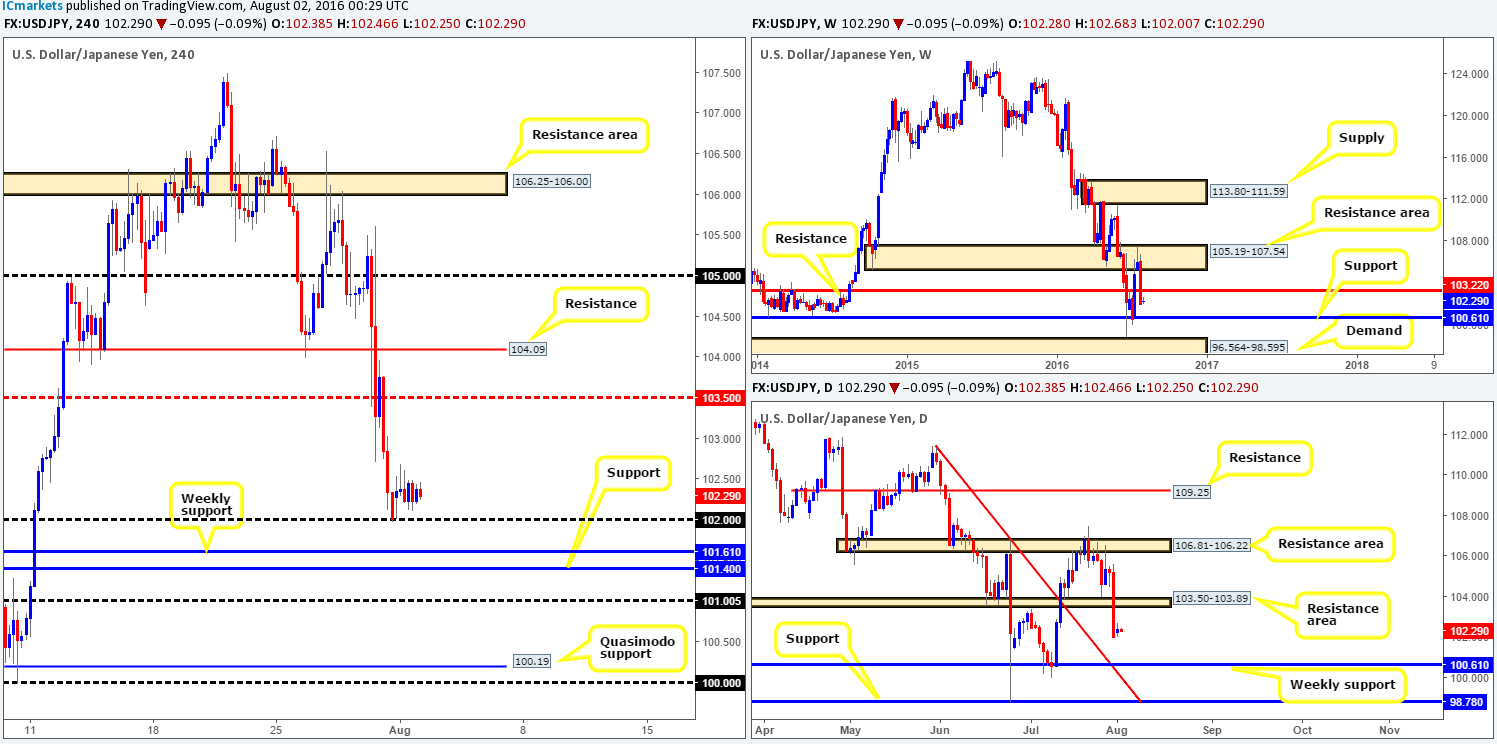
In spite of a disappointing US manufacturing print yesterday, the USD/JPY pair entered into a phase of consolidation just above the 102 handle, ranging around only seventy pips on the day.
From the weekly chart, we can see that last week’s sell off broke through the weekly support level at 103.22 (now acting resistance) and has potentially opened the doors for price to challenge the weekly support line seen at 100.61 this week. In conjunction with weekly action, daily price also shows space to connect with the weekly support level at 100.61. In addition to this, there’s a daily trendlline swap extended from the high 111.35 that fuses beautifully with the weekly support level, thus increasing the chances of a reversal from here.
Although the pair remains hovering above 102, we feel this barrier is fragile due to the position of price on the higher-timeframe picture (see above). In light of this, we feel a move to the downside will likely be seen today as we move into the more liquid sessions.
Our suggestions: Watch for price to close below 102. This – coupled with a retest and a lower timeframe sell signal (see the top of this report) would be sufficient enough for us to sell this pair, targeting the H4 support 101.40, followed by the 101 handle. Should price reach 101, all short positions would be liquidated and longs would be the next objective. The reason being is between 101 and the weekly support just below it at 100.61 forms a beautiful buy zone (green area). Be that as it may, out team would still recommend waiting for a lower timeframe buy signal from this area, since there’s a chance price may fake lower to connect with the H4 Quasimodo support level at 100.19.
Levels to watch/live orders:
- Buys: 101.40/101.61 region [Tentative – confirmation required] (Stop loss: dependent on where one confirms this area).
- Sells: Flat (Stop loss: N/A).
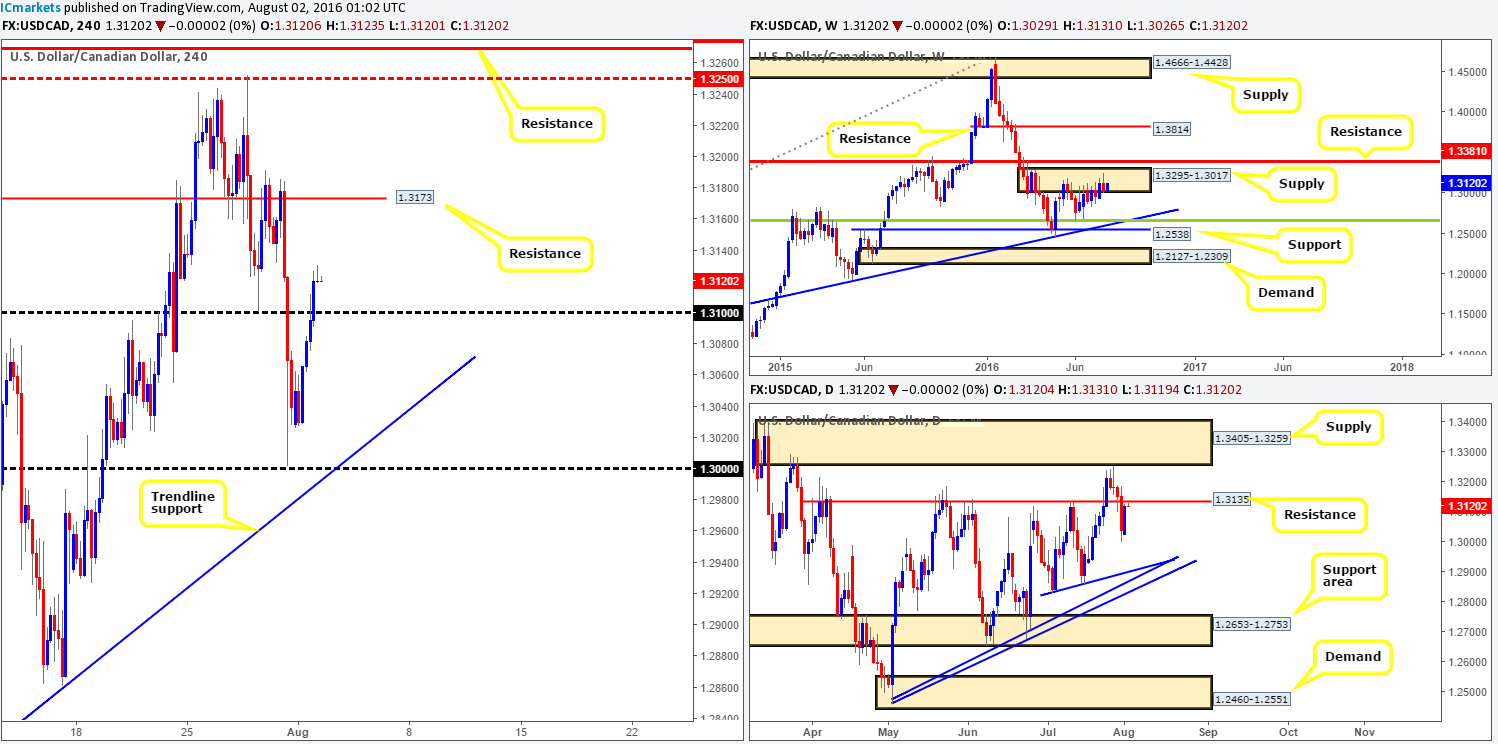
USD/CAD:
Starting from the top this morning, we can see that the buyers and sellers remain battling for position within the weekly supply zone carved from 1.3295-1.3017. Providing that the sellers can overthrow the buyers here, the next downside target can be seen at a weekly trendline support extended from the high 1.1278, which coincides with a weekly 38.2% Fib support at 1.2661 (taken from the low 0.9406). Moving down to the daily chart, price is now seen trading within touching distance of a daily resistance line given at 1.3135 which effectively could help push the pair lower from the above said weekly supply zone.
Stepping across to the H4 chart, The USD/CAD bulls went on the offensive during the course of yesterday’s sessions, as oil prices dipped to lows of 39.81! This, as you can see, sent the loonie above the 1.31 handle, and now looks set to attack the H4 resistance level drawn from 1.3173.
Our suggestions: Look for short positions between the daily resistance line at 1.3135 and the H4 resistance level at 1.3173 today. Should we manage to pin down a sell from this region, our team would look to lock in some of the position around the 1.31 mark, followed by the H4 trendline taken from the low 1.2677. In the event that this target is achieved, one may want to consider holding for the next daily target: a cluster area of daily trendline supports taken from the following lows: 1.2460 and 1.2839.
To try and avoid the dreaded fakeout around the above said H4 sell zone, you may want to enter once the lower timeframes have drawn up a suitable setup. For those who struggle to find such setups, please see the top of this report.
Levels to watch/live orders:
- Buys: Flat (Stop loss: N/A).
- Sells: 1.3173/1.3135 [Tentative – confirmation required] (Stop loss: dependent on where one confirms this area).
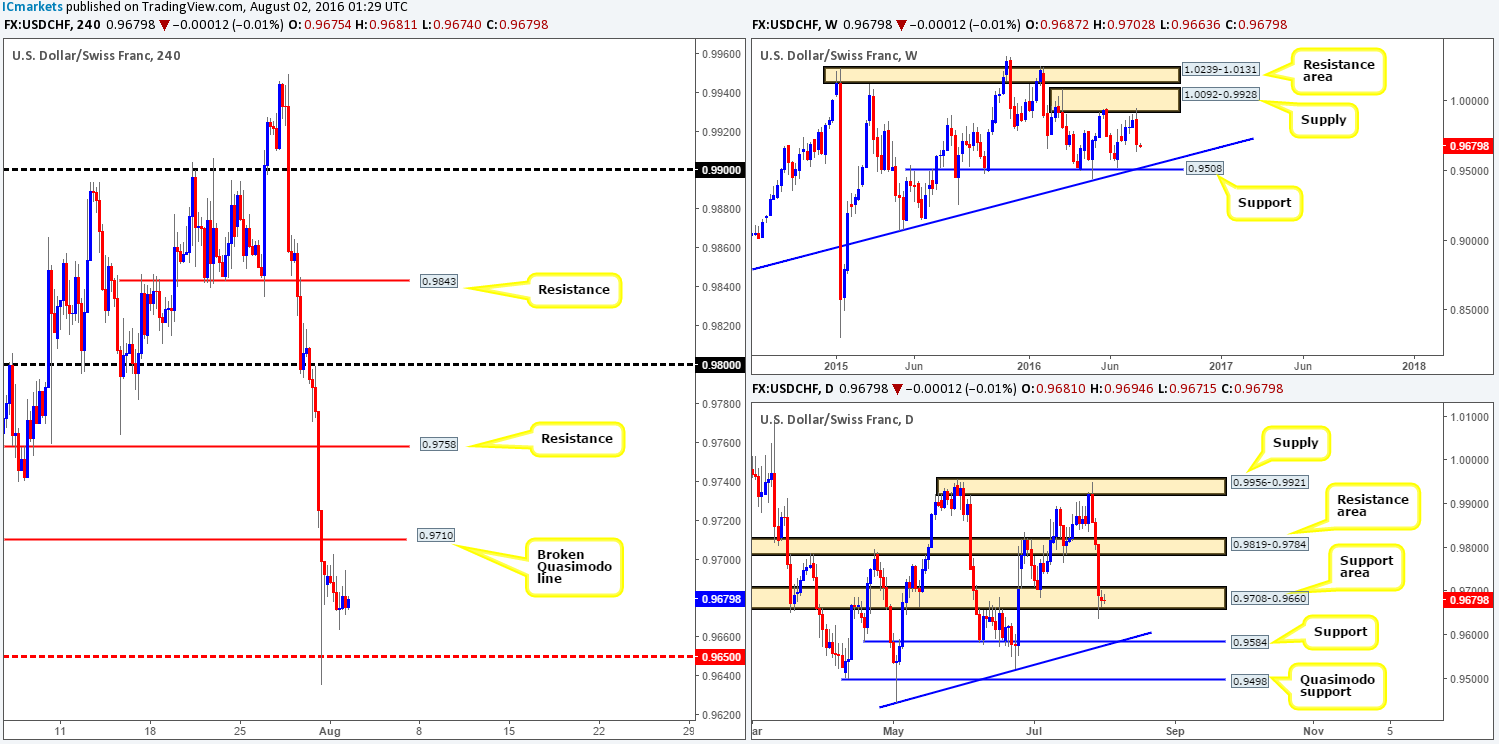
USD/CHF:
The USD/CHF, just like its inversely correlated cousin the EUR/USD, saw a rather muted response yesterday despite US manufacturing coming in lower than expected. In view of this lackluster performance, much of the following report will echo similar thoughts put forward in Monday’s analysis…
The view from the weekly chart shows that last week’s weekly candle turned beautifully from the underside of a weekly supply zone at 1.0092-0.9928, engulfing four prior weekly candles along the way! To our way of seeing things, there’s little support stopping the Swissy from connecting with the weekly trendline support extended from the low 0.8703 (intersects perfectly with a weekly support level at 0.9508) sometime this week.
Despite weekly price looking as though it’s heading lower, on the daily chart the unit is seen bid from a daily support area given at 0.9708-0.9660. Furthermore, just beneath this region sits another support at 0.9584 that ties in nicely with a daily trendline support taken from the low 0.9443. The next upside target from current price sits at a daily resistance area drawn from 0.9819-0.9784.
Our suggestions: As of the H4 chart, price is seen hovering between a H4 broken Quasimodo line at 0.9710 and a H4 mid-way support barrier drawn from 0.9650. The aforementioned H4 broken Quasimodo level could hold price given the weekly picture (see above). Should the level hold and produce a lower timeframe sell signal (see the top of this report), we would recommend playing this one short, targeting 0.9650 first and foremost.
On the other hand, if the unit closes above and retests 0.9710, a long position could be considered (given the position of daily price) if a lower timeframe buy signal is spotted, targeting H4 resistance at 0.9758, followed closely by the 0.98 handle which is located within the aforementioned daily resistance area.
For traders who struggle to pin down lower timeframe entries, please see the top of this report.
Levels to watch/live orders:
- Buys: Watch for price to close above the H4 broken Quasimodo line at 0.9710 and look to trade any retest seen thereafter (lower timeframe confirmation required).
- Sells: 0.9710 region [Tentative – confirmation required] (Stop loss: dependent on where one confirms this area).
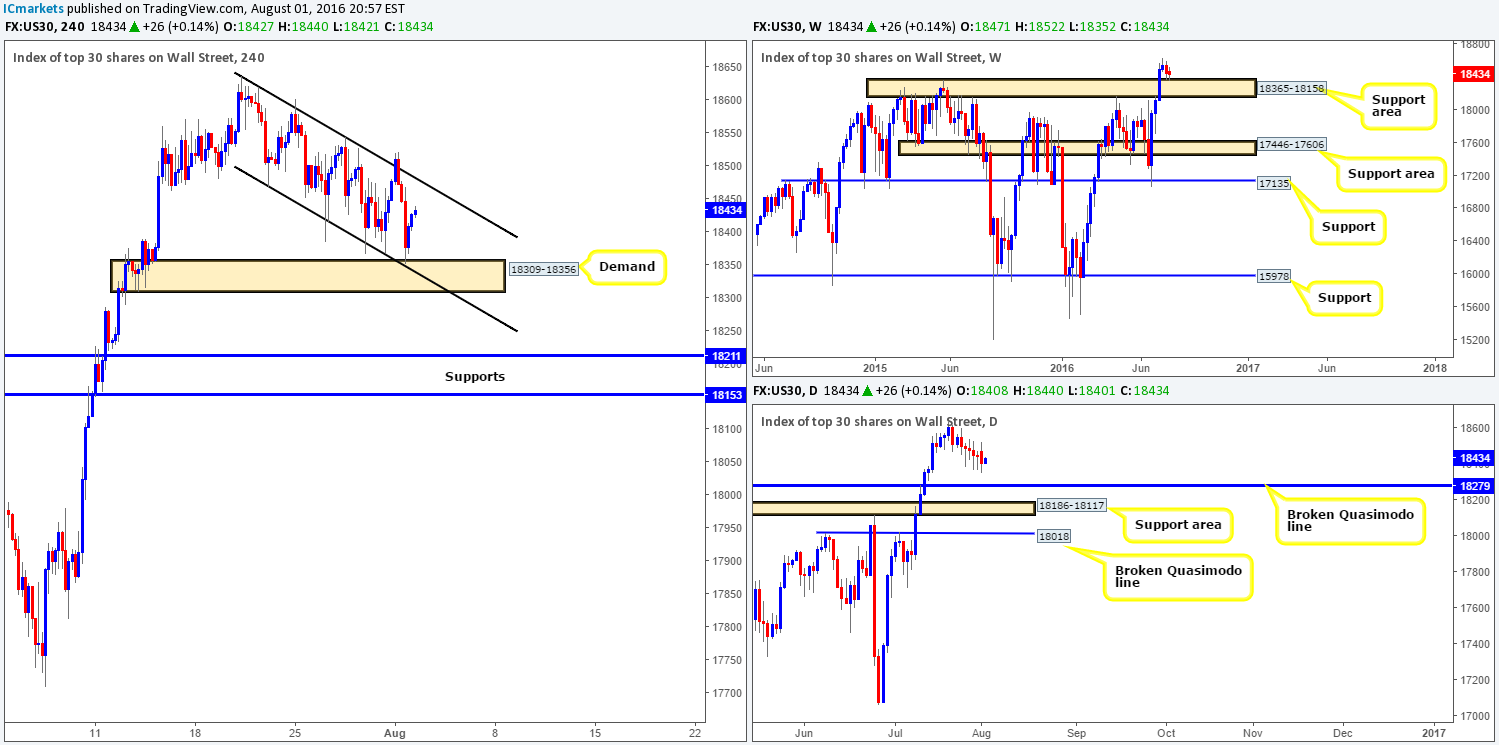
DOW 30:
For those who have been following our reports on the Dow over the past week or so, you may recall that we had our eye on the H4 demand zone seen at 18309-18356 for quite some time. Well, going into yesterday’s American morning session we saw price stab this zone beautifully, which, as you can see, merged nicely with a H4 downside channel support taken from the low 18468. Well done to any of our readers who managed to pin down a position from here!
Why we were banging the drum for so long about this area simply came down to its higher-timeframe position. There’s a weekly support area at 18365-18158 that supports the above said H4 demand zone. Alongside this, there’s also a daily broken Quasimodo line at 18279, which is lodged within the above said weekly support area and sits just below the aforementioned H4 demand barrier.
Our suggestions: It would be fantastic to see price retest the current H4 demand zone today as we would still look to take a long position from here. However, as we mentioned in previous reports, we’d still require lower timeframe confirmation before pulling the trigger (see the top of this report). The reason for why comes down to the possibility that price may fake through this H4 zone to tag in daily bids around the aforementioned daily broken Quasimodo line.
In addition to the above, watch for a close above the H4 upper channel resistance line taken from the high18636, followed by a subsequent retest. This, by and of itself, would be sufficient enough to condone a long trade due to where price came from: the WEEKLY support area!
Levels to watch/live orders:
- Buys: Watch for price to close above the H4 channel resistance (18636) and look to trade any retest seen thereafter (lower timeframe confirmation required). 18309-18356 [Tentative – confirmation required] (Stop loss: dependent on where one confirms this area).
- Sells: Flat (Stop loss: N/A).
GOLD:
Going into this morning’s sessions, it’s clear that the yellow metal remains sandwiched between a H4 demand base coming in at 1347.0-1342.4, and a H4 supply area formed from 1357.5-1353.1. As we mentioned in Monday’s report, we feel that price is likely going to break below the current H4 demand, consequently opening up the path down to a H4 mid-range Quasimodo line at 1332.3. Here’s why: weekly action is currently trading just ahead of a weekly Quasimodo resistance level at 1361.7, and daily price is being held lower by a daily resistance band drawn from 1354.6. So between these two higher-timeframe structures, lower prices is more likely in our opinion down to at least the daily demand zone seen at 1305.3-1322.8 (next downside target on the daily timeframe and also sits on top of the weekly support area mentioned above).
Our suggestions: Watch for price to close below the current H4 demand base and look to trade any retest seen to the underside of the broken area, targeting 1332.3, followed by a H4 demand area at 1315.6-1319.6 (located within the aforementioned daily demand zone). To avoid fakeouts, our team still recommends waiting for a lower timeframe sell signal to short (see the top of this report) following a successful retest.

Levels to watch/live orders:
- Buys: Flat (Stop loss: N/A).
- Sells: Watch for price to close below the H4 demand at 1347.0-1342.4 and look to trade any retest seen thereafter (lower timeframe confirmation required).


