
A note on lower timeframe confirming price action…
Waiting for lower timeframe confirmation is our main tool to confirm strength within higher timeframe zones, and has really been the key to our trading success. It takes a little time to understand the subtle nuances, however, as each trade is never the same, but once you master the rhythm so to speak, you will be saved from countless unnecessary losing trades. The following is a list of what we look for:
- A break/retest of supply or demand dependent on which way you’re trading.
- A trendline break/retest.
- Buying/selling tails/wicks – essentially we look for a cluster of very obvious spikes off of lower timeframe support and resistance levels within the higher timeframe zone.
- Candlestick patterns. We tend to stick with pin bars and engulfing bars as these have proven to be the most effective.
We search for lower timeframe confirmation between the M15 and H1 timeframes, since most of our higher-timeframe areas begin with the H4. Stops are usually placed 5-10 pips beyond confirming structures.
EUR/USD:
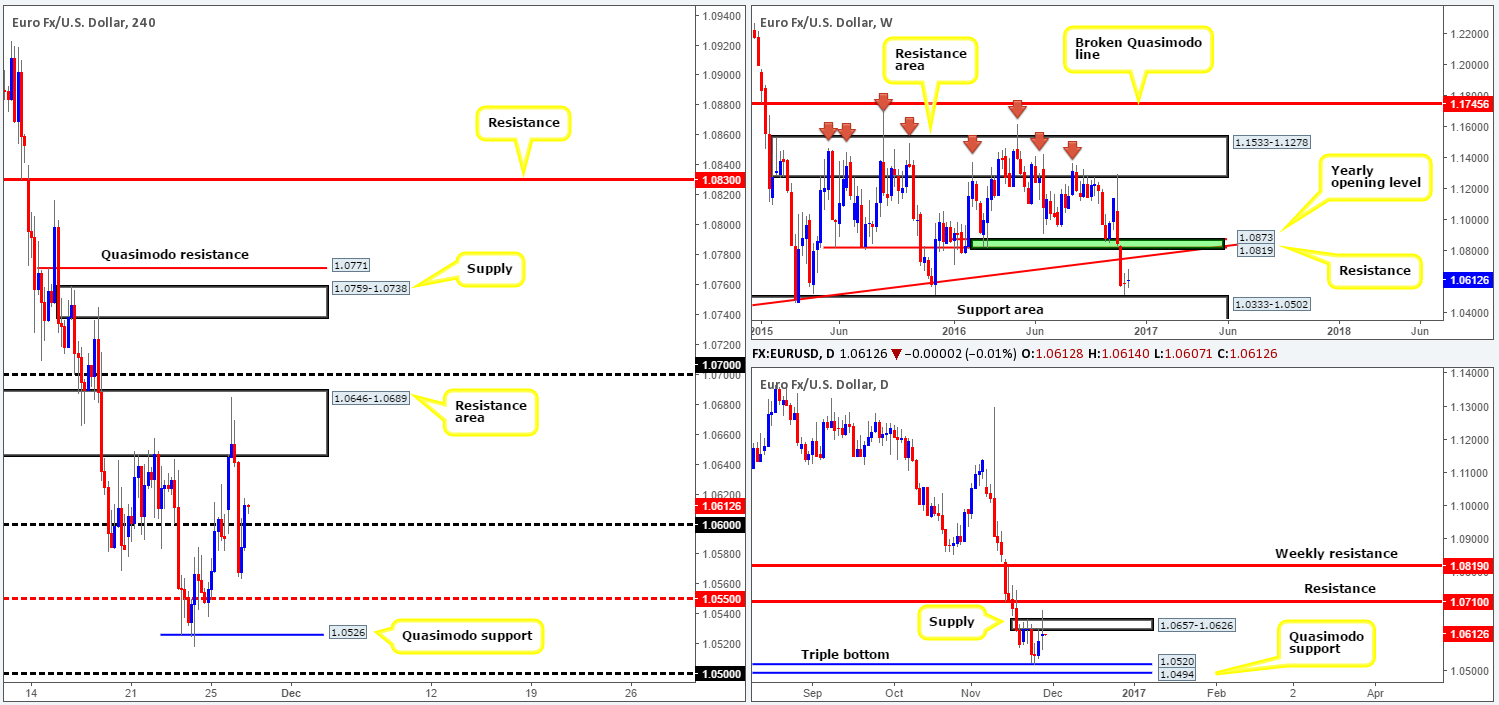
The shared currency began the week on a strong footing, gapping above the 1.06 handle and aggressively driving deep into a H4 resistance area at 1.0646-1.0689. It was here (the London open) that we saw the pair switch tracks and just as aggressively selloff to lows of 1.0563.
As you can see, the unit ended the day closing adjacent to the week’s open, above the 1.06 barrier. This – coupled with stops now likely consumed above the daily supply seen at 1.0657-1.0626 by yesterday’s movement, a rally to the daily resistance level at 1.0710 may be on the cards. Therefore, the 1.07 handle may be brought into the action today, which, as is shown on the H4 chart, sits directly above the current H4 resistance area.
Our suggestions: Given the above points, battle lines going into today’s sessions are as follows:
- The 1.07 handle. Granted, price will have to tackle the current H4 resistance area before reaching this level, but think of all those buy stops sitting just above this zone! Seeing as how psychological boundaries are generally prone to fakeouts, we would recommend waiting for lower timeframe confirming action before taking a trade around 1.07 (see the top of this report).
- As was highlighted in Monday’s weekly report, the 1.05 handle is interesting, and, as such, remains in our sights. On the account that 1.05 molds beautifully with the daily Quasimodo support at 1.0494 and also the top edge of the weekly support area at 1.0502, 1.05 is, at least in our book of technical setups, stable enough to permit a pending buy order at 1.0495 with a stop placed below the head of the current daily Quasimodo formation at 1.0459. Of course, before price reaches this buy zone, buyers from the daily triple-bottom support at 1.0520 will need to be engulfed.
Data points to consider: US Prelim GDP at 1.30pm, US consumer confidence report at 3pm. FOMC members Dudley and Powell also take the stage at 2.15pm and 5.40pm GMT.
Levels to watch/live orders:
- Buys: 1.0495 ([pending order] stop loss: 1.0459).
- Sells: 1.07 region ([waiting for lower timeframe confirming action is preferred] stop loss: dependent on where one confirms the area).
GBP/USD:
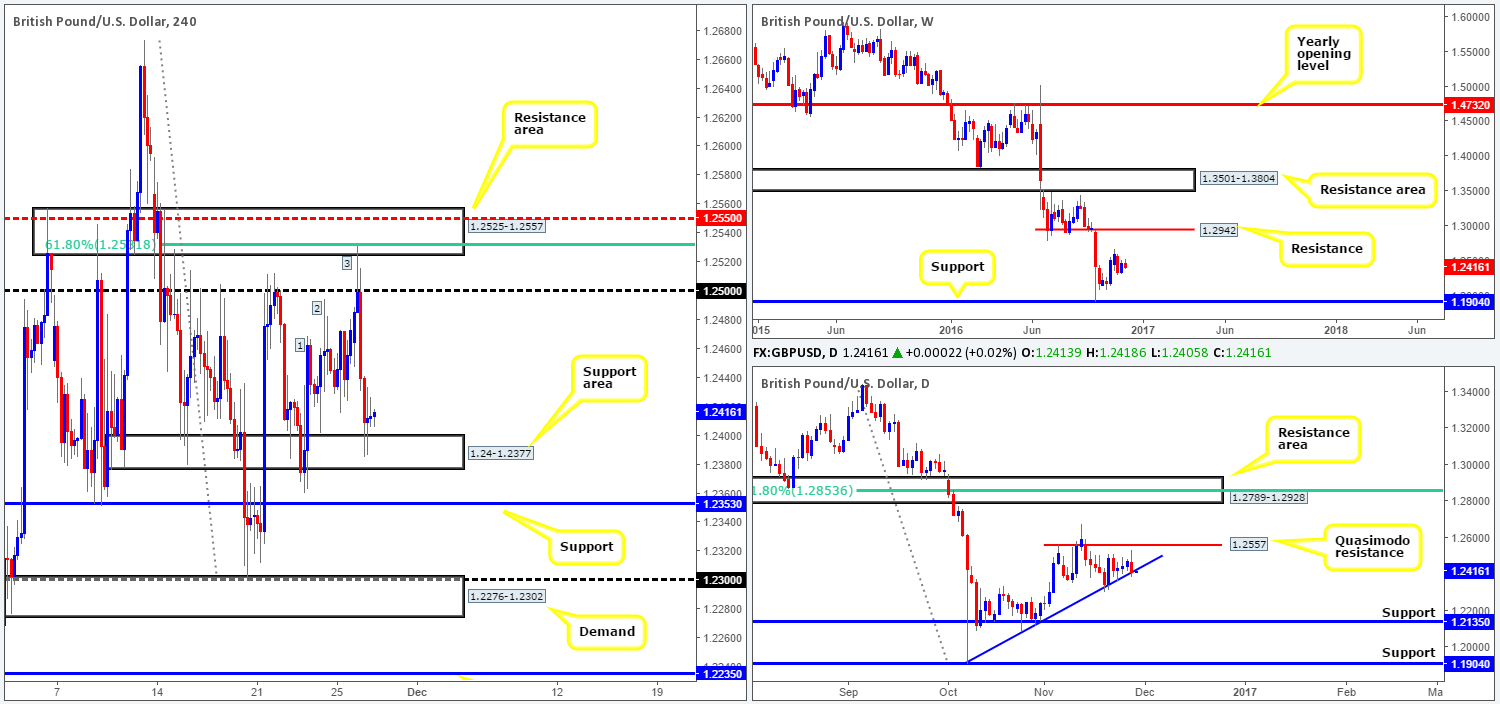
For those who follow our reports on a regular basis you may remember us underlining the H4 resistance area at 1.2525-1.2557 as a zone of significance. The barrier fused nicely with a H4 61.8% Fib resistance at 1.2531, a H4 mid-way resistance at 1.2550 and a H4 three-drive approach (See labels 1-3). Evident from the H4 chart, cable whipsawed through the 1.25 boundary going into the early hours of yesterday’s session, and beautifully tagged the underside of our sell zone. Well done to any of our readers who managed to get on board this trade call!
As we write, we can see the H4 support area at 1.24-1.2377 holding steady, which is strengthened by a daily trendline support extended from the low 1.1904. A long from this region is promising, since there’s little overhead restrictions on the higher-timeframe charts until 1.2557: a daily Quasimodo resistance. The closest obstacle on the H4 chart, in our opinion, currently sits at the 1.25 handle.
Our suggestions: Aggressive traders may contemplate an entry at market around 1.24-1.2377, while conservative traders may opt to wait for lower timeframe confirming action. There’s an M15 supply barrier coming in at 1.2441-1.2426 which is capping upside at the moment. Ideally, we, being conservative traders, would want to see this area engulfed before considering a long in this market, targeting 1.25.
Data points to consider: US Prelim GDP at 1.30pm, US consumer confidence report at 3pm. FOMC members Dudley and Powell also take the stage at 2.15pm and 5.40pm GMT.
Levels to watch/live orders:
- Buys: 1.24-1.2377 ([wait for an M15 close to be seen above the M15 supply at 1.2441-1.2426 before looking to trade long] stop loss: this will vary depending on if one looks to buy the breakout, or on a dip).
- Sells: Flat (stop loss: N/A).
AUD/USD:
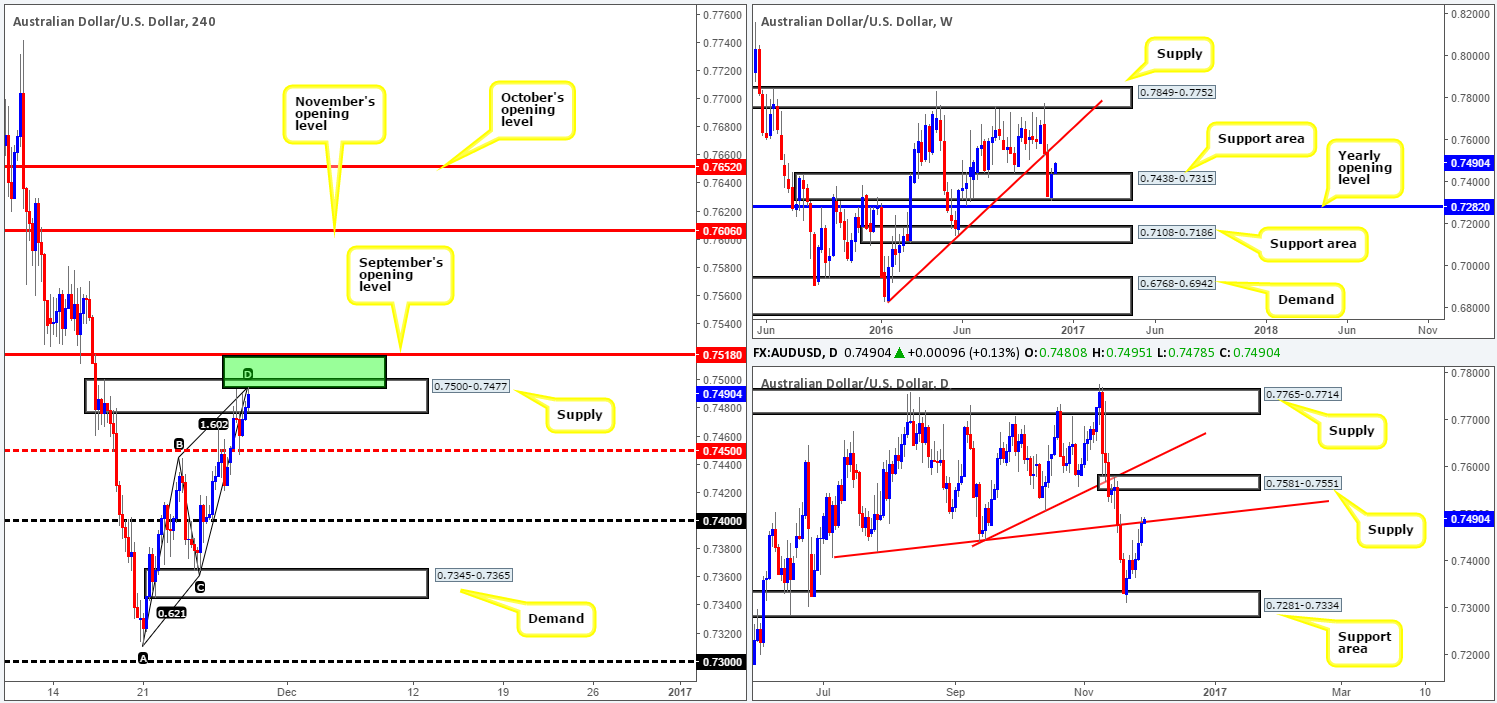
In view of the weekly timeframe, we can see that the bulls are currently extending last week’s bounce from the lower edge of the support area at 0.7438-0.7315. The next upside objective from this angle falls in at a trendline resistance drawn from the low 0.6827. Turning our attention to the daily candles, the commodity currency is seen trading a touch above the trendline resistance taken from the low 0.7407. Despite this, our desk will not consider this line invalidated until we’ve seen a daily close take shape.
Stepping across to the H4 chart, the pair retested the mid-way support at 0.7450 during yesterday’s London lunchtime, following a selloff from supply at 0.7500-0.7477. The result of this retest saw the market drive back into the said supply and is, at the time of writing, testing a very important area seen within: 0.7518/0.7494 (green rectangle). This zone boasts a H4 AB=CD bearish completion point at 0.7494, along with the top edge of the current H4 supply also representing the 0.75 handle as well as 18 pips above we have September’s opening barrier at 0.7518.
Our suggestions: This H4 area in green – coupled with the daily trendline resistance, has a high-probability of holding prices lower today. However, in light of the weekly action (see above), we would not recommend simply planting a sell order in the market with stops above the zone. Rather, be patient and wait for a reasonably sized H4 bearish candle to take shape, prior to pulling the trigger.
Data points to consider: US Prelim GDP at 1.30pm, US consumer confidence report at 3pm. FOMC members Dudley and Powell also take the stage at 2.15pm and 5.40pm GMT.
Levels to watch/live orders:
- Buys: Flat (stop loss: N/A).
- Sells: 0.7518/0.7494 ([reasonably sized H4 bearish close required prior to pulling the trigger] stop loss: ideally beyond the trigger candle).
USD/JPY:
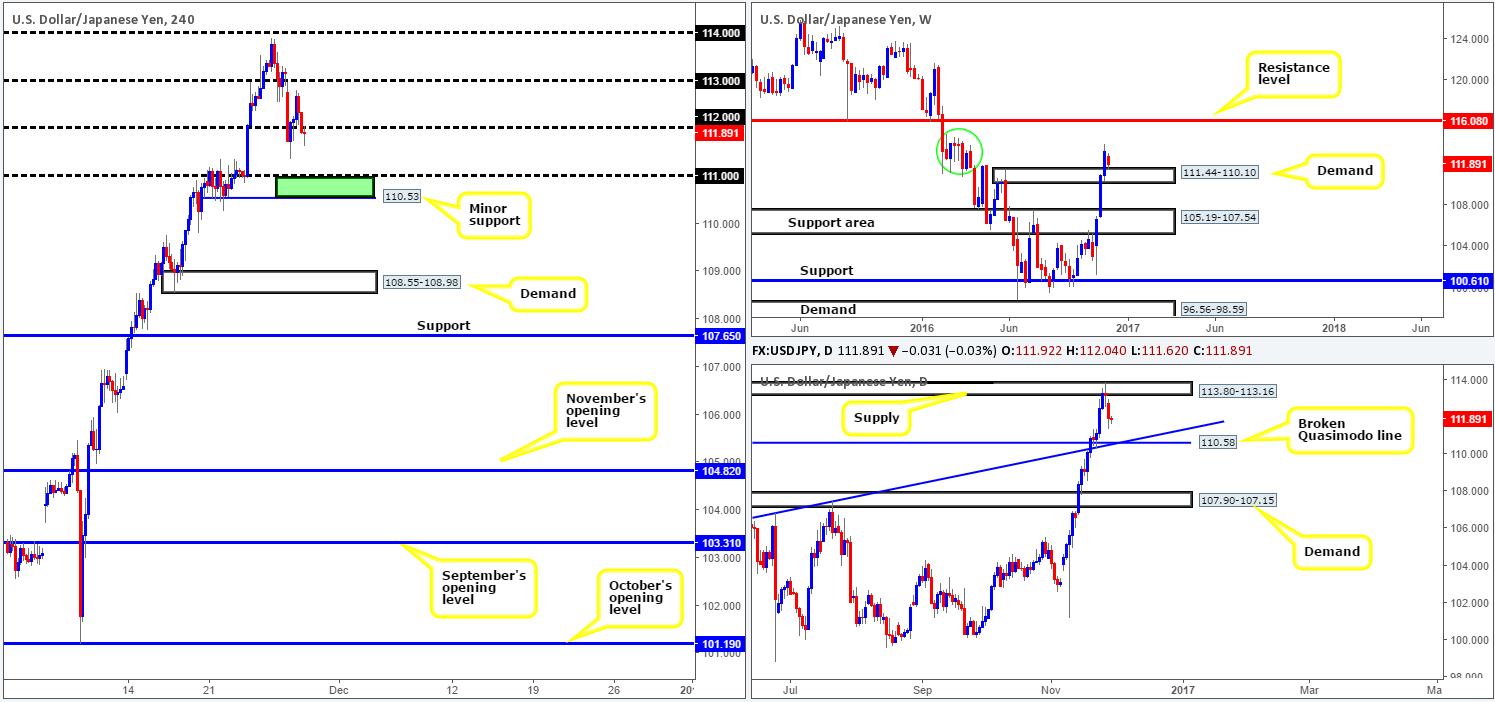
Yesterday’s action saw daily price selloff from supply at 113.80-113.16, following Friday’s indecision candle. This move was likely strengthened by the 114.87/111.44 weekly area (green circle), which, as you can see, has forced price to retest a recently broken weekly supply as demand at 111.44-110.10. In spite of this, there’s a chance that we may see price drive deeper into this weekly area in order to test the daily broken Quasimodo line at 110.58, which intersects nicely with a trendline support taken from the low 105.54.
Over on the H4 chart, nevertheless, the candles are currently retesting the underside of the 112 handle. This could, given the room seen to move lower on the daily chart, be enough to force prices down to the 111 handle, followed closely by a H4 minor support at 110.53. Would we trade short from 112? No! A short from here is risky since let’s not forget that weekly price is testing a weekly demand!
Our suggestions: There’s no immediate trade at hand right now, but we would be interested in buying from the 110.53/111 H4 region (green rectangle). This area not only sits within the above said weekly demand, it also houses the aforementioned daily broken daily Quasimodo line! However, we’ll need to see evidence of bullish interest before our team is permitted to buy from this region, as it’s practically impossible to calculate how much or little price will fake through the current daily broken Quasimodo!
Data points to consider today: US Prelim GDP at 1.30pm, US consumer confidence report at 3pm. FOMC members Dudley and Powell also take the stage at 2.15pm and 5.40pm GMT.
Levels to watch/live orders:
- Buys: 110.53/111 ([reasonably sized H4 bullish close required prior to pulling the trigger] stop loss: ideally beyond the trigger candle).
- Sells: Flat (stop loss: N/A).
USD/CAD:
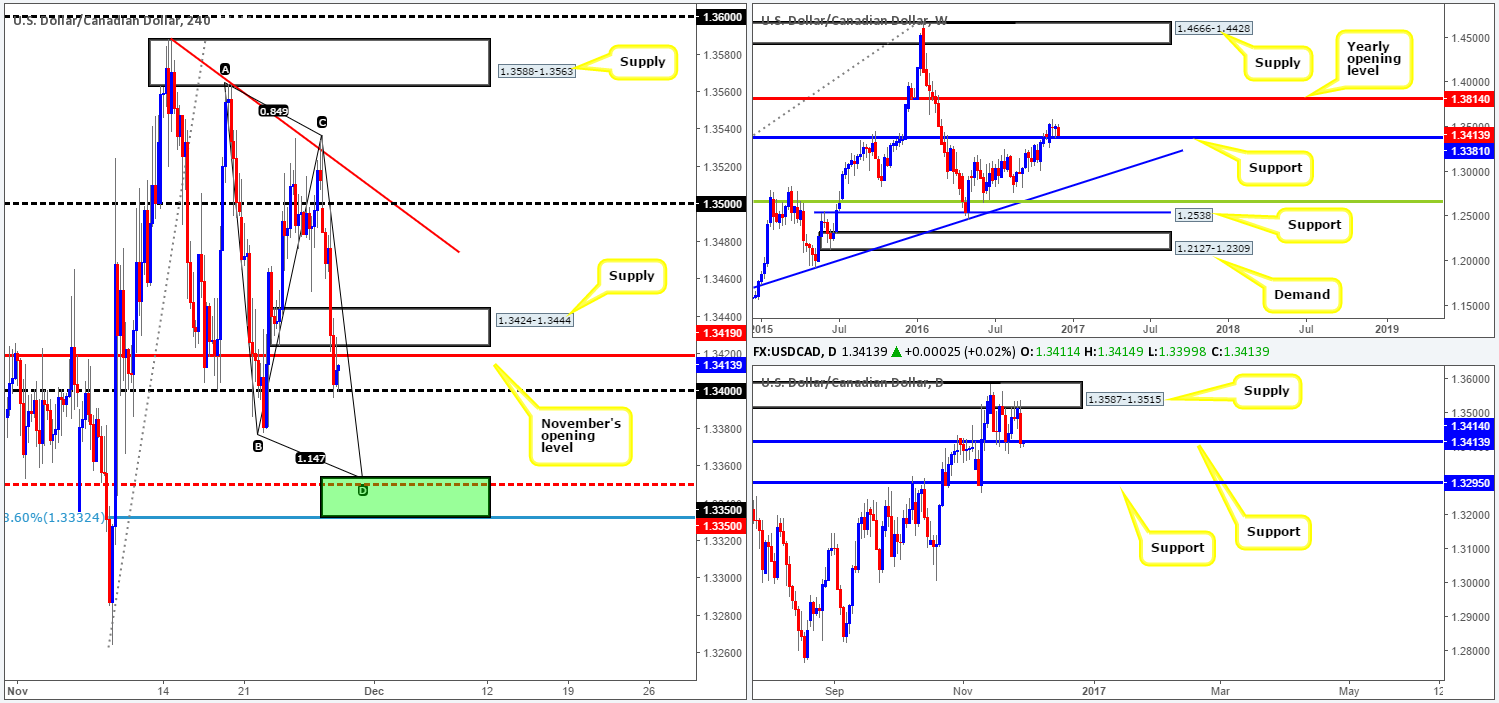
Thanks largely to comments made by Iraq’s oil minister that the country will cooperate to reach an agreement with OPEC, the oil market surged, consequently sending the USD/CAD south. H4 demand at 1.3424-1.3444 and November’s opening level at 1.3419 were both taken out during this assault, leaving price free to challenge the 1.34 handle. What this move also accomplished was a marginal close beyond the daily support boundary at 1.3414.
With upside attempts now likely to be limited by November’s opening level and the nearby H4 supply, along with the recent breach of daily support, it’s difficult for us to think bullish from 1.34. In spite of this, a nice-looking H4 buy zone caught our eye this morning a little lower down on the curve composed of: a H4 AB=CD bullish completion point at 1.3354, a H4 mid-way support at 1.3350 and a H4 78.6% Fib support at 1.3332 (green rectangle). This area also sits 27 pips below the weekly support level at 1.3381.
Our suggestions: We have absolutely no interest in shorting this market today. Yes, there has been a slight breach of a daily support, but given how close weekly price is seen to testing weekly support at 1.3381, we would not feel comfortable holding sells. Buying from the above noted H4 buy zone in bold is, however, something that interests us. Nevertheless, we would still require some form of confirmation here before entering into a buy position.
Data points to consider today: US Prelim GDP at 1.30pm, US consumer confidence report at 3pm. FOMC members Dudley and Powell also take the stage at 2.15pm and 5.40pm GMT.
Levels to watch/live orders:
- Buys: 1.3332/1.3354 ([reasonably sized H4 bullish close required prior to pulling the trigger] stop loss: ideally beyond the trigger candle).
- Sells: Flat (stop loss: N/A).
USD/CHF:
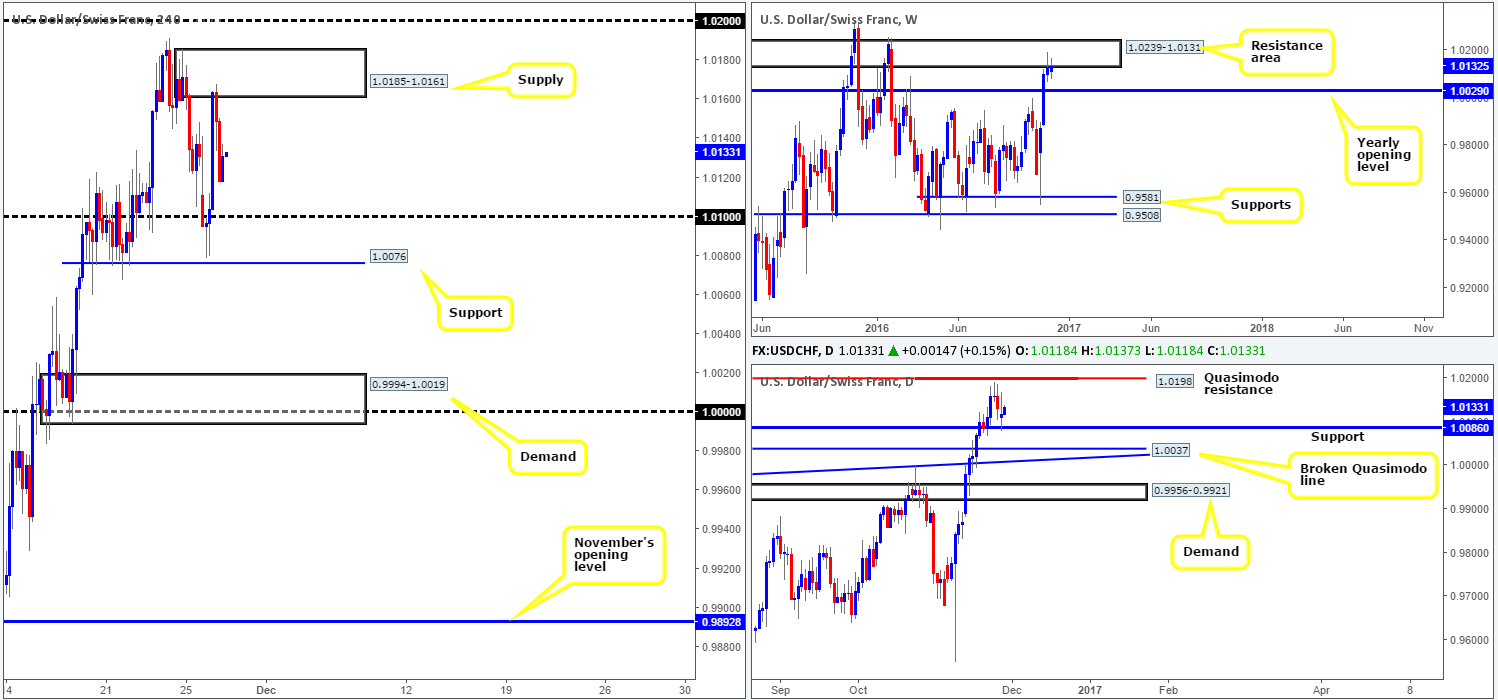
Following Sunday’s opening gap the Swissy marginally closed beyond the 1.01 handle, which, as you can see, shortly after saw price come within a whisker of connecting with H4 support at 1.0076. This support – coupled with a minor close back above the 1.01 handle was clearly enough yesterday to propel the pair beyond Friday’s closing point and into a H4 supply zone at 1.0185-1.0161.
Now, in view of the weekly candles recently nudging into a resistance area penciled in at 1.0239-1.0131, along with daily price trading off a support seen at 1.0086, medium-term is somewhat limited. However, do keep a tab on the daily Quasimodo resistance level at 1.0198, as this barrier sits comfortably within the aforementioned weekly resistance area.
Our suggestions: While the current H4 supply did a reasonably good job of holding the market lower yesterday, our prime focus today will be above this barrier at 1.02. This psychological boundary converges beautifully with the above noted daily Quasimodo resistance, which itself, as we already know, is positioned within the aforementioned weekly resistance area! Although 1.02 sports attractive confluence, a fakeout is still likely around this fixed level. As such, we would advise waiting for the lower timeframes to confirm seller interest before considering a trade here (see the top of this report) as there’s nothing worse than having your trade stopped by a few pips only to later see your target hit!
Data points to consider today: US Prelim GDP at 1.30pm, US consumer confidence report at 3pm. FOMC members Dudley and Powell also take the stage at 2.15pm and 5.40pm GMT.
Levels to watch/live orders:
- Buys: Flat (stop loss: N/A).
- Sells: 1.02 region ([waiting for lower timeframe confirming action is preferred] stop loss: dependent on where one confirms the area).
DOW 30:
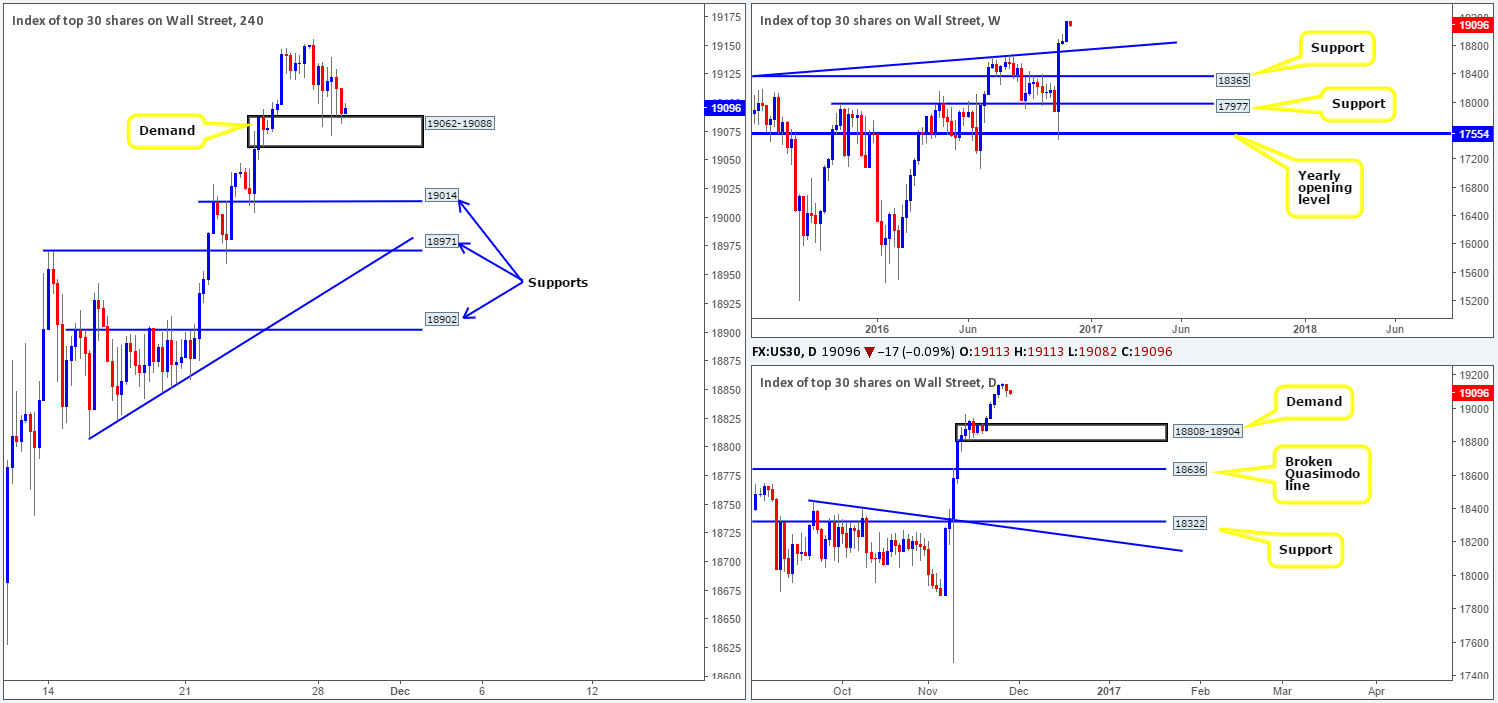
After last week’s advance, equities dipped lower on Monday, forcing the H4 candles to shake hands with demand coming in at 19062-19088. Although price remains afloat above this barrier, we may see further selling this week as, according to Bloomberg, ‘expectations for brisker economic growth under a new administration went too far too quickly’.
Personally, it is tricky to know which way to turn at the moment. While the uptrend exhibits strength, there are four potential areas to buy from:
- The H4 demand at 19062-19088.
- The H4 support at 19014, which held beautifully last Wednesday.
- The H4 support at 18971 that converges with a H4 trendline support carved from the low 18808 and also held steady last week on Tuesday.
- The only H4 area that has any connection to the higher timeframes is the lowest of the three supports at 18902, which forms the top edge of the current daily demand base at 18904.
Our suggestions: While there is a good chance that the H4 candles could rally from the current H4 demand base, we feel it may be best to hold fire for now and reassess going into tomorrow’s session. The reason being is we prefer to trade H4 zones when they have some connection to the higher timeframes, and right now, the only area that satisfies that requirement is the lowest of the four above noted areas at 18902, which is quite a way from current price!
Data points to consider today: US Prelim GDP at 1.30pm, US consumer confidence report at 3pm. FOMC members Dudley and Powell also take the stage at 2.15pm and 5.40pm GMT.
Levels to watch/live orders:
- Buys: 18902 ([in light of its connection with the daily timeframe, one could, dependent on the time of day, consider entering here at market] stop loss: below the H4 candle tail of 18859).
- Sells: Flat (stop loss: N/A).
GOLD:
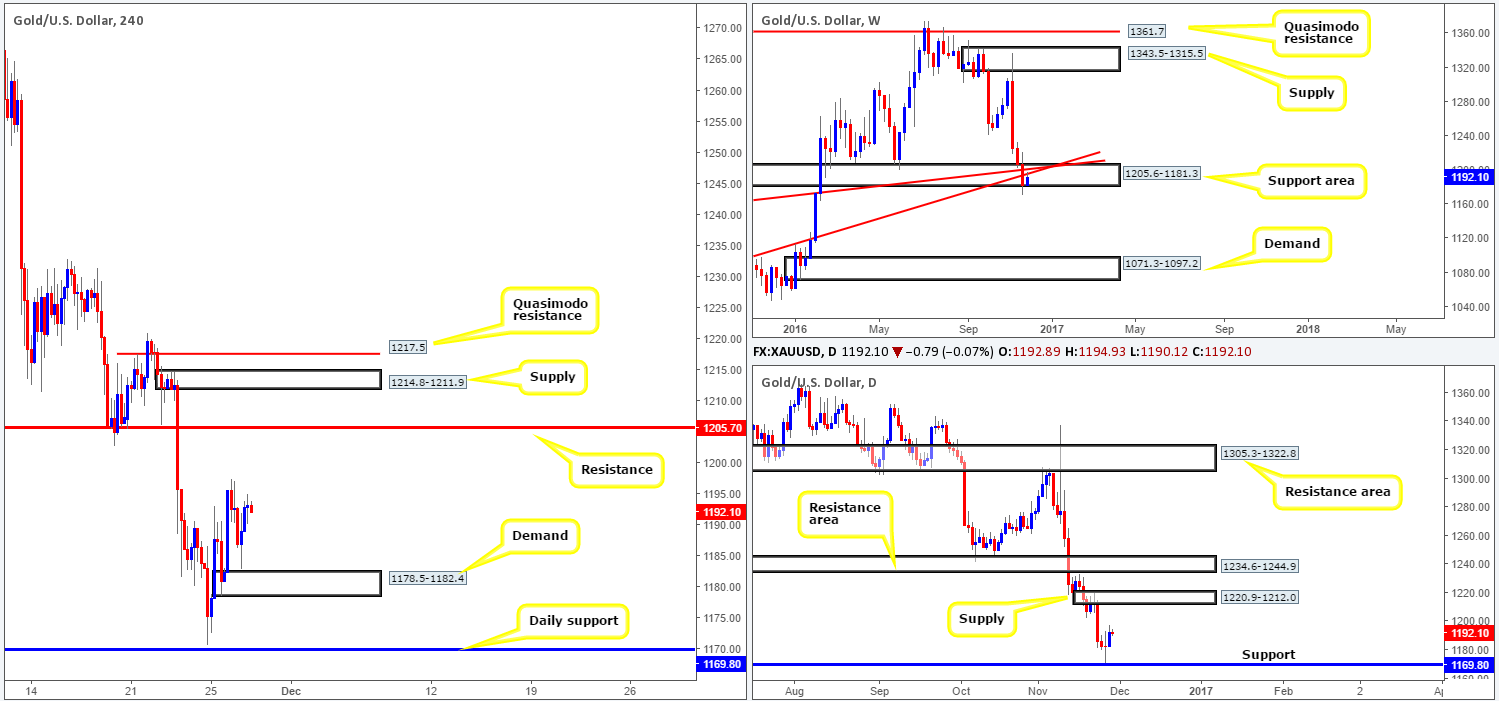
Kicking this morning’s report off with a look at the weekly timeframe, we can see that the current weekly candle is retesting the underside of last week’s broken trendline supports (1130.1/1071.2) as resistance. On the other side of the field, however, daily price extended north yesterday following Friday’s near-touch of support drawn from 1169.8. The next upside hurdle in view can be seen at 1220.9-1212.0: a supply zone. Looking over to the H4 chart, there is room for this market to continue rallying north towards resistance penciled in at 1205.7. With this in mind, here is what we have jotted down so far:
- Longs in this market are a possibility from the H4 demand at 1178.5-1182.4 today given the upside space seen on the H4/daily charts. Nonetheless, one must always remain cognizant of the fact that weekly price could turn bearish at any time given its position (see above). Take-profit targets for longs are the above said H4 resistance, followed by H4 supply at 1214.8-1211.9 and then the H4 Quasimodo resistance at 1217.5.
- To sell, we would not really place much emphasis on the current H4 resistance level. It is the H4 supply and H4 Quasimodo resistance that carry weight, in our opinion. This is due to both areas being housed within the current daily supply base.
Our suggestions: To trade long from the current H4 demand, we’d advise waiting for a reasonably sized H4 bull candle to form, since trading from here places one at risk of getting stung by a fakeout back down to daily support at 1169.8. Along the same vein, shorts from the above noted H4 supply and H4 Quasimodo resistance would also require confirming price action. Though, since both areas are packed reasonably close to each other, we would opt to wait for lower timeframe confirming action rather than a H4 candle (see the top of this report).
Levels to watch/live orders:
- Buys: 1178.5-1182.4 ([reasonably sized H4 bullish close required prior to pulling the trigger] stop loss: ideally beyond the trigger candle).
- Sells: 1217.5/1214.8-1211.9 ([waiting for lower timeframe confirming action is preferred] stop loss: dependent on where one confirms the area).


